Untargeted Screening and Identification of Contaminants Using Gas Chromatography Coupled to High-Resolution Accurate Mass–Mass Spectrometry: Novel Solutions for Applied Testing Laboratories
The combination of gas chromatography (GC) instruments with quadrupole-based mass spectrometers is a common analytical setup for the detection of a broad range of volatile and semivolatile contaminants. GC–mass spectrometry (MS) (nominal mass) instruments are well known for their robustness and ease of use. However, they have some important limitations. Single quadrupole instruments can perform full scan analysis, but their sensitivity and selectivity in this mode are limited. Triple quadrupole (GC–MS/MS) systems are limited to a targeted acquisition within a specified compound list. High-resolution accurate mass (HRAM) mass spectrometry can overcome these limitations.
High-resolution accurate mass (HRAM) mass spectrometry provides a highly sensitive and selective alternative non-targeted acquisition and surpasses quadrupole instruments in all non-targeted applications. HRAM offers numerous advantages over low-resolution MS for the identification of unknown substances, because the elemental composition of the acquired ions can be reliably obtained from their exact mass, supporting any identification. In addition, HRAM brings higher selectivity than gas chromatography–mass spectrometry (GC–MS) so that more features are detected and subsequently identified. However, to fully realize the benefits of an HRAM system, it is essential that powerful software be available to convert high quality data into robust scientific discovery (1).
Targeted analysis is performed on a routine basis in samples of all kinds for known contaminants—for example, in environmental analysis and food safety testing. Typical analytes include, for example, polychlorinated biphenyls (PCBs), polychlorinated dibenzodioxins (PCDDs), polyaromatic hydrocarbons (PAHs), brominated flame retardants (BFRs), and pesticides. However, in some cases, contaminants are not known or not present in all samples. Therefore, non-targeted screening is an analytical approach has gained attention in recent years.
Non-targeted screening predominantly means to search for so-called “known unknowns,” or, more specifically, species known in the chemical literature or MS reference databases, but unknown to the investigator (2). In targeted methods, contaminants potentially present can be simply overlooked, or the creation or expansion of an existing method could only be done through time-consuming optimization and use of analytical standards, which can be very expensive and, on occasion, unavailable.
HRAM–MS offers numerous advantages over nominal mass MS for the identification of unexpected substances, not only in terms of higher selectivity, but, more importantly, because the elemental composition of the acquired ions can be reliably obtained from their exact mass. Where an unknown compound is encountered, HRAM, such as an orbital ion trap mass spectrometer, provides high quality accurate mass data using either electron ionization (EI) or chemical ionization (CI) to identify molecular ions and perform fragmentation studies using tandem mass spectrometry (MS/MS). With such high quality and comprehensive data, it is essential that intuitive informatics exist to extract all features, visualize results, and derive meaningful conclusions.
The objective of this study is to outline typical workflows that can be applied to the identification of unknown compounds in samples and approaches to visualize results to allow for confident interpretation of data sets comprising different samples with unknown composition. This approach was applied to the analysis of soil samples for potential contaminants (3), as well as to the tentative identification of unknown migrant substances, including both intentionally added and non-intentionally added substances (IAS and NIAS) in plastic food contact materials (FCMs) (4).
Experimental
Instrumentation
The samples were analyzed with a Thermo Scientific Orbitrap Exploris GC 240 mass spectrometer coupled to a Thermo Scientific TRACE 1610 gas chromatograph and a Thermo Scientific TriPlus RSH SMART autosampler. All the instrumental parameters are shown in Table I.
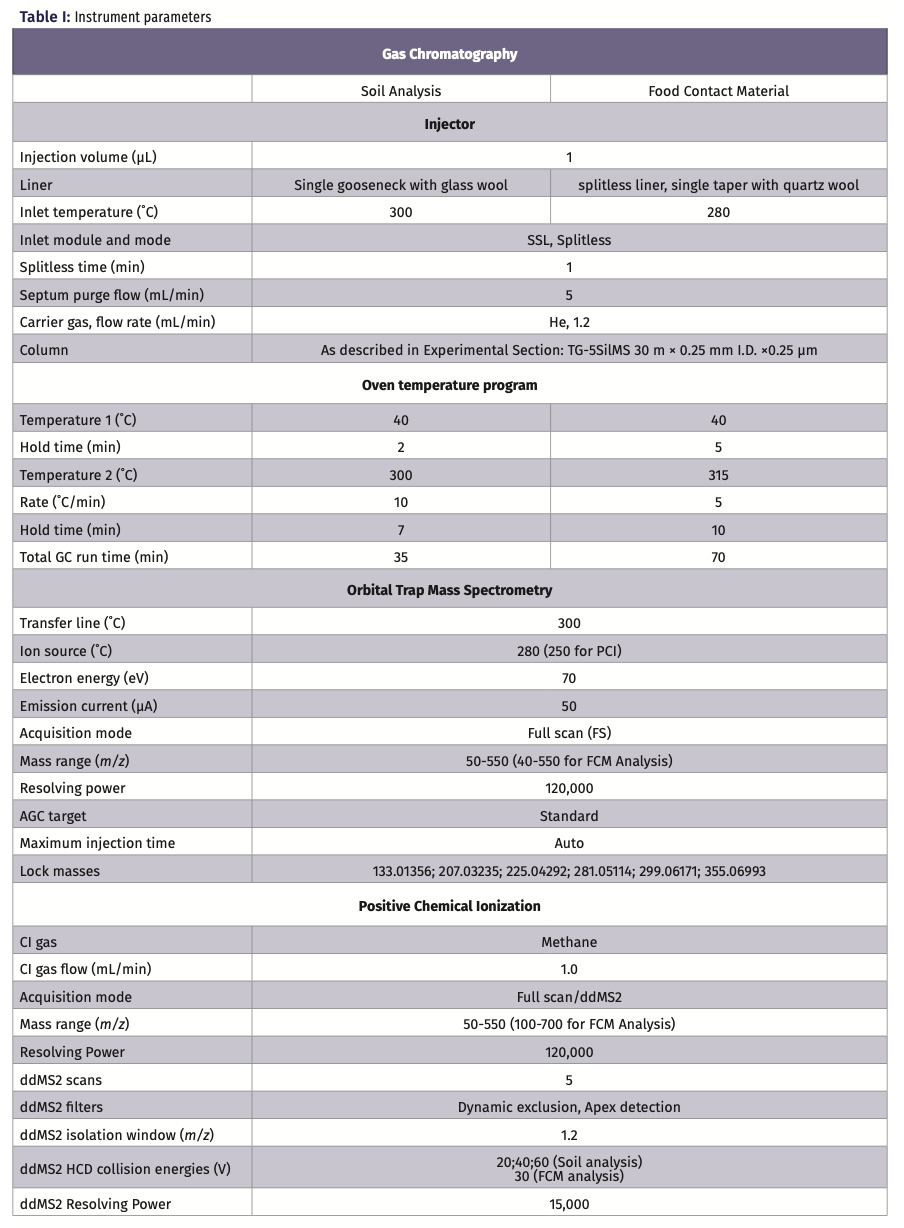
All data steps related to data evaluation, such as compound identification and statistical analysis, were performed using Thermo Scientific Compound Discoverer software.
Sample Preparation
Three soil samples were taken from various locations in and near to Bremen, Germany. They were collected in proximity of a motorway junction, close to an airport, and in a neighborhood of single-family (detached) houses. The samples were extracted without any pretreatment. A 2 g portion of soil was weighed in a polypropylene tube, followed by the addition of 4 mL of acetonitrile and vortexing for 5 min. Acetonitrile is a water-miscible solvent, facilitating the extraction of organic contaminants in humid soils. Next, 4 mL of hexane were added and vortexed again in the same manner. Organic contaminants were transferred to the hexane phase through liquid–liquid partitioning between hexane and acetonitrile solvent layers. Subsequently, the tube was centrifuged for 5 min at 4000 rpm with the hexane layer transferred to a GC vial and injected.
The sample of a food packaging material analyzed in this study was a post-consumer recycled low-density polyethylene (LDPE) film. For the solvent extraction, a square piece (5 cm × 5 cm) was prepared. It was placed in a 50 mL glass beaker with 20 mL of acetone and incubated at 40 °C for 1 h. The beaker was sealed with aluminum foil to prevent solvent evaporation. After the extraction, the whole volume of acetone was transferred to a second glass beaker and evaporated to a final volume of approximately 0.5 mL using a gentle nitrogen stream. The concentrated extract was transferred to a 1 mL volumetric flask and filled to the mark with acetone. This solution was transferred into an injection vial.
Results and Discussion
Data Analysis and Compound Identification
This study highlights the benefits of the application of HRAM instrumentation using two specific examples: the assessment of the chemical profile of soil sample extracts taken from three locations near Bremen, Germany, and the tentative identification of unknown migrant substances in food contact materials.
In the European Union (EU), plastic materials and articles intended to come into contact with food must comply with Commission Regulation (EU) No 10/2022 and amendments (5). This regulation contains a list of authorized monomers, other starting substances, macromolecules obtained from microbial fermentation, additives, and polymer production aids (IAS) that can be used for the manufacture of plastic food contact materials (FCMs). However, during the manufacturing processes and uses of plastic FCMs, the reaction and degradation of products can occur, forming non-intentionally added substances (NIAS) in the plastic material. For this reason, the risk associated with the presence and potential release of NIAS should be assessed before the authorization of an FCM (6). It is therefore important that analytical testing laboratories not only are able to test for known allowed and non-allowed substances, but also have access to a method that allows the tentative identification of unknown migrant substances (IAS/NIAS) in plastic FCMs.
In the first stage of data processing, the full scan EI results were evaluated using a workflow including spectral deconvolution followed by spectral matching with the NIST 2020 library. The “Mark Background Compounds” node was added to simplify further data analysis. A compound that has a peak area of typically less than five times the area observed in a blank sample is marked as a background compound and can be hidden in the results.
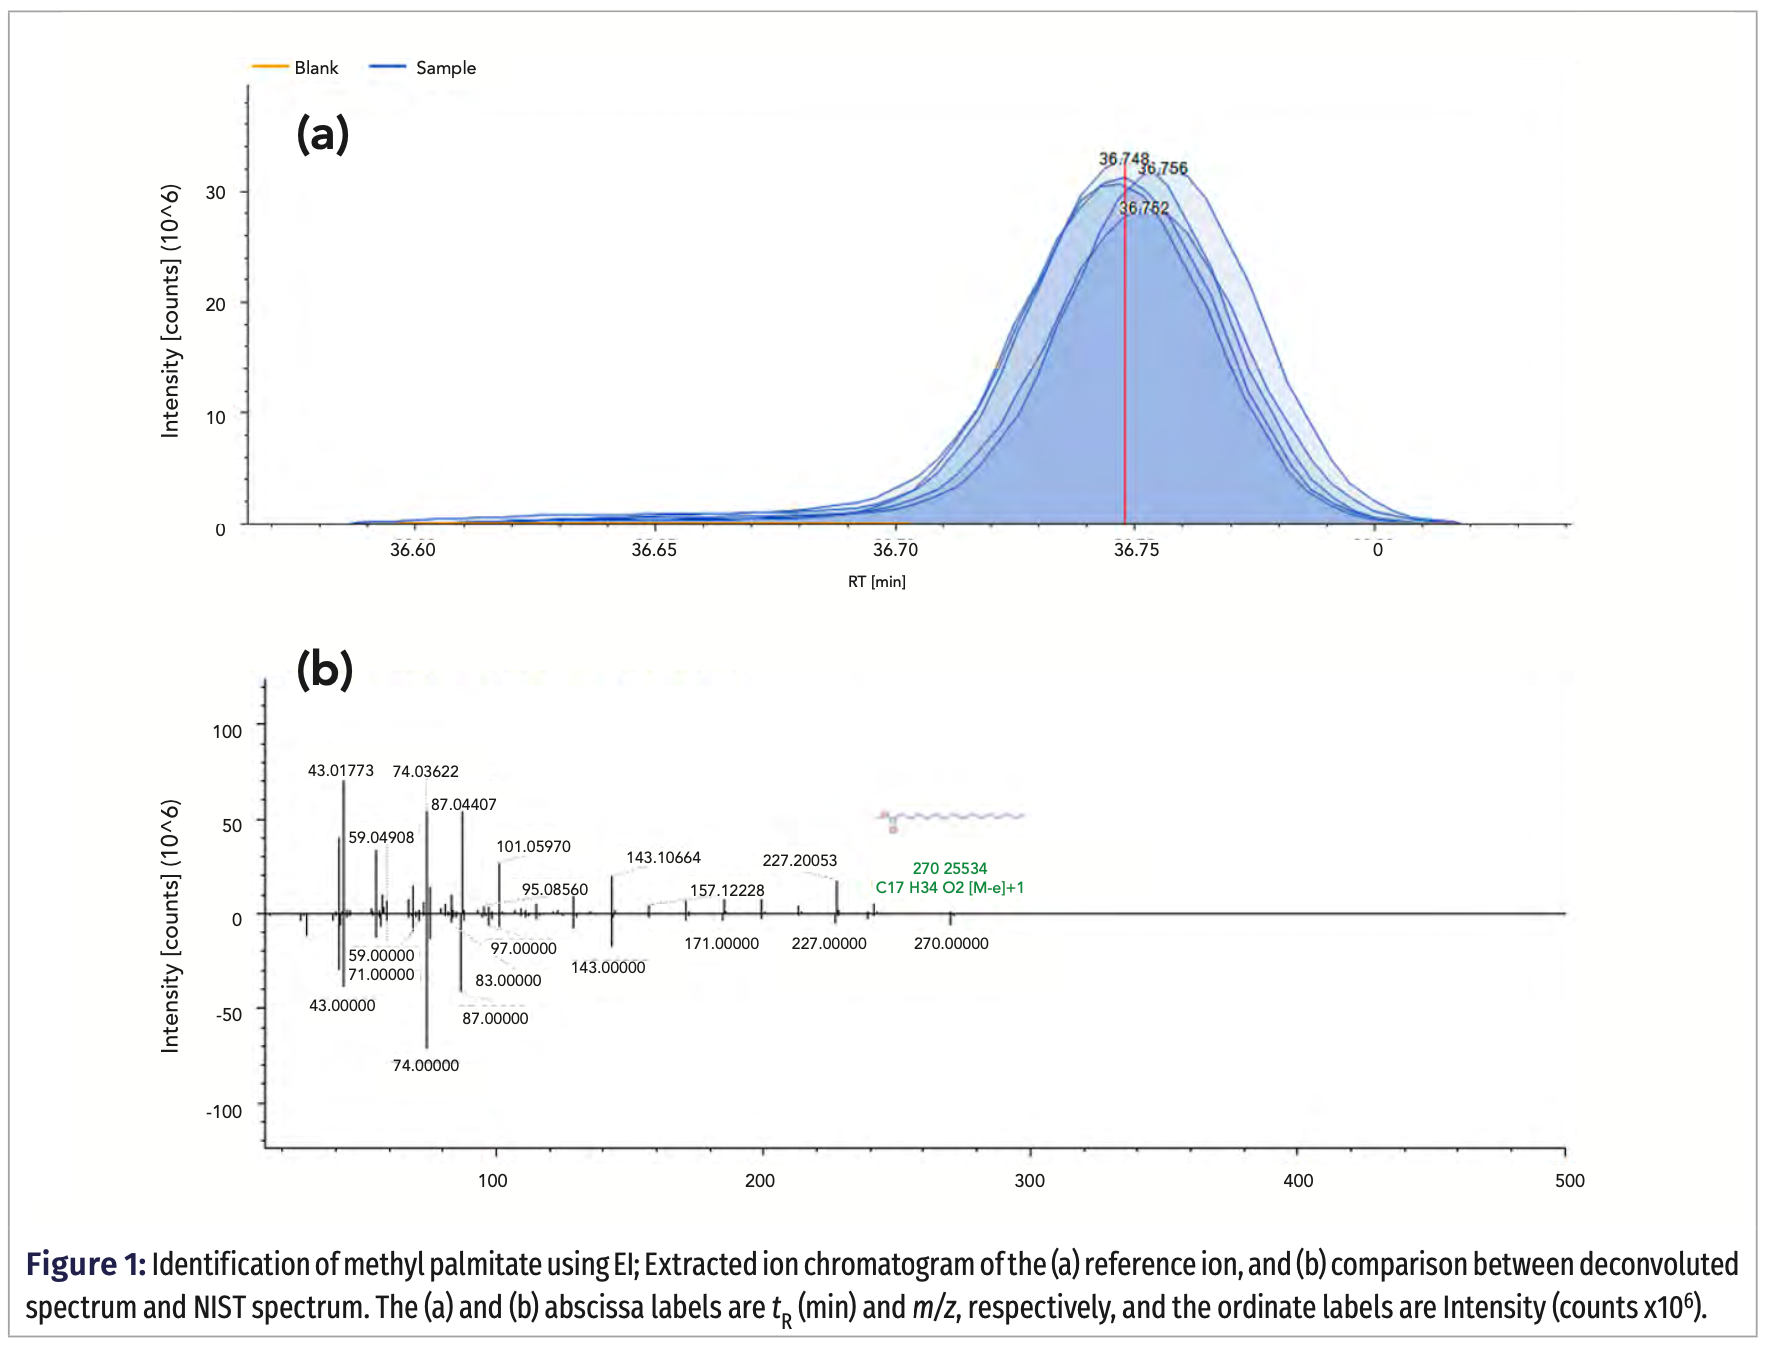
In the sample under investigation, a total of 260 features (or unidentified compounds) were detected after background removal. Identification using a NIST library search made it possible to identify 150 features with a Total Score above 90%. Total Score is a parameter that includes NIST search index (SI) and NIST reversed search index (RSI) as well as high-resolution filtering (HRF) and reverse high-resolution filtering (RHRF). The latter two reflect the percentage of the spectrum that is explained by the chemical formula proposed from the best library hit. Additionally, for the compounds that had an RI value in the NIST library, a criterion of ΔRI < 50 was applied. That step reduced the number of identified compounds to 112. One of the compounds identified this way was methyl palmitate, with a total score of 95.4% and a ΔRI 4.
Figure 1 shows the extracted ion chromatograms of the reference ion, including all replicates, and a comparison of the deconvoluted spectrum with the spectrum present in the NIST library. Although Compound Discoverer software is designed to process high-resolution data only, it is fully compatible with nominal-mass NIST libraries. Methyl palmitate was identified against this library; therefore, the reference spectrum shows only zeros in the decimal places.
To confirm the identification, the positive chemical ionization (PCI) data were reviewed. Figure 2 shows the PCI MS spectrum at the retention time corresponding to the peak identified in EI as methyl palmitate. Compound Discoverer software found various forms and adducts of the methyl palmitate molecular ion ([M-H-]+; [M+H]+; [M-e]+; [M+C2H5]+; [M+C3H5]+). Moreover, the isotopic pattern corresponding to the protonated molecule of methyl palmitate was observed.

In the PCI acquisition method, the full scan MS was combined with data dependent MS2. This means that every full scan spectrum was followed by the MS2 analysis of the five most abundant ions in that spectrum.
The availability of the MS2 data provided additional confirmation tools. A search in MS2 libraries and databases is the most straightforward way to utilize MS2 scans. A particularly useful database in many cases is the mzCloud database, an exact mass library that contains both MS as well as MS2 data, with fragmentations acquired with multiple collision energies. For methyl palmitate, the compound detected at m/z 271.2634 (presumably the protonated molecular ion), the match was determined to 85.9%.
Although MS2 libraries are highly useful to confirm the identification of unknown compounds, they may not be available for all unknown substances contained in a sample. In such cases, the FISh scoring function can be very helpful. FISh scoring is applied to explain the fragments in the fragmentation spectra based on in silico fragment prediction. The algorithm compares the experimental fragmentation spectra for a compound to the expected fragmentation spectra based on the structure of the compound, including possible rearrangement reactions. Moreover, it annotates the centroids in the fragmentation scans with the matching fragment structures.
In the case of methyl dehydroabietate (methyl abieta-8,11,13-trien-18-oate; exact mass 314.22458 Da), identified in EI and confirmed in PCI mode by detection of various adducts and expected isotopic pattern, no match was found in the mzCloud spectral library. Thus, the only way to take advantage of the MS2 data was to apply in silico fragmentation (Figure 3).
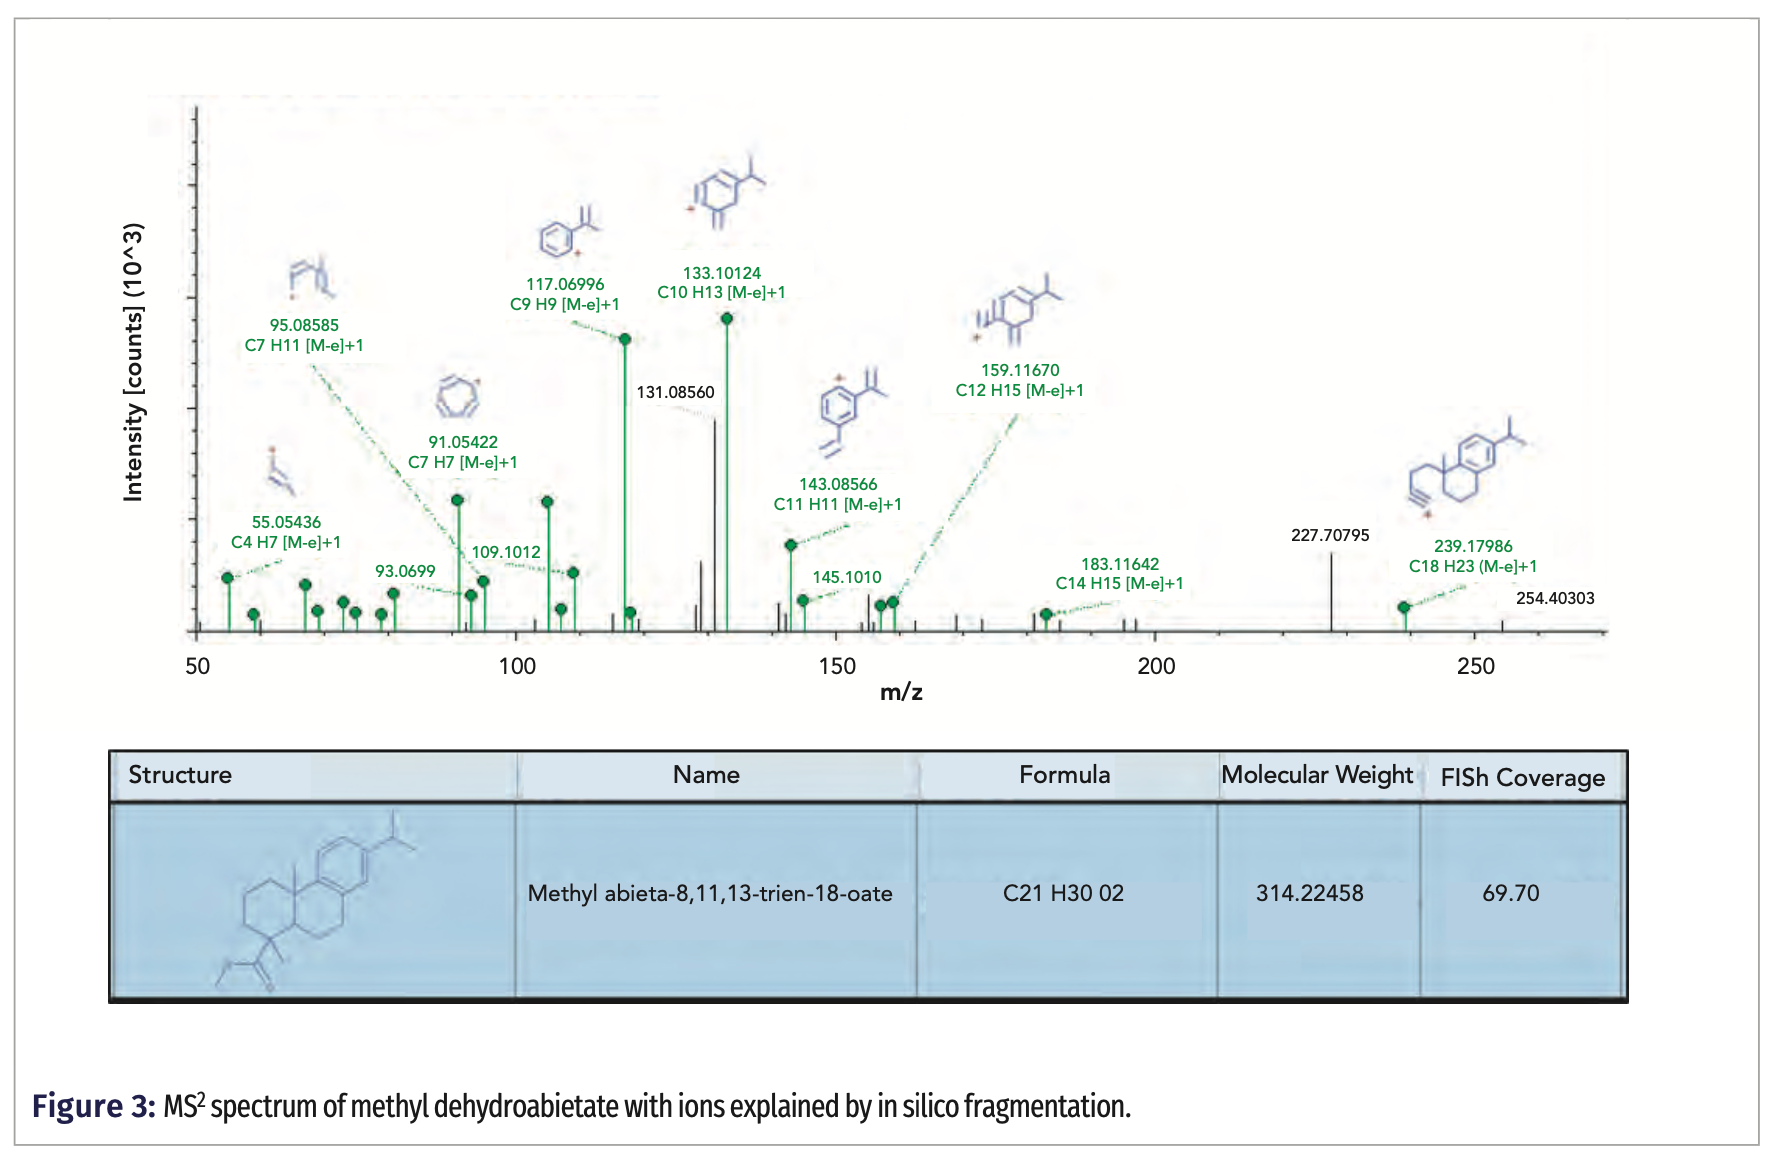
Although the FISh coverage was determined to be only 69.70, it worth noting that the non-explained ions have low intensity. Moreover, many of the explained ions have m/z > 100, which means that they are very selective, and they provide high confidence in the identification.
Data Visualization
The same experimental approach was used to assess the chemical profile of soil sample extracts taken from three locations near Bremen, Germany. The first objective was to identify if there were any significant difference between the three soil samples. This was achieved through a differential analysis of the replicate injections of each sample. Figure 4 shows the good agreement of the replicate injections (pyrene is used as an example compound) and the differences between two of the three samples. The subsequent steps then help identify which peaks contribute to the differences so that a compound identification can be proposed.
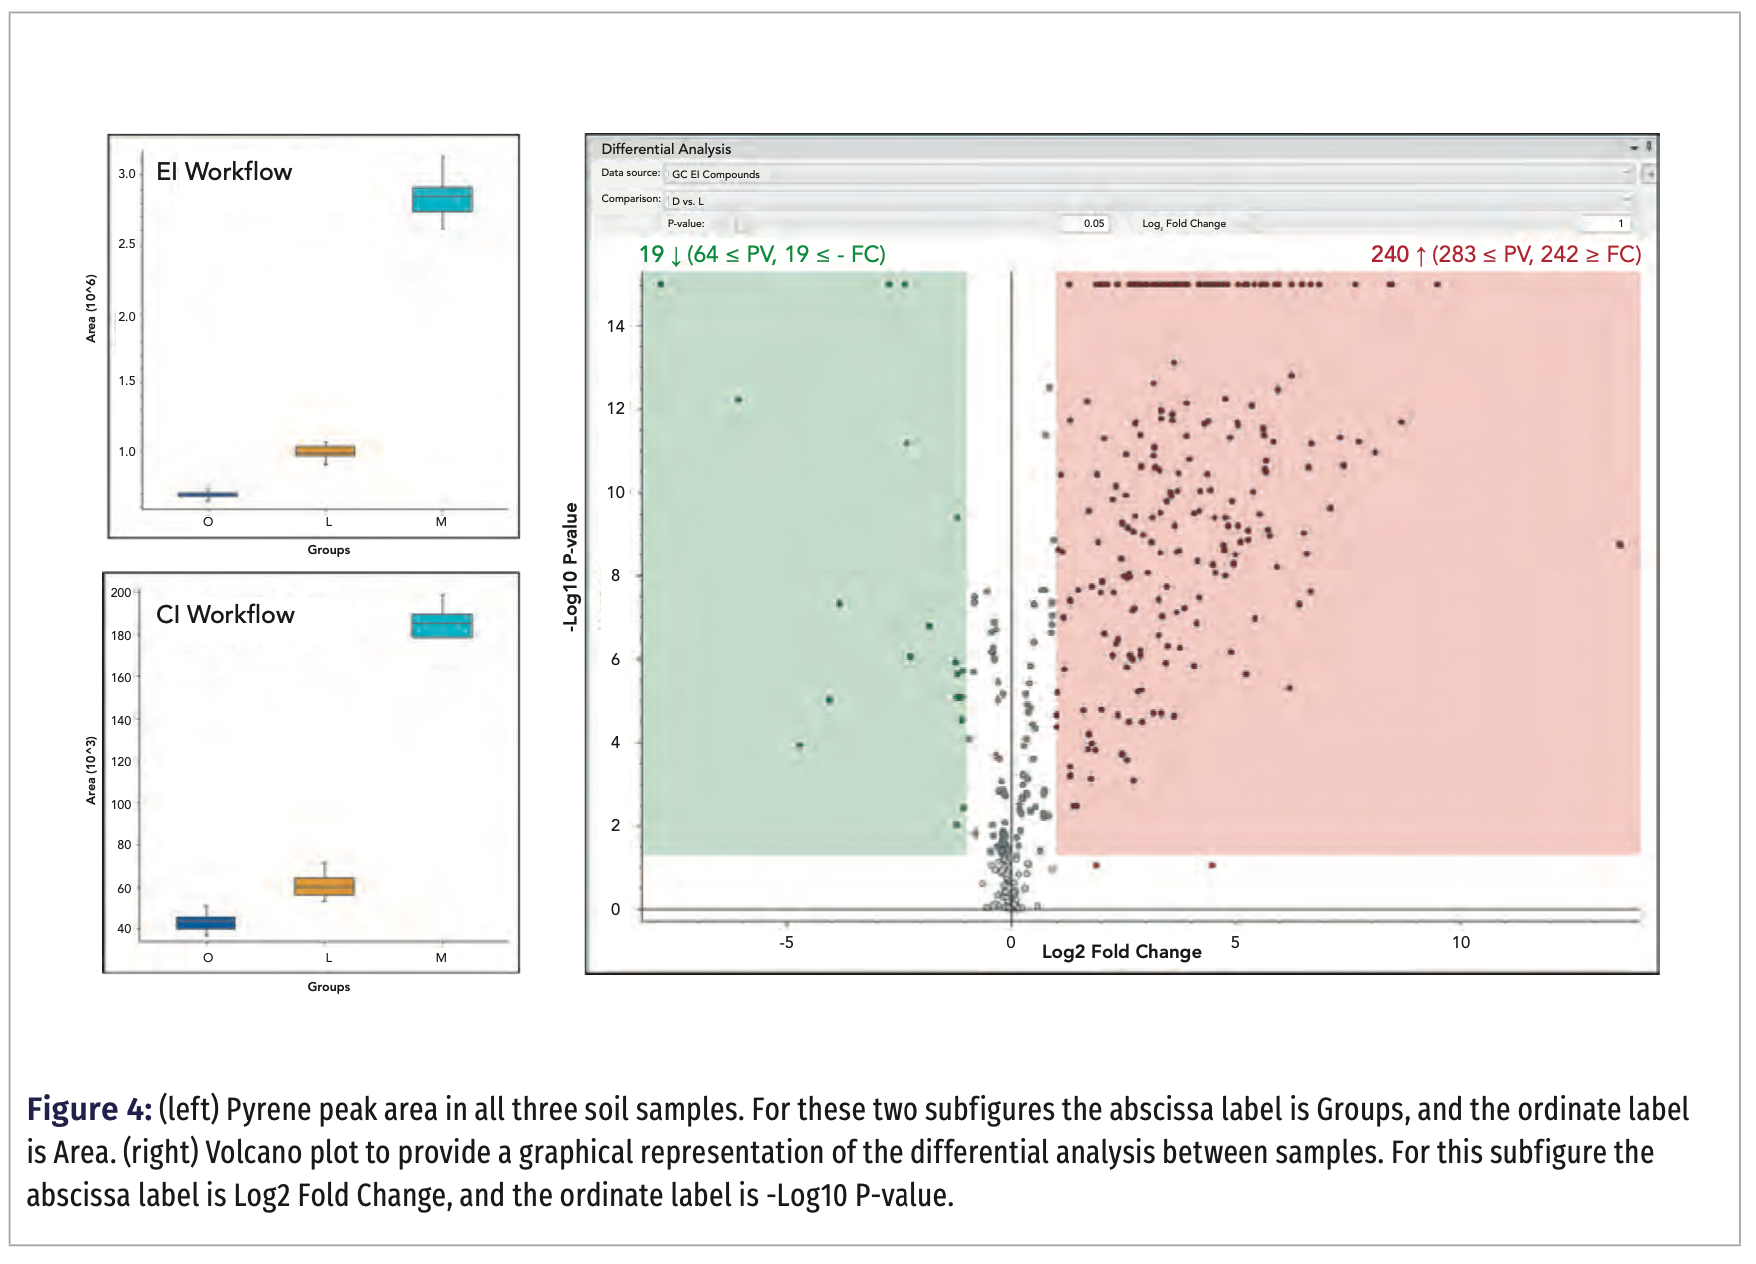
As an example, Figure 4 shows a volcano plot for samples D and L. The volcano plot is a type of scatter plot for replicate data where the x-axis represents the log2 of the fold change between two sample groups (generated ratio), and the y-axis represents the negative log10 of the p-value (test of significance) of the fold change. In other words, when a point (compound) appears more on the right side of the plot (positive values on x-axis), the peak area of that compound is much higher in sample D than in sample L. Points that are higher on the graph are statistically more significant. It can be easily recognized that sample D contained more characteristic compounds than sample L.
In the discussed samples, most of the detected compounds were related to the presence of the soil organic matter; however, common contaminants also could be identified. Pyrene was present in all three analyzed soils; however, its signal was the highest in sample M. Using EI, pyrene was identified, achieving a search index of 897 and a reversed search index of 932. Pyrene and other PAHs produce a stable and intense molecular ion, which is not very common in EI. In addition, the presence of pyrene was confirmed in the CI mode.
In addition to pyrene, the samples also contained fluoranthene and perylene, again with peak areas being the greatest in sample M. This finding can be explained by the fact that this sample was collected in a neighborhood of detached houses, many of which have a fireplace. This could be the reason of the elevated amounts of PAHs in the surrounding soil.
Conclusions
High-resolution accurate mass (HRAM) mass spectrometry, in combination with powerful processing software, is an excellent tool for the identification of known and unknown contaminants, even in highly complex sample types. The use of different ionization techniques, like EI and CI, provide complementary data sets, allowing access to molecular ions and fragmentation products for compound identity confirmation. Database searching, using MS data or using the option to further generate fragmentation in the mass spectrometer, further help elucidate or confirm unknown compounds. Statistical analysis and graphical visualization tools facilitate the interpretation of results. Differential analysis, for example using volcano plots, is useful in the global comparison between two selected samples, whereas other representations, such as whisker charts, allow the comparison of a compounds peak area across all samples.
References
(1) Thermo Fisher Scientific Technical Note 10730. Mass resolving power of 240,000: for confident compound identification, 2020.
(2) Cleven, C. D.; Howard, A. S.; Little, J. L.; Yu K. Identifying “Known Unknowns” in Commercial Products by Mass Spectrometry. LCGC Eur. 2013, 26 (3), 163‒168.
(3) Thermo Fisher Scientific Application Note 1605. Differential analysis of soil using the Orbitrap Exploris GC 240 mass spectrometer and Compound Discoverer software, 2022.
(4) Thermo Fisher Scientific Application Note 1607. Untargeted screening and identification of substances in plastic food contact materials using an Orbitrap Exploris GC 240 mass spectrometer, 2022.
(5) European Commission. Commission Regulation (EU) No 10/2011 of 14 January 2011 on Plastic Materials and Articles Intended to Come into Contact with Food. http://data.europa.eu/eli/reg/2011/10/2020-09-23 (accessed 2021-09-20).
(6) International Life Science Institute (ILSI) Europe. Guidance on Best Practices on the Risk Assessment of Non-Intentionally Added Substances (NIAS) in Food Contact Materials and Articles; ILSI Europe: Brussels, Belgium, 2015. https://ilsi.org/europe/wp-content/uploads/sites/3/2016/04/2015-NIAS_version-January-2016.pdf (accessed 2022-12-15).
Łukasz Rajski and Daniel Kutscher are with Thermo Fisher Scientific, in Bremen, Germany. Dominic Roberts is with Thermo Fisher Scientific, in Hemel Hempstead, United Kingdom. Direct correspondence to: daniel.kutscher@thermofisher.com

New Study Reviews Chromatography Methods for Flavonoid Analysis
April 21st 2025Flavonoids are widely used metabolites that carry out various functions in different industries, such as food and cosmetics. Detecting, separating, and quantifying them in fruit species can be a complicated process.
University of Rouen-Normandy Scientists Explore Eco-Friendly Sampling Approach for GC-HRMS
April 17th 2025Root exudates—substances secreted by living plant roots—are challenging to sample, as they are typically extracted using artificial devices and can vary widely in both quantity and composition across plant species.
Sorbonne Researchers Develop Miniaturized GC Detector for VOC Analysis
April 16th 2025A team of scientists from the Paris university developed and optimized MAVERIC, a miniaturized and autonomous gas chromatography (GC) system coupled to a nano-gravimetric detector (NGD) based on a NEMS (nano-electromechanical-system) resonator.
Miniaturized GC–MS Method for BVOC Analysis of Spanish Trees
April 16th 2025University of Valladolid scientists used a miniaturized method for analyzing biogenic volatile organic compounds (BVOCs) emitted by tree species, using headspace solid-phase microextraction coupled with gas chromatography and quadrupole time-of-flight mass spectrometry (HS-SPME-GC–QTOF-MS) has been developed.


