An LC–MS/MS Method for the Evaluation of Intestinal Permeability in Blood Plasma
The measurement of intestinal permeability is important for diagnoses of diseases of the gastrointestinal tract, such as Crohn’s disease. The gold standard for measurement of intestinal permeability is the dual sugar absorption test, which measures the urinary or blood concentrations of two orally administered sugars, a monosaccharide and a disaccharide, over a period of time. The lining of the small intestine allows monosaccharides to cross into the bloodstream, but the larger disaccharide is not permitted to cross the intestine unless the barrier is compromised. The permeability of the lining is measured by a ratio between select monosaccharides and disaccharides, and this indicates the overall status of the small intestine. In order to study the effects of resistance exercise on intestinal permeability in human subjects, we developed a liquid chromatography tandem mass spectrometry (LC–MS/MS) method for the analysis of saccharides in blood plasma. The analytes included rhamnose, a monosaccharide not commonly found in food, and lactulose, a disaccharide. A trisaccharide, raffinose, was used as an internal standard. The method was robust, and had consistent reliability.
The intestinal barrier has a surface area of 400 m2, and is responsible for 40% of energy expenditure in humans. The intestinal barrier is a multilayer entity that separates the gut lumen from the host bloodstream; its layers include a mucous layer adjacent to the gut lumen, epithelial cell lining, and a vascular endothelium. The barrier permits the exchange of molecules and absorption of nutrients in the diet, and it prevents the transport of antigens and microorganisms into the blood circulation of the host. The ability of molecules to pass through the intestinal barrier by non-mediated diffusion is intestinal permeability (1). Alterations in permeability of the intestinal lining lead to an increased uptake of luminal antigens, which could cause inflammation (2). The measurement of intestinal permeability is important for diagnoses of diseases of the gut such as Crohn’s disease, irritable bowel syndrome, and celiac disease.
Researchers have used markers to follow the passage of molecules through the intestinal barrier for hundreds of years. Martin Lister in 1673 and William Musgrave in 1701 introduced milk colored with blue dye into the small intestine of living dogs to show that the dye passes from the intestinal lumen into lacteals by monitoring the appearance of blue color in the lacteals (3,4). In 1930, McCance and Madders introduced rhamnose, xylose, and arabinose as absorption test makers (5). In the 1960s, the use of noninvasive tests for assessment of intestinal permeability in patients with gastrointestinal disease was introduced by measuring disaccharides in urine by paper chromatographic techniques (6). By the late 1970s, intestinal permeability tests were reported where participants had an oral dose of a disaccharide (lactulose) and a monosaccharide (rhamnose), and the permeability was determined by measuring the urinary excretion of the test disaccharide (7).
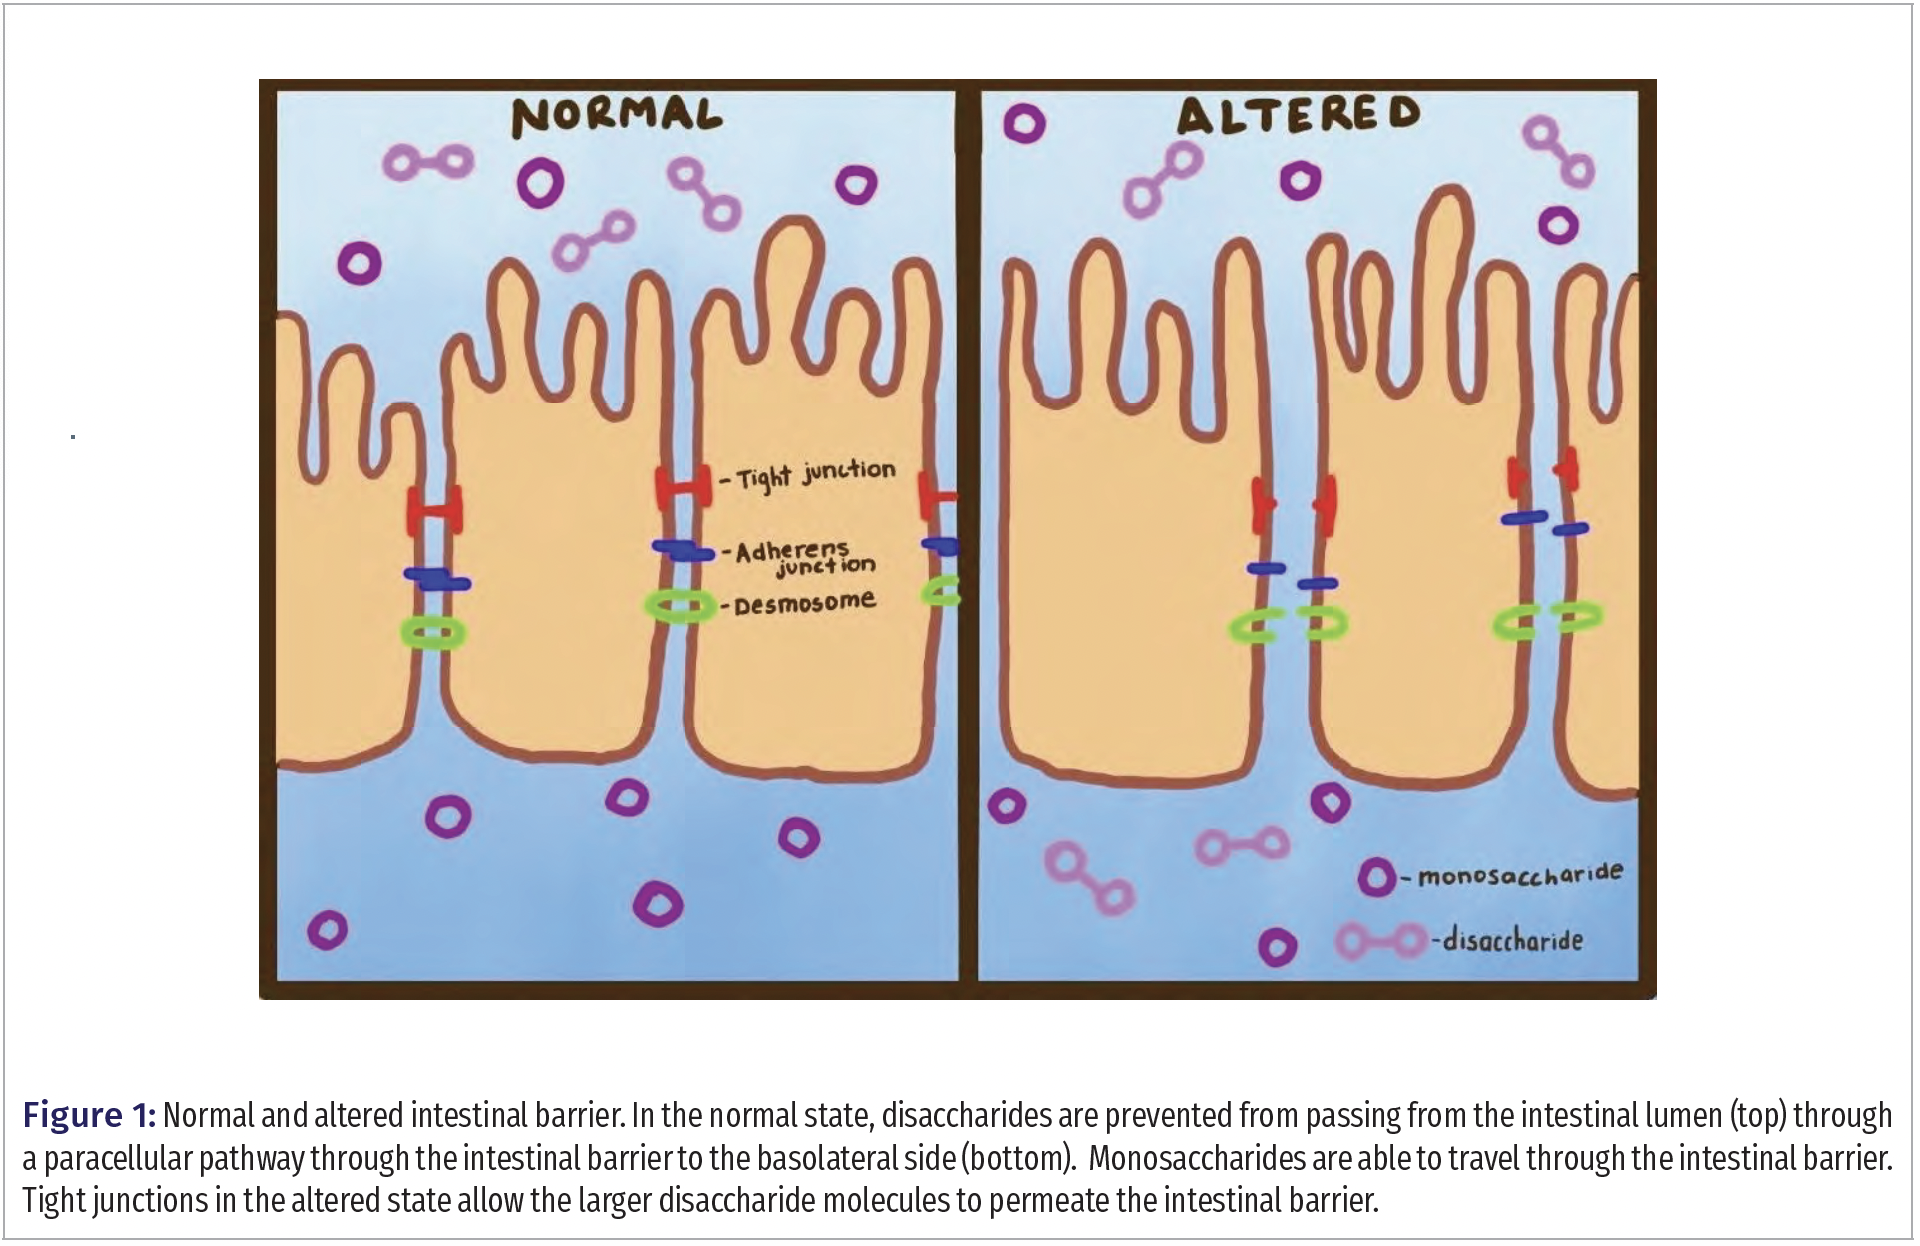
Currently, the most reliable way to evaluate intestinal permeability is through the dual sugar absorption test, which measures the urinary concentrations of two sugars ingested orally over a duration of time (2). The lining of the small intestine allows the passage of monosaccharides into the bloodstream, but the larger disaccharides are only allowed passage if the intestinal barrier is compromised (Figure 1). The permeability of the lining is measured by a ratio between select monosaccharides and disaccharides, and this indicates the overall status of the small intestine. Typical sugars used to determine intestinal permeability include lactulose (disaccharide) and mannitol (monosaccharide).
Often, lactulose is the disaccharide and mannitol is the monosaccharide in dual sugar absorption tests. Recent studies suggest the use of rhamnose as the monosaccharide in the dual sugar absorption test instead of mannitol because contamination of the test result is possible as mannitol is present in many foods, medications, and skin products (8,9). Rhamnose is not commonly used in these products, and, therefore, may be a better test probe than mannitol. Typically, urine samples are collected at specific time points for dual sugar absorption tests. However, the collection of urine is not always convenient, and a blood test offers practical advantages in terms of consistent collection. In human performance studies of the effect of exercise on intestinal permeability for a short time frame (1 h), blood sample collection every few minutes is far more practical than urine collection.
Saccharides, such as rhamnose and lactulose, have typically been seen as a challenge to analyze. Saccharides are often isomers and they are difficult to separate by liquid chromatography (LC). Reversed phase C-18 columns, which typically are a ubiquitous choice for LC, do not retain these highly polar sugar molecules. Techniques such as hydrophilic interaction chromatography (HILIC) have been developed to improve the separation of saccharides in complex carbohydrate mixtures. The method presented here used a HILIC method with an amino column to efficiently separate rhamnose and other endogenous saccharide molecules.
Liquid chromatography tandem mass spectrometry (LC–MS/MS) is typically the method of choice for small molecule analysis in biological matrices, but saccharides present challenges due to low ionization efficiency. Saccharides do not contain highly acidic sites in their structures; therefore, they cannot ionize efficiently through deprotonation to produce [M - H]- molecular ions under electrospray ionization (ESI) or atmospheric pressure chemical ionization (APCI) (10). The saccharides can be derivatized to form more easily ionizable molecules, but this adds complexity and extra steps to sample preparation. Saccharides can be ionized easily by chlorine attachment at electron deficient atoms to form [M+Cl]- ions, and this was the method chosen for this study.
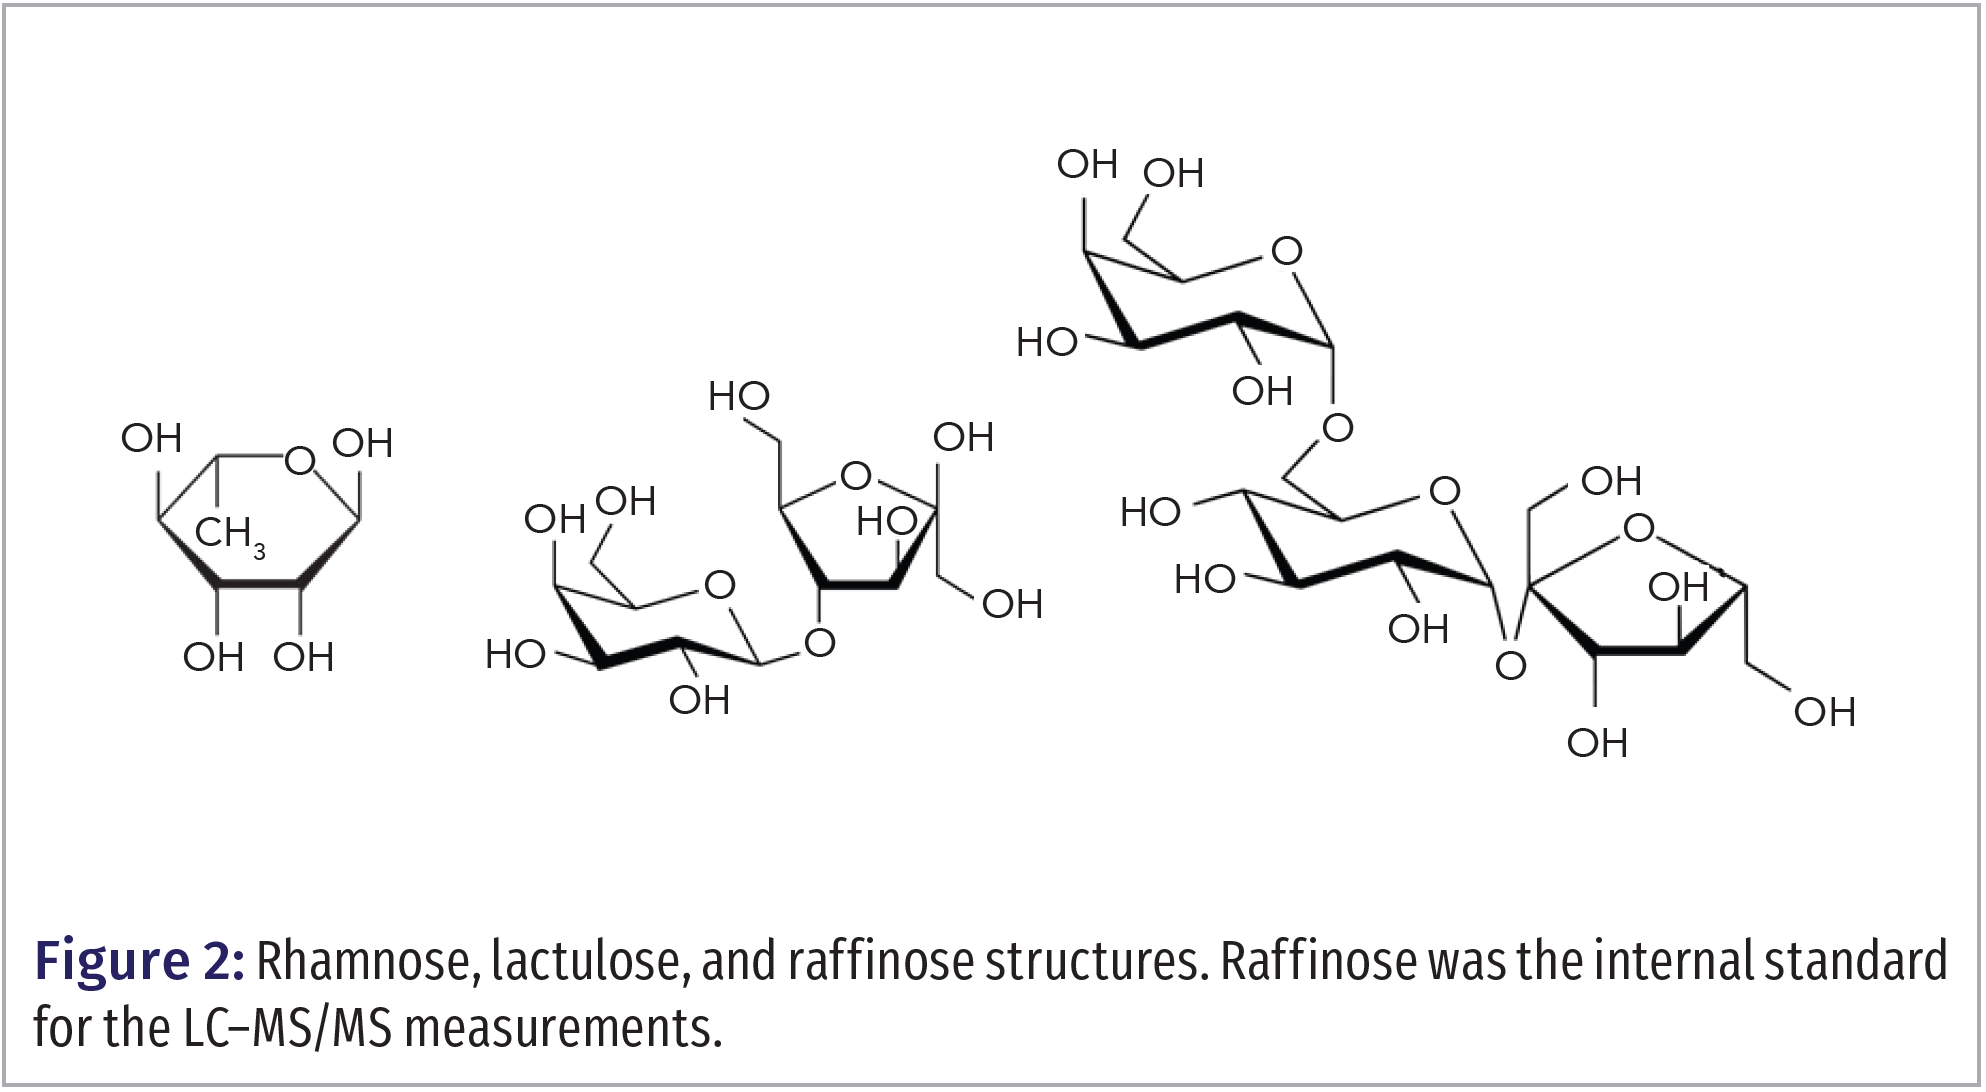
We developed a sensitive and robust method to measure rhamnose and lactulose levels in blood to investigate the presence of alterations in intestinal permeability in adults participating in an exercise science study. An improvement of this method over a previously published method was the addition of an internal standard, raffinose, to provide better reproducibility (11). Figure 2 shows the structures of the saccharides analyzed in this study.
Materials and Methods
Blood Collection, Handling and Storage
Blood samples analyzed in this study were a subset from samples collected for a previous study; the participants consumed a 50 mL sugar probe solution (5 g lactulose, 2 g rhamnose) for the intestinal permeability measurement before exercise. Blood samples were drawn from a 20 g Tef lon cannula placed in an antecubital vein, which remained patent via an isotonic saline flush. Blood samples were deposited into untreated (for serum collection), as well as EDTA- and heparin-treated (for plasma collection) blood collection tubes. Untreated tubes clotted for 30 min prior to centrifugation, while treated tubes were centrifuged immediately for 8 min at 3000 x g at 4 ºC, aliquoted, and stored at -80 ºC until analysis. Samples were thawed only once for biochemical analysis.
Plasma Sample Preparation
Protein precipitation was carried out by adding 300 μL of cold acetonitrile with internal standard (raffinose, 5000 ng/mL) to 100 μL sample plasma aliquots. Samples were then centrifuged for 5 min at 10x g, and 150 μL of supernatant was withdrawn and placed in sample vials for LC–MS/MS analysis. Five calibration standards were prepared with blank pooled-serum in order the concentration range of 500 to 50,000 ng/mL of rhamnose and lactulose.
LC–MS/MS Instrumentation and Chromatographic Conditions
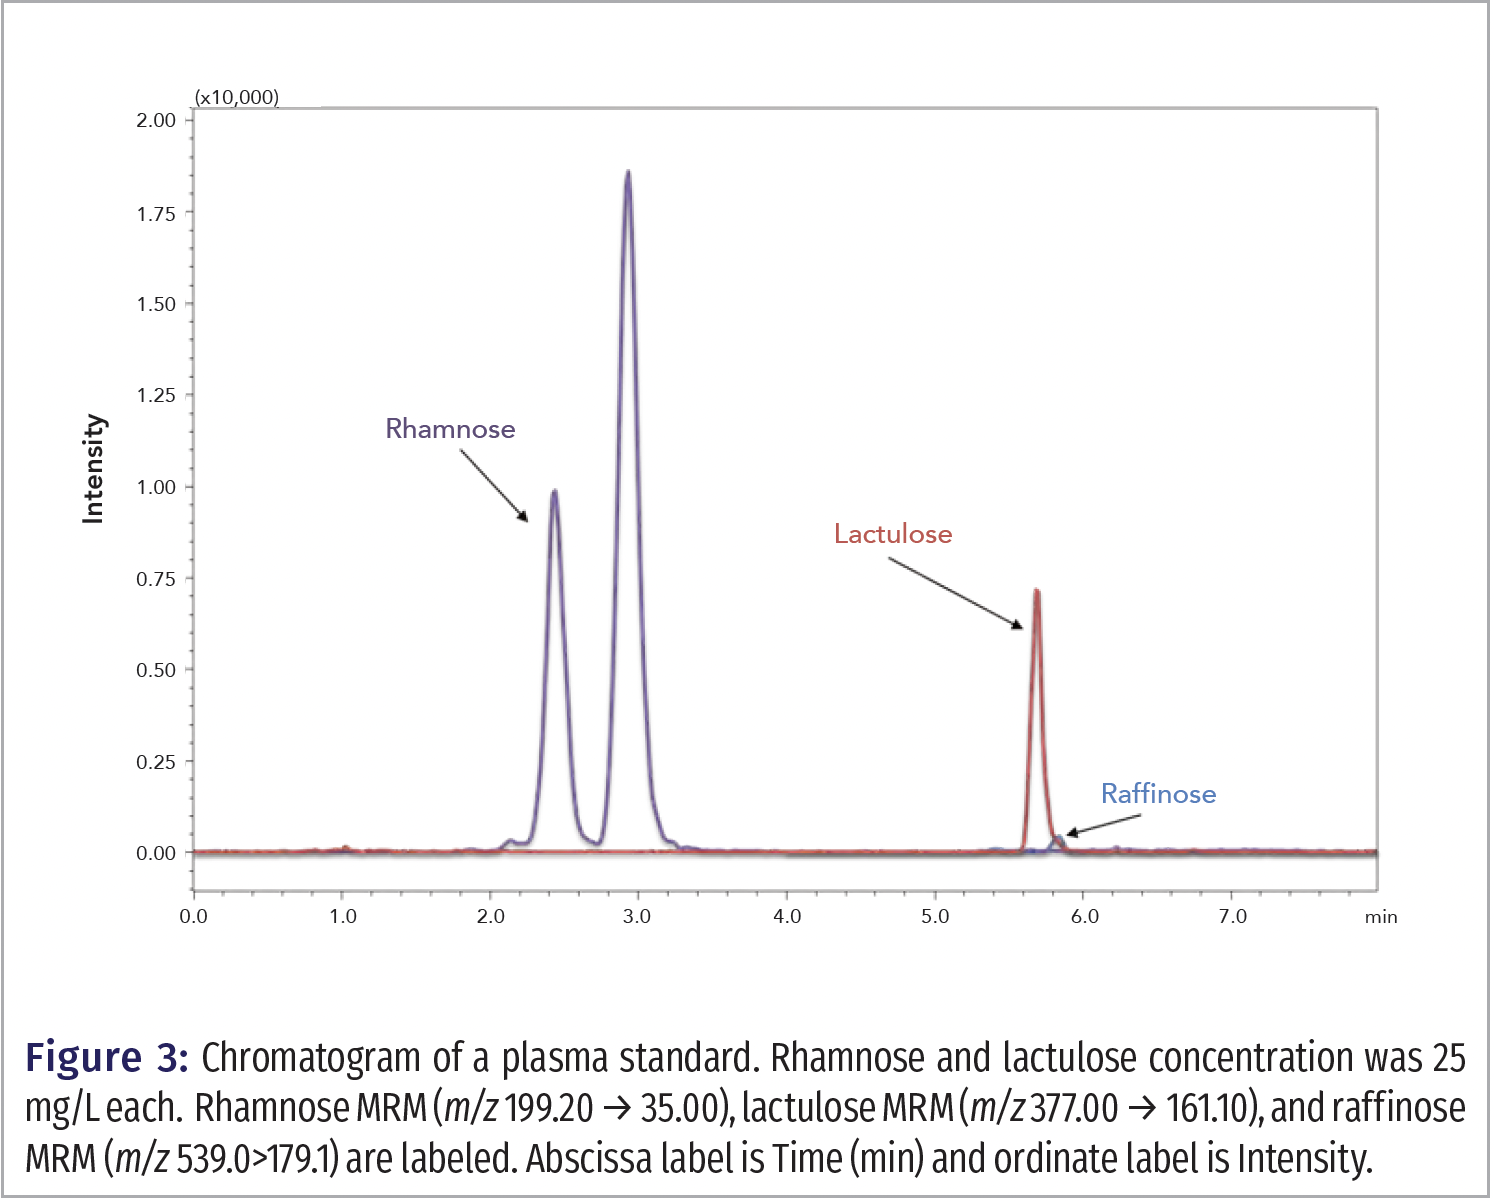
For analysis, the system included a Shimadzu Prominence XR UHPLC system, which included two Shimadzu LC-20ADXR pumps, a SIL-20ACXR autosampler, and a CTO-20A column oven. The UHPLC system was connected to a Shimadzu LCMS 8040 triple stage quadrupole mass spectrometer. Chromatographic separation was achieved on a Imtakt Unison Amino (100 x 3.0 mm, 3 µm) column maintained at a temperature of 60 °C. The flow rate was 0.50 mL/min. The mobile phase consisted of an aqueous phase A (0.1% formic acid in water) and an organic phase B (0.1% formic acid in acetonitrile). A gradient time program was used. The initial mobile phase composition was 80% B (0‒3 min), then B decreased linearly to 20% (3‒5 min.). B was then held at 10% (5‒5.5 min), then increased to 80% at 5.51 min for a 3 min equilibration in preparation for the next run. The flow rate was 0.50 mL/min. The injection volume was 10 µL. For LC–MS/MS detection, a dual ion spray source (DUIS) with simultaneous electrospray ionization and atmospheric pressure chemical ionization was utilized in the negative ion mode with the following parameters: DL temperature, 240 °C; nebulizing gas flow, 3.00 L/min; heat block, 450 °C; and drying gas flow, 20 L/min. The multiple reaction monitoring (MRM) transition for rhamnose was m/z 199.20 → 35.00 with a 100 sec dwell time; the collision energy (CE) was 10 V. The MRM transition for lactulose was m/z 377.00 → 161.10 with a 100 sec dwell time; the CE was 15 V. Raffinose MRM was m/z 539.00 → 179.1. Data were acquired and analyzed with Shimadzu LabSolutions software (Figure 3).
Results
The predominant molecular ion that we observed for rhamnose, lactulose, and raffinose was [M + Cl]- for each compound. The chromatogram peaks from extracted plasma were well separated (Figure 3) by MRM. For the rhamnose MRM, a second peak is eluted after rhamnose, and this peak represents an endogenous plasma compound with the same MRM as rhamnose, which was confirmed by the analysis of a rhamnose standard in acetonitrile. It was found that the coelution of raffinose with lactulose helped improve the reproducibility of laffinose:raffinose peak area ratios compared to chromatography methods where raffinose eluted later in the chromatogram.
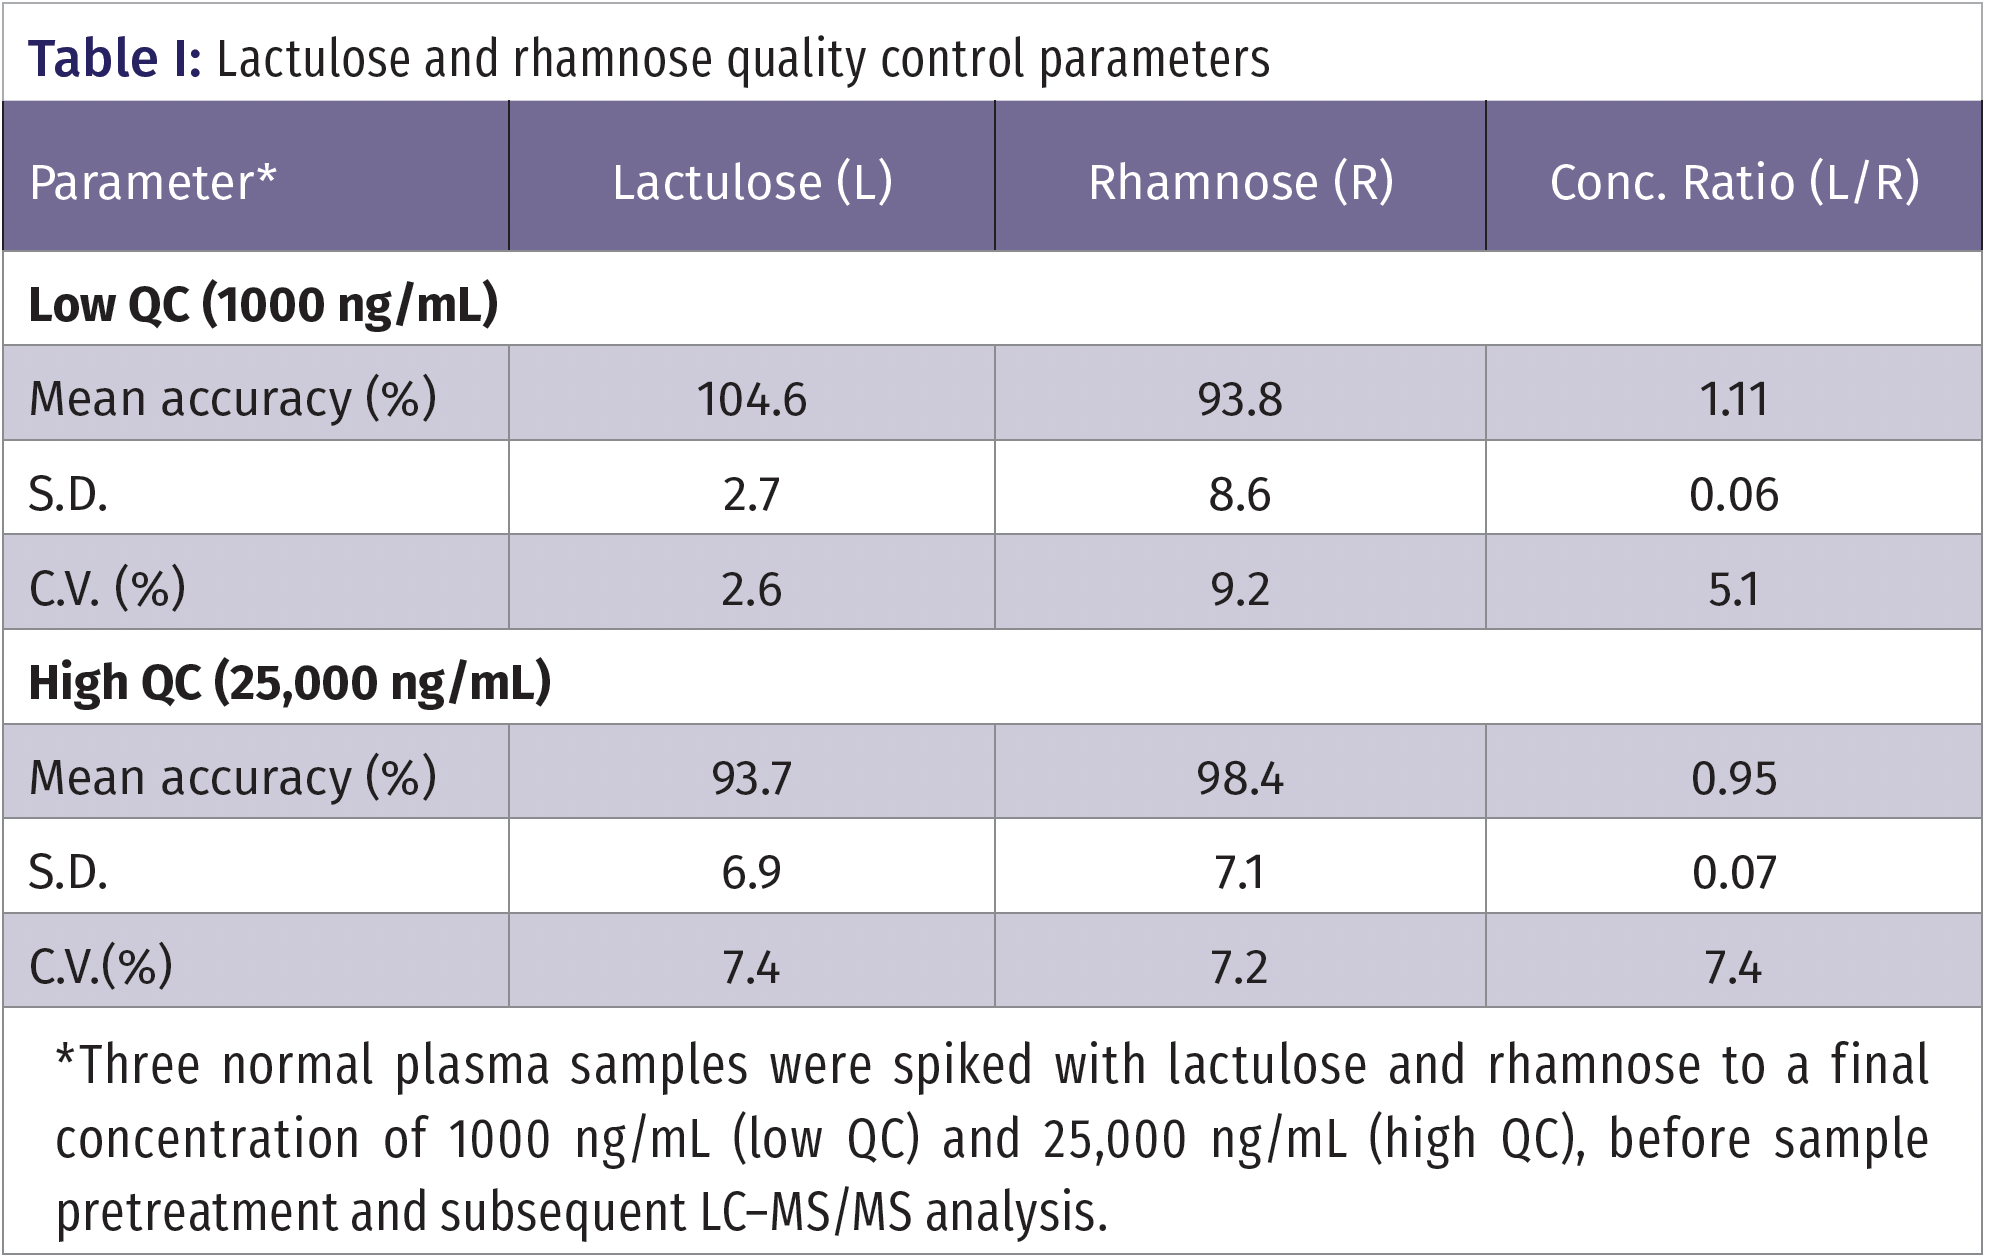
Calibration curves were constructed by analyzing calibrants with a range of 500 to 50,000 ng/mL. The calibration curves had a quadratic fit with 1/x2 weighting. The equation for the line for rhamnose was y = -3.29E-9 x2 + 4.05E-4 x +3.56E-1 and the equation for the line for lactulose was y = -1.49E-8 x2 + 3.42E-3 x + 6.433E-2. The r2 values for the calibration curve for rhamnose was 0.99939 and the calibration curve for lactulose was 0.99878. The limit of quantitation for rhamnose and lactulose was 500 ng/mL. Quality control data for a low QC (1000 ng/mL) and high QC (25,000 ng/mL) are shown in Table I. The calculated mean % recovery (accuracy) for the low and high QCs for lactulose was 104.6% and 93.7%, respectively. For rhamnose, the accuracy was 93.8% for the low QC, and 98.4% for the high QC. These values are well within the range of the Food and Drug Administration (FDA)’s guidelines for validation of bioanalytical methods (12). The CVs ranged from 2.6% to 9.2%, representing adequate precision.
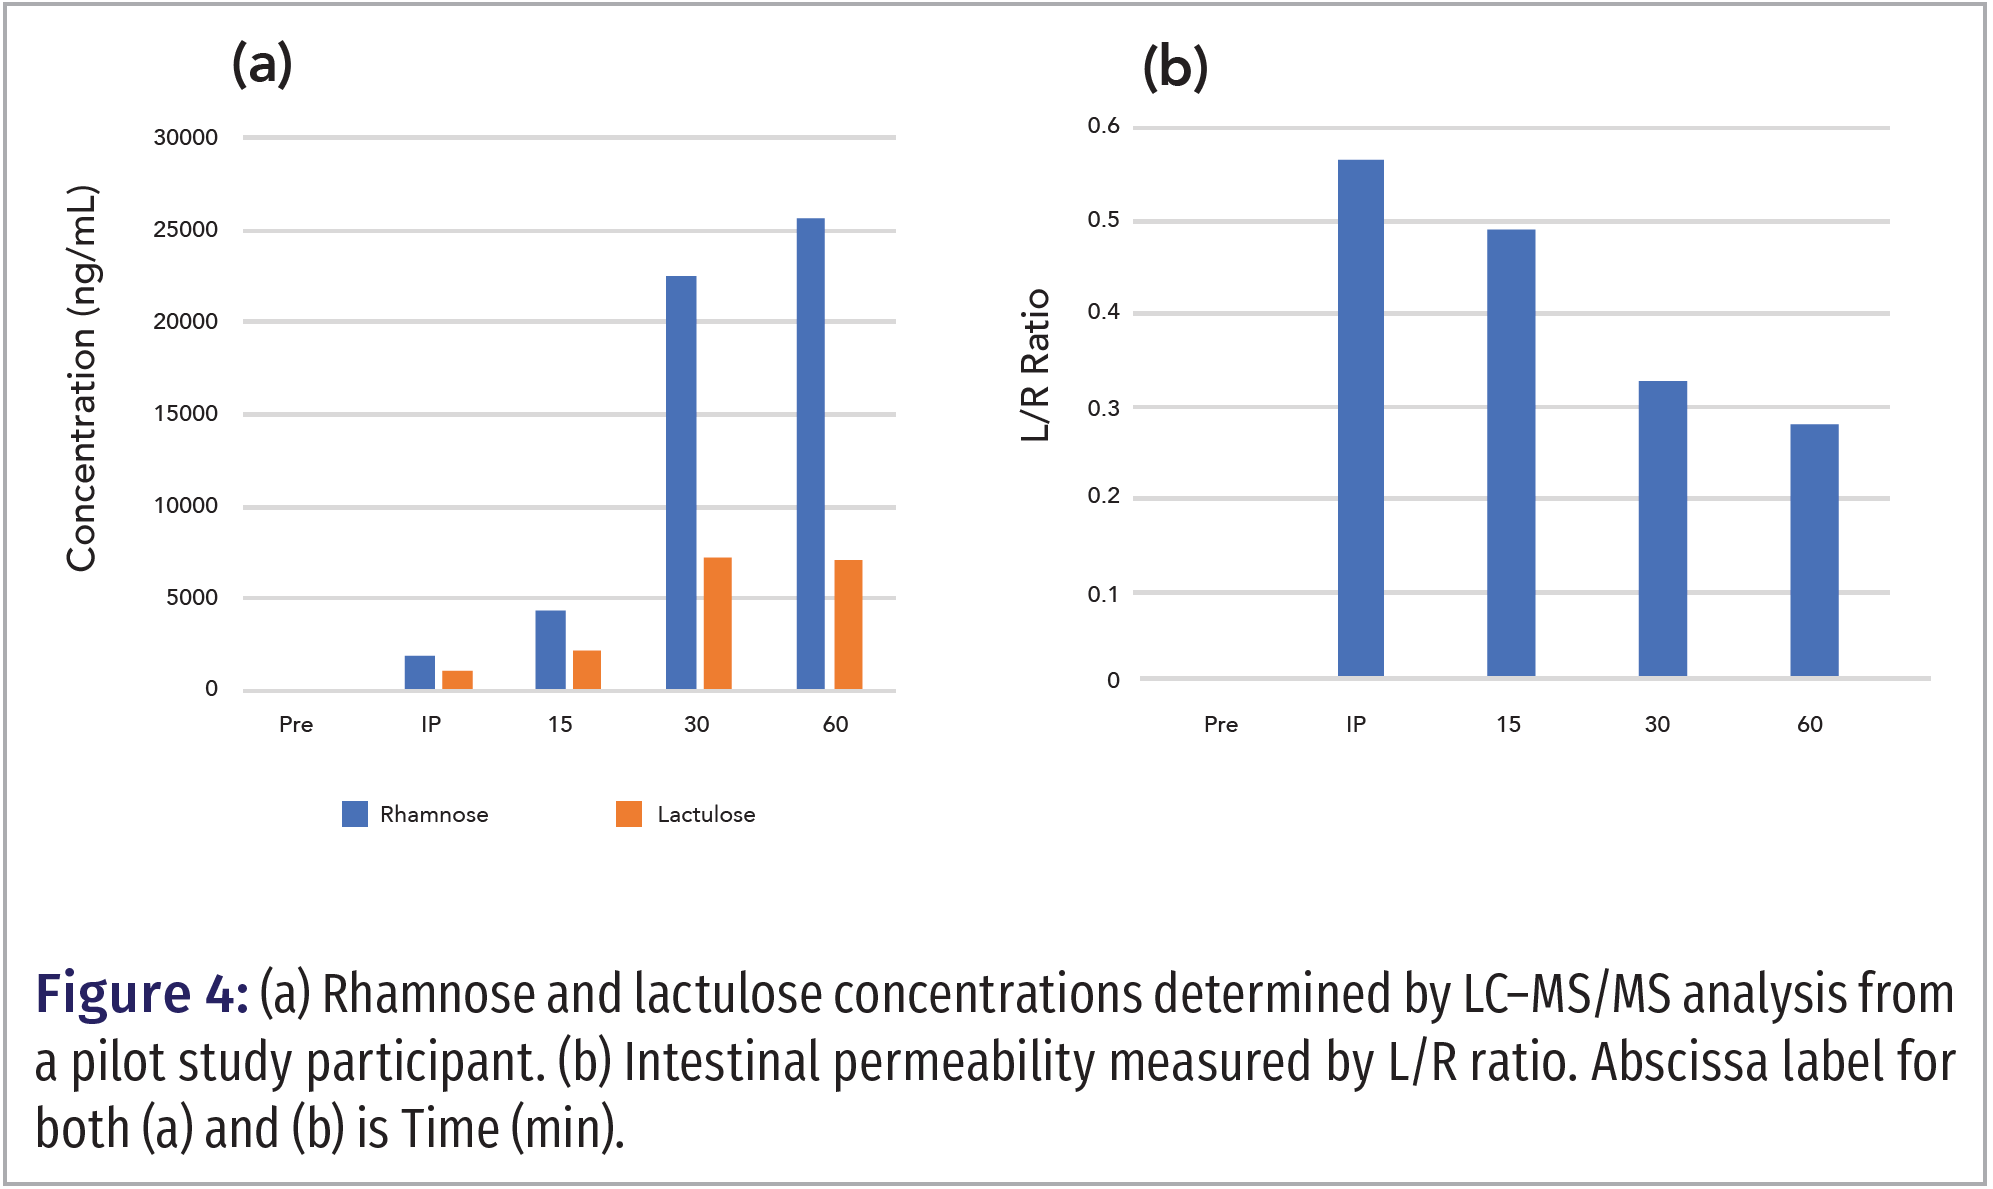
Results from a pilot study of a single individual who did a resistance exercise regimen are shown in Figure 4. Blood samples were acquired after the participant drank a lactulose-rhamnose solution before exercise (PRE), immediately post-exercise (IP), 15-, 30-, and 60-min after exercise. Figure 4b shows that the L/R ratio steadily decreased as time went on post-exercise.
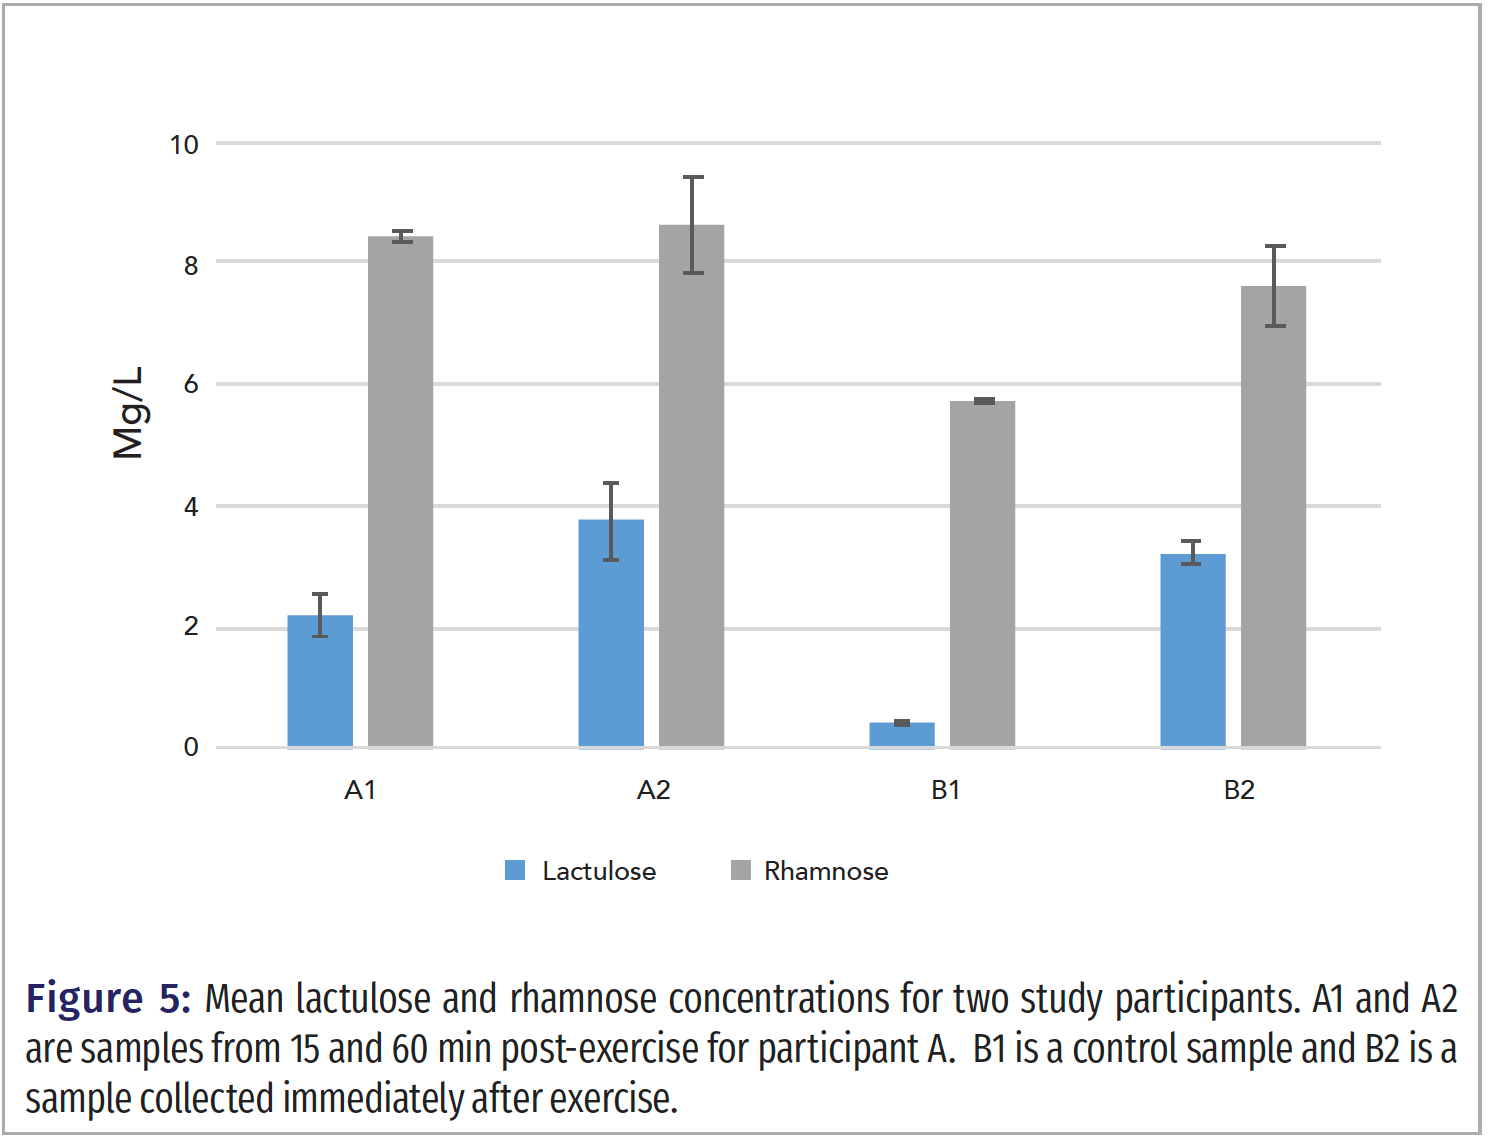
Plasma samples from study participants were analyzed with the method in this manuscript. Figure 5 shows a chart with a comparison of results. Samples A1 and A2 are from a study of participant samples collected 15 and 60 min after exercise, respectively. The results show an increase in lactulose concentration while the rhamnose concentration was virtually unchanged. Sample B1 was the control sample corresponding to sample B2 for immediately post exercise. The L/R ratio for B1 (control) is low at 0.075, and the L/R ratio for B2 is 0.43, demonstrating an increase in intestinal permeability compared to the control. These results show the range and the robustness of the LC–MS/MS method for measuring a wide range of lactulose and rhamnose concentrations.
Conclusion
We developed a rapid and robust LC–MS/MS method for determination of lactulose and rhamnose concentrations in blood plasma with raffinose as the internal standard. The method can be used to determine intestinal permeability from blood plasma, which has the advantages of urine collection in that it can be timed accurately, and the test probes are measured in a biological matrix closer to the intestinal barrier compared to urine.
Acknowledgments
L.R., M.K., and M.B. received Langford-Yates Fellowships from the College of Liberal Arts & Sciences, Lipscomb University.
References
(1) Bischoff, S. C.; Barbara, G.; Buurman, W.; Ockhuizen, T.; Schulzke, J.-D.; Serino, M. et al. Intestinal Permeability – A New Target for Disease Prevention and Therapy. BMC Gastroenterol. 2014, 14 (1), 189. DOI: 10.1186/s12876-014-0189-7
(2) Galipeau, H.; Verdu, E. The Complex Task of Measuring Intestinal Permeability in Basic and Clinical Science. Neurogastroenterol. Motil. 2016, 28 (7), 957‒965. DOI: 10.1111/nmo.12871
(3) Lister, M. A Letter of Mr. Lister Dated May 21. 1673. In York, Partly Taking Notice of the Foregoing Intimations, Partly Communicating Some Anatomical Observations and Experiments Concerning the Unalterable Character of the Whiteness of the Chyle Within the Lacteous Veins; Together with Divers Particulars Observed in the Guts, Especially Several Sorts of Worms Found in Them. Philos. Trans. R. Soc. Lond. 1673, 8 (95), 6060‒6065. DOI: 10.1098/rstl.1673.0026
(4) Musgrave, W. A Letter from Dr William Musgrave, F. R. S. to the Publisher, concerning Some Experiments Made for Transmitting a Blue Coloured Liquor In-Into the Lacteals. Philos. Trans. R. Soc. Lond. 1700, 22, 996‒998. DOI: 10.1098/rstl.1700.0106
(5) McCance, R. A.; Madders, K. The Comparative Rates of Absorption of Sugars from the Human Intestine. Biochem. J. 1930, 24 (3), 795‒804. DOI: 10.1042/bj0240795
(6) Gryboski, J. D.; Thayer, W. R.; Gabrielson, I. W.; Spiro, H. M. Disacchariduria in Gastrointestinal Disease. Gastroenterology 1963, 45 (5), 633‒637. DOI: 10.1016/s0016- 5085(19)34826-7
(7) Menzies, I.; Pounder, R.; Heyer, S.; Laker, M.; Bull, J.; Wheeler, P. et al. Abnormal Intestinal Permeability to Sugars in Villous Atrophy. Lancet 1979, 314 (8152), 1107‒1109. DOI: 10.1016/S0140-6736(79)92507-8
(8) Grover, M.; Camilleri, M.; Hines, J.; Burton, D.; Ryks, M.; Wadhwa, A. et al. 13C Mannitol as a Novel Biomarker for Measurement of Intestinal Permeability. Neurogastroenterol. Motil. 2016, 28 (7), 1114‒1119. DOI: 10.1111/nmo.12802
(9) Faubion, W. A.; Camilleri, M.; Murray, J. A.; Kelly, P.; Amadi, B.; Kosek, M. N. et al. Improving the Detection of Environmental Enteric Dysfunction: A Lactulose, Rhamnose Assay of Intestinal Permeability in Children Aged Under 5 Years Exposed to Poor Sanitation and Hygiene. BMJ Glob. Health 2016, 1 (1), e000066. DOI: 10.1136/bmjgh-2016-000066
(10) Wan, E. C. H.; Yu, J. Z. Analysis of Sugars and Sugar Polyols in Atmospheric Aerosols by Chloride Attachment in Liquid Chromatography/Negative Ion Electrospray Mass Spectrometry. Environ. Sci. Technol. 2007, 41 (7), 2459‒2466. DOI: 10.1021/es062390g
(11) Hart, T. L.; Townsend, J. R.; Grady, N. J.; Johnson, K. D.; Littlefield, L. A.; Vergne, M. J.; et al. Resistance Exercise Increases Gastrointestinal Symptoms, Markers of Gut Permeability, and Damage in Resistance-Trained Adults. Med. Sci. Sports Exerc. 2022, 54 (10), 1761‒1770. DOI: 10.1249/MSS.0000000000002967
(12) U.S. Food and Drug Administration, Bioanalytical Method Validation Guidance for Industry. 2018. https://www.fda.gov/regulatory-information/search-fda-guidance-documents/bioanalytical-method-validation-guidance-industry (accessed 2023-03-10)
Lindsey Reynolds, Matthew Khalil, Markous Boushra, and Matthew J. Vergne are with the Department of Pharmacy & Pharmaceutical Sciences and Department of Chemistry & Biochemistry at Lipscomb University, in Nashville, Tennessee. Jeremy Townsend is with Athletic Greens International, in Carson City, Nevada, and the Department of Kinesiology at Lipscomb University, in Nashville, Tennessee. Direct correspondence to: matt.vergne@lipscomb.edu
Polysorbate Quantification and Degradation Analysis via LC and Charged Aerosol Detection
April 9th 2025Scientists from ThermoFisher Scientific published a review article in the Journal of Chromatography A that provided an overview of HPLC analysis using charged aerosol detection can help with polysorbate quantification.
Removing Double-Stranded RNA Impurities Using Chromatography
April 8th 2025Researchers from Agency for Science, Technology and Research in Singapore recently published a review article exploring how chromatography can be used to remove double-stranded RNA impurities during mRNA therapeutics production.


