Ultratrace Quantitative Analysis of Catalyst Poisoners Using a Dedicated GC-MS Analyzer
LCGC North America
Can databases of column characteristics be used to help with HPLC column selection ahead of method development?
A dedicated gas chromatography–mass spectrometry (GC–MS) analyzer was developed to address the increasing need for more sensitive catalyst poisoner analysis. The system combines the separation power and robustness of a classic backflush configuration with the selectivity and sensitivity of MS.
The use of high-yield metallocene catalysts has dramatically increased both efficiency and selectivity of polymerization processes (1). Unfortunately, these catalysts are extremely prone to poisoning by feedstock impurities, such as arsine (AsH3), phosphine (PH3), oxygenates (for example, dimethyl ether), and sulfur-containing compounds (mercaptans, sulfides, and so forth) (2,3). Minute amounts of these compounds are sufficient to impose undesirable effects and induce immediate loss of catalytic activity and reaction yield. At the same time, trace contaminants at parts-per-billion concentration levels can end up in the polymers and alter subsequent polymer properties and characteristics.
For decades, process chemical and petrochemical analysts addressed their analytical challenges mainly by relying on superior chromatography and smart tools such as valve switching, backflush, and Deans heart-cut. In combination with relatively cheap, robust, and selective detectors, they were capable of providing all information necessary to control and tweak petrochemical processes.
Organic catalyst poisoners are usually determined using dedicated chromatographic analyzers. These systems are, typically, equipped with a dual capillary column configuration with backflush and fitted with flame ionization detection (FID). Under these conditions, limits of detection are usually approximately 100 ppb, depending on the compound investigated and the complexity of the matrix that is introduced (4). Unfortunately, this is far from sufficient to protect the latest catalysts, which start to deteriorate as soon as fed with low parts-per-billion amounts (5,6). An overview of some typical specifications for catalyst poisoners in polymer-grade hydrocarbons is given in Table I.
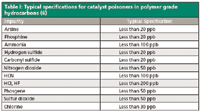
Table I: Typical specifications for catalyst poisoners in polymer grade hydrocarbons (6)
Mass spectrometry (MS) is hardly used in petrochemical QC laboratories, which is primarily because of its apparent complexity and higher cost-of-ownership. Nonetheless, MS detection has several distinct advantages over classic analog detectors. In full-scan acquisition mode, for example, it allows tracking and identification of unknown components using spectral deconvolution and subsequent library matching. In selective ion monitoring (SIM) mode, on the contrary, MS permits trace and ultratrace quantification of target analytes which is often superior to classic selective detectors. Furthermore, MS permits the use of mass-labeled internal standards that behave identically to their native analogs, which has a positive effect on overall method precision and accuracy. It is no surprise that instrument manufacturers have invested substantially in solutions aimed at reducing overall MS system complexity and total cost of ownership in the past couple of years. Easy tune and calibration functionalities, increased sensitivity and speed, new acquisition modes, and elegant solutions that eliminate downtime, such as vacuum lock technology, have contributed largely in this respect.
This article gives an overview of the main characteristics and performance of a new gas chromatography–mass spectrometry (GC–MS) analyzer that has been recently developed. The system combines the chromatographic separation power and backflush–Deans heart-cut capabilities of a classic oxygenate analyzer with the orthogonal separation power, sensitivity, selectivity, and overall robustness of the latest generation single-quadrupole mass spectrometers.
Experimental
Standards: Standard oxygenate reference mixture from Spectrum at 10 ppm in hexane. For more details with respect to the composition of the test mixture, please consult Table III. Calibration standards were prepared by gradual dilution in hexane at 0.01 ppm, 0.05 ppm, 1 ppm, and 5 ppm.
Gas chromatography: The GC analyzer consisted of a Thermo Trace GC system refurbished by Global Analyser Solutions (GAS). The system was fitted with a gas sampling valve (GSV), a liquid sampling valve (LSV), a vaporizer, a standard split–splitless injector, and an FID system. Inside the GC oven, a universal pressure balanced Deans assembly was installed to carry out heartcut and backflush. Auxiliary pressure for balancing was provided and controlled by a separate Trace GC DCC unit.
The first-dimension column was a 15 m × 530 µm, 5-µm df Restek Rtx-1 column. The second-dimension column was a 10 m × 530 µm, 10-µm df Agilent CP-Lowox column. Restrictions were 250-µm i.d. uncoated Siltekdeactivated fused-silica capillary tubing (Restek) cut to the appropriate length. All connections were made using micro Siltite unions (SGE Analytical Science). Other relevant parameters are summarized in Table II.
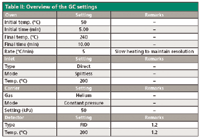
Table II: Overview of the GC settings
Mass spectrometry: The GC analyzer was hyphenated to a Thermo ISQ single-quadrupole mass spectrometer. The system was applied in both full scan (range: 15–250 amu) and SIM (dwell time: 0.2 s) as full scan–SIM mode. All relevant MS settings are summarized in Table III.
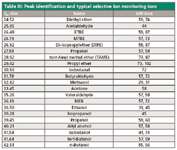
Table III: Peak identification and typical selective ion monitoring ions
All data were acquired using Thermo QuanLab Forms software. The MS system was used after running a full electron ionization (EI) tune. System performance was verified using a daily tune check.
Results and Discussion
System setup: The capillary column set comprises the true core of any classic catalyst poisoner analyzer. The second-dimension column is particularly important. Ultimately, it is here that separation of the analytes, from each other as well as from the aliphatic matrix in which they reside, occurs. A CP-Lowox column (Agilent) was used for this purpose. This column, which is based on a multilayer porous layer open tubular (PLOT) concept, is very polar and characterized by a high maximum allowable operating temperature with virtually no bleed at temperatures as high as 350 °C (7). In combination with a backflushed apolar-coated capillary column in the first dimension, matrix separations up to C12 hydrocarbons are well within range.
Unfortunately, the CP-Lowox column is not available in MS-friendly narrow-bore dimensions. To avoid the MS vacuum from protruding the system, it is necessary to incorporate an adequate restriction at the back of the column. A schematic representation of system setup for Lowox/MS applications is depicted in Figure 1.
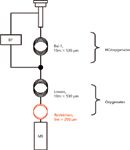
Figure 1: Schematic representation of the GCâMS analyzer. BF = backflush; HCs = hydrocarbons.
True backflush, as well as Deans heart-cut, is achieved by increasing the auxiliary pressure at the column joint just above the first-dimension residual head pressure at a certain moment in time. Debalancing induces full flow reversal, while maintaining a small flow over the Lowox column for chromatography. It is crucial to know the exact pressure at the column joint for this approach to be successful. When the pressure is set too low, standard flow direction will be maintained and the first column is not backflushed. Conversely, when it is set too high, none of the target analytes will be able to reach the second-dimension column and the detector. The easiest way to determine the pressure at the column joint involves setting the head pressure at regular and then reading the residual pressure at the auxiliary digital carrier gas control, which is kept off at this stage. Pressure differences of 5 kPa are sufficient to induce flow reversal. Although less straightforward because of the vacuum conditions, a similar approach is applied in combination with MS. It also permits users to determine the minimal length of the restriction capillary (Figure 1).
System suitability: System suitability was evaluated by direct injection of the 10 ppm oxygenate standard. To compare with a classic analyzer set-up, experiments were performed using both FID and MS for detection. The MS system was applied in both full-scan and SIM modes. A typical chromatogram with the MS in full-scan mode is depicted in Figure 2. Peak identification is referred to in Table III.
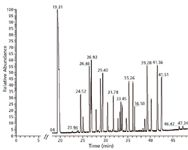
Figure 2: Chromatogram of the oxygenates standard at 10 ppm. The MS system was applied in full-scan mode. Peak identification is referred to in Table III.
A comparative overview of the results is given in Table IV. For each peak, the signal-to-noise ratio (S/N) was calculated (root mean square [RMS]) in full scan, extracted ion, and SIM mode. These results were subsequently expressed relative to the S/N with FID.
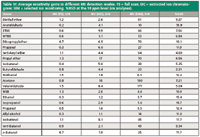
Table IV: Average sensitivity gains in different MS detection modes. FS = full scan; EIC = extracted ion chromatogram; SIM = selected ion monitoring. %RSD at the 10 ppm level (six analyses).
The results in Table IV clearly illustrate the significant gains in sensitivity that can be reached when using MS compared to FID. Minimal gain is 3.7 for ethanol. Unsurprisingly, sensitivity gains are particularly significant when the MS was used in SIM mode. Straight full-scan mode proved to be less appropriate for target analysis, which is predominately due to the low molecular weight of the target compounds, and means having to include highly interfering masses such as m/z =18 (water), 28 (nitrogen) and 32 (oxygen) in the scan range. More convenient in this respect is the combined full-scan–SIM mode, which is available on all major instrument brands nowadays.
Afterward, calibration curves were constructed for each of the oxygenates in the standard mixture from 0.05 ppm to 5 ppm. Correlation coefficients were =0.995. Some typical SIM traces at the 0.10 ppm level are depicted in Figure 3.
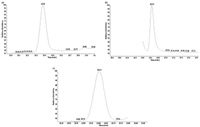
Figure 3: SIM traces at 0.01 ppm: (a) acetaldehyde, (b) ethanol, and (c) propyl ether.
Method repeatability was determined as well. Results at the 10 ppm level are included in Table IV (six consecutive analyses).
Applications
Naptha feed: Naphtha is a complex mixture of hydrocarbons (C5–C12) in petroleum boiling between 30 °C and 200 °C. Oxygenates are routinely determined in these samples according to reference procedures such as ASTM D7423 (4) as their cracking product causes problems in the downstream separation processes (8). Naphthas are very complex and fully require the chromatographic separation power of the Lowox column. A typical chromatogram of a naphtha sample in SIM mode is depicted in Figure 4. Individual samples were introduced using the LSV of the GC–MS analyzer. The insert shows the methanol trace (ion 29, 0.18 ppm); concentrations of acetaldehyde and TAME were 8.3 and 4.9 ppm, respectively.
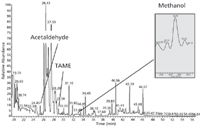
Figure 4: Typical SIM trace of a naphtha feed.
When idle, the GC oven was kept at 200 °C with the backflush activated. This was necessary to prevent the accumulation of siloxane bleed from the precolumn.
Conclusions
A GC–MS analyzer is described that substantially expands the workable application range of a classic catalyst contaminants analyzer. The use of MS in full-scan–SIM mode permits identification of unknown contaminants in combination with reliable quantification at trace and ultratrace amounts.
Acknowledgment
The authors acknowledge the financial support from the Long Term Structural Methusalem Funding by the Flemish Government – grant number BOF09/01M00409. KVG holds a Postdoctoral Fellowship of the Fund for Scientific Research Flanders and a BOF tenure track position at Ghent University.
Kevin M. Van Geem is a Fulbright alumnus of the Massachusetts Institute of Technology in Cambridge, Massachusetts, and assistant professor in thermochemical reaction engineering in the department of chemical engineering and technical chemistry at Ghent University in Ghent, Belgium.
Jeroen Ongenae is a masters student in civil engineering in the department of chemical engineering and technical chemistry at Ghent University. He is currently finishing his thesis on trace oxygenate analysis using MS techniques.
Jean-Louis Brix is an analytical support engineer at IS-X. He specializes in instrument design and method development for petrochemical applications.
Joeri Vercammen is managing expert of IS-X. He specializes in method development and rationalization from prep-to-rep, method validation, and quality assurance.
Guy B. Marin is chair of the department of chemical engineering and technical chemistry at Ghent University, Belgium. Chemical reaction engineering, catalysis in general, and reaction kinetics are the main topics in his research program.
References
(1) L. Resconi, L. Cavallo, A. Fait, and F. Piemontesi, Chem. Rev. 100, 1253–1345 (2000).
(2) Almatis AC Inc., Application for Selective Adsorbents in Polymer Production Processes, Technical Bulletin USA/6040-R00/0504.
(3) M.A. Graham, "Selected Ethylene Feedstock Impurities: Survey Data," presented at the Ethylene Producers Conference, Houston, Texas, 1993.
(4) J.G. Speight, Handbook of Petroleum Product Analysis (John Wiley & Sons, 2002).
(5) B. Biela, R. Moore, R. Benesch, B. Talbert, and T. Jacksier, Gulf Coast Conference, Galveston, Texas (2003).
(6) S.S. Thind, Petro Industry News, 1–2, June/July (2003).
(7) J. de Zeeuw and J. Luong, Trends Anal. Chem. 21, 594–607 (2002).
(8) S.P. Pyl, C.M. Schietekat, M.-F. Reyniers, R. Abhari, G.B. Marin, and K.M. Van Geem, Chem. Eng. J. 176–177, 178–187 (2011).

University of Rouen-Normandy Scientists Explore Eco-Friendly Sampling Approach for GC-HRMS
April 17th 2025Root exudates—substances secreted by living plant roots—are challenging to sample, as they are typically extracted using artificial devices and can vary widely in both quantity and composition across plant species.
Sorbonne Researchers Develop Miniaturized GC Detector for VOC Analysis
April 16th 2025A team of scientists from the Paris university developed and optimized MAVERIC, a miniaturized and autonomous gas chromatography (GC) system coupled to a nano-gravimetric detector (NGD) based on a NEMS (nano-electromechanical-system) resonator.
Miniaturized GC–MS Method for BVOC Analysis of Spanish Trees
April 16th 2025University of Valladolid scientists used a miniaturized method for analyzing biogenic volatile organic compounds (BVOCs) emitted by tree species, using headspace solid-phase microextraction coupled with gas chromatography and quadrupole time-of-flight mass spectrometry (HS-SPME-GC–QTOF-MS) has been developed.


