Column Characterization Databases
LCGC North America
Can databases of column characteristics be used to help with HPLC column selection ahead of method development?
There are many factors influencing the efficiency of a high performance liquid chromatography (HPLC) stationary phase. Of these factors, chemical nature of the bonded phase ligand is important, but by no means all encompassing in determining the important phase characteristics.
In 2005, there were about 220 C18 (L1) phases available (1). One can only speculate on the number available today, and each will be subtly different in separating the analytes that we are interested in.
As users and developers of HPLC methods, we need to improve our understanding of the factors affecting separations so that we can better understand problems when they occur and learn to exploit key stationary-phase characteristics to our advantage during method development or improvement.
This might be achieved by testing each (and every!) stationary phase using a standard set of chemical probes that we know will react in a predictable way, depending upon the phase characteristics. In this way, we can produce comparative data that will allow us to select phases that we suspect might be best at exploiting important chemical and physicochemical differences between our analytes. We can then map column characteristics and group columns (even those of the same "nominal" bonded phase) into those that are "similar" or "different" (sometimes called "orthogonal" in this context), allowing us to manipulate our analyte retention and separation selectivity accordingly.
Several attempts have been made to produce a definitive set of chemical probes and tests to best characterize the huge number of stationary phases available (currently estimated to be well over 1000 distinct chemistries). As yet, a harmonized set of test probes and methodologies has not come to the forefront; however, there are some notable groups of scientists working in this field.
An early attempt at producing a generic set of probes for testing HPLC column characteristics was made by Tanaka and coworkers (2). Since then, work by the USP Working Group on HPLC Columns, the Impurities Working Group of the PQRI Drug Substance Technical Committee in collaboration with Lloyd Snyder (3), and Euerby and Petersson (4) has expanded the original probes designed by Tanaka. These groups have all attempted to identify a definitive set of probes that will allow the various important physicochemical phase characteristics to be specified. Most of these researchers also have combined their data with various chemometric and statistical approaches to produce quantitative databases based on principal component analysis (PCA) or other statistical methods to visualize the relative groupings of commercially available columns according to their key descriptors as well as computing a single numerical "similarity" factor, for simple comparison of orthogonality.
Even though the chemical probes used differ between the research groups, there are some common themes in the attributes of a stationary phase that are considered of primary importance in characterizing the stationary phase behavior:
- retention based on a hydrophobic probe
- ability to discriminate between probes of similar hydrophobicity (hydrophobic selectivity)
- ability to discriminate between analytes of different shape or hydrodynamic volume (shape or steric selectivity)
- extent of hydrogen bonding with acids or bases (typically via the silanol surface, polar end capping reagents, or functional groups within the bonded ligand)
- extent of ion-exchange interactions at low and mid pH (pH 2.8 and 7.0 is typical to differentiate between situations in which surface silanol species will be potentially ionized or ion suppressed).
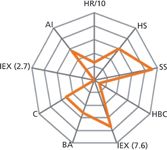
Figure 1 shows how one might simply represent column characteristics for comparison.

Figure 1: Spider diagram representing the various characteristics of a stationary phase (Accucore PF, Thermo Fisher Scientific). HR = hydrophobic retention; HS = hydrophobic selectivity; SS = steric selectivity; HBC = hydrogen bonding capacity; BA = base activity; C = chelation; IEX = ion-exchange capacity at pH 2.6 and 7.6; AI = acid interaction. (Reproduced with permission from Thermo Fisher Scientific.)
The various databases developed by these three groups can be used to identify similar or different phases and, with some increased understanding of the various characteristics described, make some rudimentary predictions about which column (type) might be best suited for a particular analysis.
The three main databases are all publicly available and can be found at the following locations:
- USP and PQRI databases: www.usp.org/USPNF/columnsDB.html
- ACD Labs Column Selector — based on the work of Euerby and Petersson: www.acdlabs.com/products/adh/chrom/chromproc/index.php#colsel
References
(1) Pharmacop. Forum 31(2), (Mar.–Apr. 2005).
(2) K. Kimata, K. Iwaguchi, S. Onishi, K. Jinno, R. Eksteen, K. Hosoya, M. Arki, and N. Tanaka, J. Chromatogr. Sci. 27, 721 (1989).
(3) N.S. Wilson, M.D. Nelson, J.W. Dolan, L.R. Snyder, R.G. Wolcott, and P.W. Carr, J. Chromatogr. A 961, 171–193 (2002).
(4) M.R. Euerby and P. Petersson, J. Chromatogr. A 994, 13–36 (2003).

Understanding FDA Recommendations for N-Nitrosamine Impurity Levels
April 17th 2025We spoke with Josh Hoerner, general manager of Purisys, which specializes in a small volume custom synthesis and specialized controlled substance manufacturing, to gain his perspective on FDA’s recommendations for acceptable intake limits for N-nitrosamine impurities.


