“Truly Natural”: Fully Automated Stir-Bar Sorptive Extraction with Enantioselective GC–MS Quantitation of Chiral Markers of Peach Aroma
Special Issues
A simple, automated, and fast method to quantify complex odorants in foods is described using stir-bar sorptive extraction (SBSE) combined with fast enantioselective GC–MS analysis. The total analytical method takes only 30 minutes and does not require any sample pretreatment.
The volatile fraction of a food plays a fundamental role in its characterization and appreciation by consumers, and thus can be used to authenticate and assess the quality of food products. Key odorants in foods are very often chiral molecules with an enantiomeric excess. Reliable quality control therefore entails fast, fully automated methods that can quantify key odorants, and determine their enantiomeric compositions. This study reports the development of a simple, fast, simultaneous, and fully automated total analysis system to quantify and measure the enantiomeric excess of γ- and δ- lactones, in natural and artificial peach flavored juices. Stir-bar sorptive extraction (SBSE) is combined with fast enantioselective GC–MS analysis and online statistical processing to quantify target quality components, including at trace levels, and effectively discriminate between samples.
The volatile fraction of a food plays a fundamental role not only in its characterization, acceptance, and appreciation by consumers, by originating its aroma, but also in its authentication and quality assessment. Volatiles directly affect the sensorial quality of fruit products, and are responsible for specific sensory characters (1,2). The concentration of volatiles is generally low; it can be affected by a number of agronomic and technological factors, and also reflects the contribution of those factors to a food's aroma. The aroma of a food product is often a complex mixture of chemicals belonging to different chemical classes, but only those (few) of them present in a concentration above their odor threshold are responsible for the sensory perception (3). The contribution of each analyte to smell can be expressed numerically in various ways, including through an odor activity value (OAV) or odor unit (3); this value is the concentration of the analyte in the food divided by its odor threshold.
Enantiomer recognition in the food field is very important, not least because biological interactions and biosynthetic processes are mostly stereospecific; this means that chiral components in natural products often show a specific enantiomeric composition (4). Conversely, many commercially relevant fruit aromas are expensive and, therefore, quite often replaced by cheaper synthetic products containing racemic compounds, or natural ingredients from different cheaper sources or origins that may contain chiral components with a different enantiomeric composition (5,6).
The flavoring of food and the discrimination between ''natural'' and ''artificial'' flavored food is also regulated by the current European legislation, in Regulations (EU) 1334/2008 and 1169/2011. These regulations state that flavorings must be labeled in the list of ingredients of a food product, and limit the use of the term natural to flavored preparations containing exclusively ''natural flavoring substances,'' meaning those obtainable enzymatically, microbiologically, or by an appropriate physical process, the latter being, ''. . . a process which does not intentionally modify the chemical nature of the components of the flavoring . . . ''. Chiral recognition thus becomes a decisive tool for a quality control laboratory, to monitor conformity of a food to legal requirements, and at the same time to check authenticity and reveal any adulteration or fraud. In addition, without specifying the use of flavoring in the list of ingredients or technological treatment, the concentrations of the key odorants should be compatible with those of the original ingredients in nature.
An optimal method for quality control of fruit products should, therefore, be able to quantify their key odorants, and simultaneously determine the enantiomeric composition of their chiral components.
For a routine quality control laboratory working in the food field, processing a large number of relatively similar samples daily, the primary requirement is to develop automated systems to satisfy the ever-increasing number of analyses required. At the same time, automated systems are also important in food research; for instance, to characterize a biological property (OAV) requiring a statistically significant number of reliable data to be described. It is ,therefore, important to develop inclusive platforms, the so-called Total Analysis System (TAS), in which the sample preparation, analysis, and data processing steps are merged online into a single workflow (7). In a TAS, the sample preparation step should be considered the "zeroth" dimension of the analytical platform, because it discriminates the analytes as a function of their characteristics (such as polarity and volatility) (8); it should, therefore, be chosen to recover the fraction of interest selectively.
Stir-bar sorptive extraction (SBSE) is a solventless sampling technique introduced by Baltussen and colleagues in 1999 (9); its main features were recently reviewed by David and associates (10). This technique is based on the recovery of the investigated fraction or analytes in a liquid sample by sorption, with thick-film polydimethylsiloxane (PDMS) coated stir bars. As well as PDMS, several other materials have been proposed, mainly to improve the recovery of more polar compounds; to the best of the authors' knowledge, only a PDMS-ethylene glycol (EG-silicone) copolymer is commercially available at present (11). SBSE is characterized by high extraction efficiencies and sensitivities, and good repeatability and reproducibility, especially when combined online with thermal desorption (TD)-GC–MS and multiple use. Furthermore, the high volume of the stir-bar coating provides an extraction yield at least tenfold that of the recently introduced solid-phase microextraction (SPME) Arrow devices (12), and hundredfold that of conventional SPME fibers at equilibrium, in particular for solutes with low log octanol-water partition coefficient (Kow). PDMS stir bars are currently widely applied in different fields (such as environment, food, biofluids, and drugs) for trace analysis of solutes with log P above 3 (13). The high concentration capacity of SBSE also permits working under nonequilibrium conditions, making this a fast sampling approach.
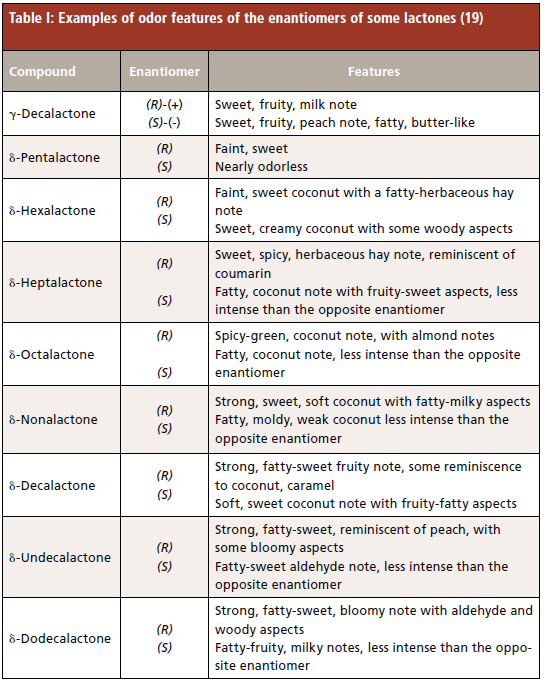
This study aims to develop a fast, fully-automated method for the simultaneous quantification and enantiomeric recognition of chiral key odorants in fruit products. The main focus is on the suitability of SBSE as a sampling technique to detect and quantify chiral compounds, even at trace levels. The simultaneous quantification and enantiomeric recognition of chiral analytes by headspace solid-phase microextraction (HS-SPME), combined with enantioselective gas chromatography–mass spectrometry (GC–MS), has already been applied to characterizing chiral terpenoids in tea leaves (14) and for authenticity control in wine (15); however, both methods were multistep and time-consuming. Peach (Prunus persica [L.] Batsch) was taken as model fruit, because it is an economically important crop, the production of which is continually rising. The peach volatile fraction has been investigated intensively, and more than 100 compounds have been identified (16). Among them, γ- and δ-lactones, in particular γ-decalactone (odor threshold is 7 ppb), have been named as character impact compounds in peach aroma (17,18), in association with C6 compounds, alcohols, esters, terpenoids, and phenolic compounds. A particular feature of lactones, very often neglected during aroma investigations, is their chirality (Table I) (19). Determination of the natural enantiomeric abundance of the two enantiomers of γ- and δ-lactones in peaches has revealed a strong enantiomeric excess of the (R)-enantiomers of both lactones (20), whereas racemic lactones are in general used for artificial flavoring of peach products.
In a previous study (4), the present group developed a rapid total analysis system to detect the authenticity of fruit-flavored foods and beverages, combining headspace (HS)-SPME with enantioselective GC–MS and statistical multivariate methods, with the goal of speeding up the entire method, without tackling quantification.
In this study, a TAS to quantify a homologous series of γ- and δ- lactones was developed. In particular, two steps were first investigated: first, selection among stir bars with different coatings (PDMS and EG-silicone) and optimization of sampling conditions, and second, tuning the optimal enantioselective GC–MS conditions to combine a fast analysis method with baseline separation of all enantiomers in a single run. The performance of the analytical method was then evaluated in terms of linearity, limits of detection, quantification, and repeatability.
Lastly, the method was applied to a set of peach-flavored beverages, and the quantitative results processed by applying statistical multivariate methods (principal component analysis) for sample characterization and authentication.
Experimental
Materials and Reagents
Racemic γ- and δ-lactones (γ-hexalactone, γ-heptalactone, γ-octalactone, γ-nonalactone, γ-decalactone, γ-undecalactone, γ-dodecalactone and δ-octalactone, δ-nonalactone, δ-decalactone, δ-undecalactone, and δ-dodecalactone) and methyl octanoate were from the authors' standards collection. Ethanol and cyclohexane were purchased from Millipore (Milan, Italy), with purities equal to or above 99%. Deionized water (18.2 MΩ cm) was obtained from a Milli-Q water purification system (Millipore, Bedford, MA, USA).
A model juice solution was also prepared, by mixing 100 g of saccharose and 4 g of citric acid in 1 L of distilled water, as reported elsewhere (2).
A set of one homemade and 19 commercial naturally and artificially flavored peach juices (P. persica [L.] Batsch) were also analyzed. The commercial juices were purchased in a local supermarket.
Stir Bars
Stir bars (1 cm long), coated with 25 µL of polydimethylsiloxane (PDMS) and 32 µL of polyethyleneglycol-modified silicone copolymer (EG-silicone), were used. All stir bars were supplied by Gerstel GmbH & Co. (Mülheim a/d Ruhr, Germany) and conditioned 3 d under inert gas flow at 220 °C.
Standard and Sample Preparation
Individual stock solutions of γ-lactones, δ-lactones, and methyl octanoate (used as an internal standard) were prepared in a 10 mL sealed vial by dissolving 1 mg of pure standard in a mixture of 50:50 ethanol:ultrapure water to obtain a concentration of 100 ppm. Working standards of γ- and δ-lactones were prepared by adding appropriate amounts of stock standard solutions and 2 µL of methyl octanoate internal standard (IS) stock solution (final concentration was 10 ppb) to a 20 mL sealed vial, and further diluting with model juice solution to obtain a final volume of 20 mL. The natural peach juices were prepared by adding 2 µL of the IS to 20 mL of pure juice in a 20 mL sealed vial. The artificial flavored juices were first diluted 1:5 with model juice solution, because of the great abundance of lactones in these samples.
The optimized sampling conditions for SBSE sampling of the standard and sample solutions with each stir bar (PDMS and EG-silicone) were 15 min at room temperature (25 °C) under stirring at 1500 rpm.
After extraction, stir bars were removed from the sample, dried with filter paper, and placed in a glass tube, and in turn installed in a thermal desorption unit (TDU, Gerstel GmbH & Co., Mülheim a/d Ruhr, Germany). The thermally desorbed analytes were online injected into a GC–MS system for further analysis (see below). Blank runs were completed with each stir bar before and after each set of analyses, and no carryover effects were observed. Each experiment was repeated three times.
SBSE with Thermal Desorption–Enantioselective GC–MS Analysis
The thermal desorption unit (TDU) from Gerstel GmbH & Co. (Mülheim a/d Ruhr, Germany) was installed on an Agilent 6890 GC unit coupled to an Agilent 5973N MSD (Little Falls, DE, USA). Thermal desorption conditions: desorption temperature program: 30–230 °C (5 min) at 60 °C/min; flow mode: splitless, transfer line: 250 °C. A Gerstel CIS-4 PTV injector was used to cryogenically focus the analytes thermally desorbed from the stir bars. The PTV was cooled to -40 °C with liquid CO2; injector: PTV; injection temperature: from -40 to 250 °C (5 min) at 12 °C/s. The inlet was operated in split mode: split ratio 1:5.
Chromatographic conditions: column: 30% 6I–VII-O-TBDMS-2I–VII-3I–VII-O-acetyl-β-cyclodextrin diluted in PS-086 (10 m x 0.10 mm dc, 0.10 µm df) from Mega Srl (Legnano, Italy). Temperature program: 0 °C for 0.5 min, then 0–90 °C at 80 °C/min, 90–195 °C at 8.1 °C/min, 195–230 °C at 15 °C/min, then hold at 230 °C for 2 min. For all experiments, carrier gas was helium, flow-rate: 0.4 mL/min, in constant flow mode. MS operated in EI mode at 70 eV. Ion source temperature: 230 °C; quadrupole temperature: 150 °C. Mass range: from 35 to 350 amu (m/z).
The elution order of the enantiomers of the chiral lactones was assigned according to an in-house library based on mass spectra and linear retention indices, built up with reference compounds (21).
Quantification Method and Analytical Performance
Quantification was carried out by the external calibration method on 85 m/z and on 99 m/z target ions, for γ- and δ-lactones, respectively. The absolute amount of each enantiomer in the racemate was determined by analyzing each standard diluted in cyclohexane at 100 ppm by GC–FID, and determining the area ratio between the two enantiomers. The calibration curves of γ- and δ-lactones were prepared with five different concentrations, over ranges of 1–100 ppb and 1-50 ppb, respectively.
Repeatability and intermediate precision were determined by analyzing the standard mixtures under the conditions reported in the sections above, three times every two days over one week in the same laboratory, with the same instrument and operator. Five stir bars for each coating were used at random. Repeatability is expressed as relative standard deviation % (RSD%). Stir-bar repeatability was rigorously controlled by sampling the standard mixtures with two stir bars for each PDMS and EG-silicone coating from three different lots, for a total of six stir bars.
Limits of detection (LOD) and quantification (LOQ) were calculated following IUPAC recommendation:

where xwithbarbi is the mean of the blank measures, sbi is the standard deviation of the blank measures, and k is a numerical factor chosen depending on the confidence level desired (3 for LOD and 10 for LOQ). LOD and LOQ, expressed in terms of signal in equation 1, can be transformed into concentration by applying the following equation:

where conc is the analyte concentration and h is the peak height.
Data Analysis
All data analyses were conducted with Shimadzu GC–MS Solution 2.51 software (Shimadzu, Milan, Italy). All statistical processing was carried out using Statistica 10 (StatSoft. Inc., Tulsa, OK, USA) software.
Results and Discussion
This section reports the optimization of the enantioselective GC–MS and sampling methods to quantify lactones in peach juices; the method is then applied to a set of real-world samples, to illustrate its reliability in authenticating fruit-flavored beverages.
Optimization of the Sampling Method
The SBSE sampling procedure was optimized on two standard mixtures of racemic γ-lactones and δ-lactones (from γ-hexalactone to γ-dodecalactone, and from δ-octalactone to δ-dodecalactone), both diluted at 100 ppb (each enantiomer at 50 ppb) in a mixture of ethanol:water 50:50 under the chromatographic conditions reported in the section describing the optimization of the enantioselective GC–MS method. The following parameters were evaluated: extraction time, extraction temperature, and ionic strength. Furthermore, the performances of two stir-bar coatings (PDMS and EG-silicone copolymer) were tested and compared under the following conditions: extraction time: 15 min, extraction temperature: 25 °C, without salting out.
These conditions were derived from a series of experiments to optimize extraction time and temperature, and ionic strength. Figure 1 shows the results obtained for (R)-γ-decalactone, which was taken as reference as all the investigated lactones behaved similarly. Two sampling temperatures (25 °C and 60 °C) were tested, applying an extraction time of 30 min and without salting out. The extraction efficiency was comparable at both temperatures (Figure 1a); room temperature (25 °C) was therefore chosen. The influence of the ionic strength was tested by adding 1 or 2 g of NaCl to the standard mixtures. The results (Figure 1b) were again comparable, making salting out unnecessary. Lastly, different extraction times (10, 20, and 30 min) were applied: as expected, the results (Figure 1c) showed that analyte recoveries increased over time. However, given that even the shorter extraction times produced high extraction yield, good repeatability and intermediate precision, a nonequilibrium sampling approach under rigorously standardized conditions (15 min) was chosen to reduce the total analysis time.
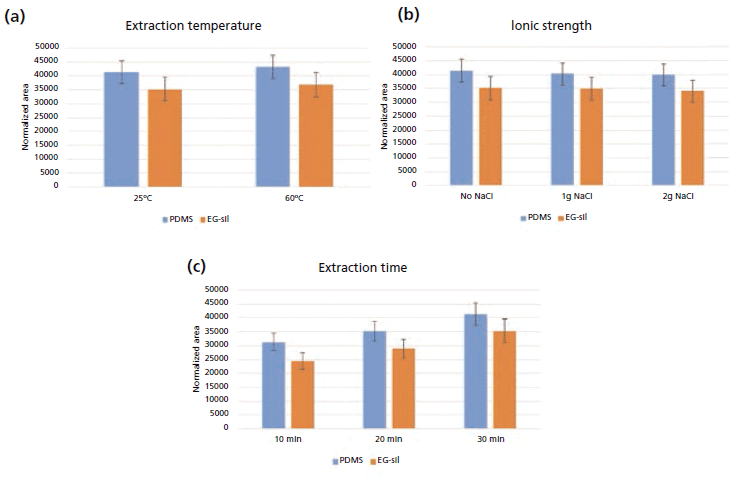
Figure 1: Extraction efficiency for (R)-γ-decalactone under different sampling conditions for stir-bars coated with PDMS (blue) and EG-silicone (red). Normalized peak areas obtained at (a) different extraction temperatures, (b) ionic strengths, and (c) and extraction times are reported.
The results showed that PDMS-coated stir-bars provided higher recoveries, probably because of the apolar nature of the lactones, with logKow ranging from 0.6 for γ-hexalactone to 3.6 for γ-dodecalactone. In particular, the normalized area of the low molecular weight lactones was almost double that obtained with the EG-silicone polymer. Figure 2 reports the comparison between the patterns of the 100 ppb lactone standard mixtures obtained with the two investigated stir-bars. The intermediate precision of the recoveries of the stir-bars coated with the two polymers (n = 5) was satisfactory, RSD% being below 12% for PDMS and only slightly higher (15%) for EG-silicone.
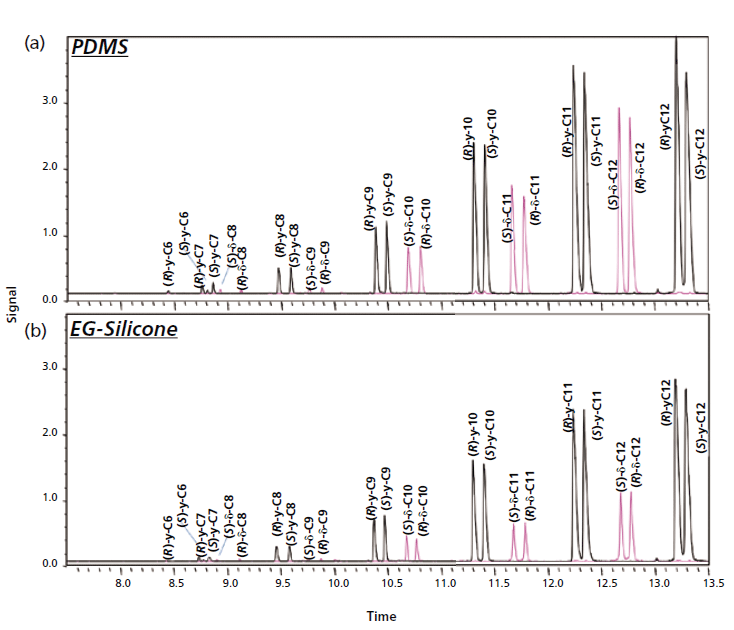
Figure 2: Enantioselective GC-MS profiles of the of 100 ppb mixture of γ-lactones (black) and δ-lactones (pink) sampled with stir-bars coated with (a) PDMS and (b) EG-silicone.
Optimization of the Enantioselective GC–MS Analysis Method
Enantioselective GC–MS with cyclodextrin (CD) as chiral selector can successfully discriminate between the enantiomers of the key odorants of peach, γ- and δ- lactones. This analysis requires the appropriate cyclodextrin derivative to be used, which can separate the enantiomers of all target compounds in a single run, and chromatographic conditions must be optimized (22,23). In agreement with this group's previous studies (4, 21), the 6I–VII-O-TBDMS-2I–VII-3I–VII-O-acetyl-β-CD was adopted as chiral selector, because of its ability to separate enantiomers of γ- and δ- lactones simultaneously. In chiral analyses, the chromatographic conditions are conditioned by the host–guest interaction mechanisms between each enantiomer and the cyclodextrin chiral selector, and are thermodynamically driven, thus limiting the heating rates and resulting in long analysis times. A short narrow-bore column (10 m x 0.10 mm dc, 0.10 µm df) had therefore to be chosen to achieve an analysis time compatible with the requirements of quality control. The chromatographic method was optimized to obtain a fast analysis, while maintaining baseline separation of all enantiomers in a single run (24). Moreover, thermodesorption of the analytes from the stir-bar required them to be cryofocused at the head of the column. The resulting optimized enantioselective GC temperature program was as follows: 0 °C for 0.5 min, then 0–90 °C at 80 °C/min, 90–195 °C at 8.1 °C/min, 195–230 °C at 15 °C/min, and hold at 230 °C for 2 min, with a total analysis time of 19 min.
Figure 3 reports the patterns of the homologous series of γ- and δ- lactones and of a peach juice sampled with a PDMS stir-bar.
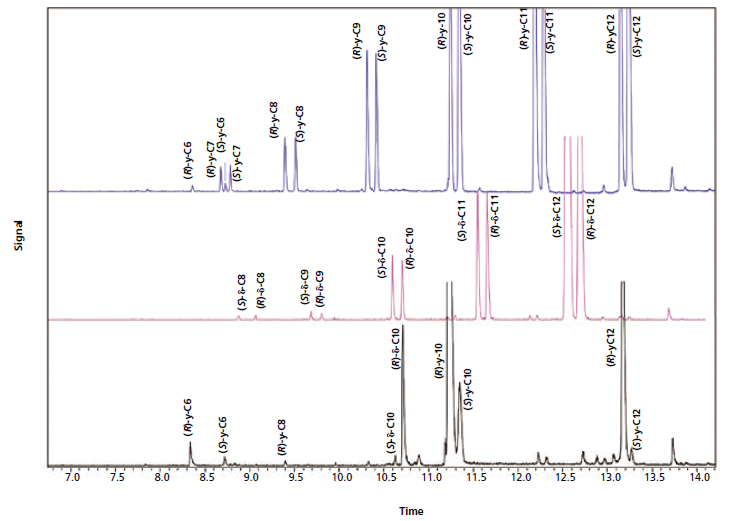
Figure 3: Optimized enantioselective GC-MS profiles of the homologous series of γ-lactones (blue), δ-lactones (pink) and peach juice (black) sampled with a PDMS stir-bar.
Development of the Quantification Meth-od and Evaluation of its Performance
The key odorants of the peach juices were quantified by the external calibration method. The calibration curves were built by analyzing different concentrations of the racemate standards of γ- and δ-lactones, diluted in a model juice prepared by mixing 100 g of saccharose and 4 g of citric acid in 1 L of distilled water (2). The investigated ranges were 1–100 ppb for γ-lactones and 1–50 ppb for δ-lactones.
The performance of the method was evaluated in terms of linearity, limits of detection and quantification, and repeatability, for both PDMS and EG-silicone stir-bars. Table II reports the results and shows the method's excellent linearity over the ranges investigated for all analytes with both coatings.
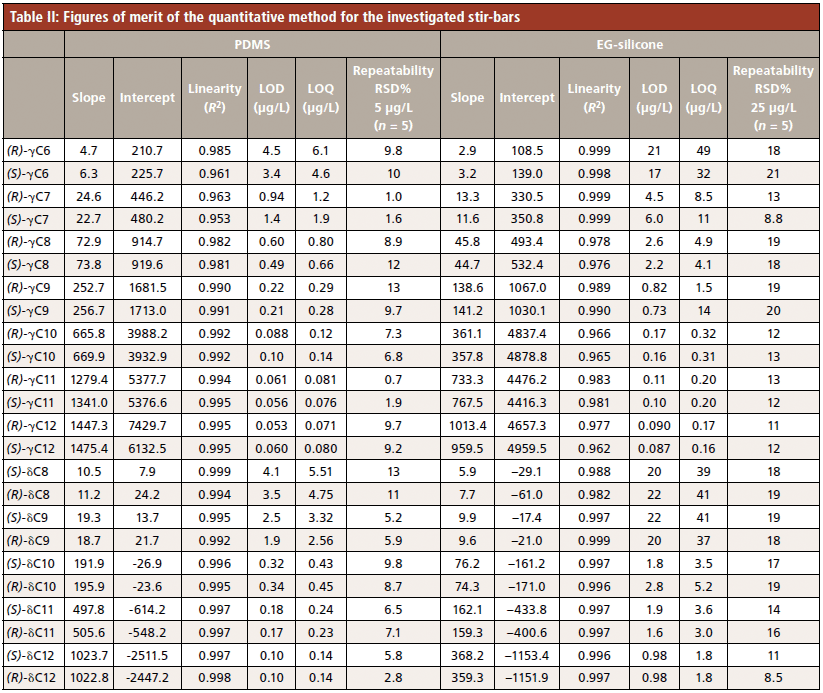
PDMS was chosen as stir-bar coating material because its limits of detection and quantification were considerably lower than those obtained with EG-silicone coatings (see above). LODs ranged from 0.053 ppb for (R)-γ-dodecalactone to 4.5 ppb for (R)-γ-hexalactone for PDMS, and from 0.087 ppb for (S)-γ-dodecalactone to 21 ppb for (R)-γ-hexalactone for EG-silicone. LOQs ranged from 0.071 ppb for (R)-γ-dodecalactone to 6.1 ppb for (R)-γ-hexalactone for PDMS, and from 0.16 ppb for (S)-γ-dodecalactone to 49 ppb for (R)-γ-hexalactone for EG-silicone. The repeatability performance was similar, with RSD% below 15% at 5 ppb with the PDMS coating and below 20% at 25 ppb for EG-silicone. Lastly, the performances of SBSE sampling were compared to those of the method developed previously with HS-SPME-enantioselective-GC–MS (4). The LODs with PDMS stir-bars for both γ-decalactone and δ-decalactone were about two orders of magnitude lower than those with HS-SPME (4), enabling the key odorants in peach juice to be analyzed at the ng/L (ppt) level for γ-decalactone (<100 ppt (ng/L) and few µg/L (ppb) for δ-decalactone (<5 µg/L (ppb)).
Analysis of Real-World Samples and Data Processing
The method was then applied to a set of real-world samples (19 commercial natural and artificial flavored peach juices), and the results compared to those of the reference standard.
The results were evaluated in terms of enantiomeric composition and absolute amount of the target analytes, and were processed with multivariate statistical analysis using principal component analysis (PCA) for rapid sample discrimination.
Figure 4 reports the PCA scores and loading plots of the enantiomeric composition of the investigated samples. The results show clear discrimination between natural and artificial flavored juices, based on the presence of non-natural lactones (lactones with an odd number of carbon atoms, or (S)-enantiomers for the even-carbon-atom lactones).
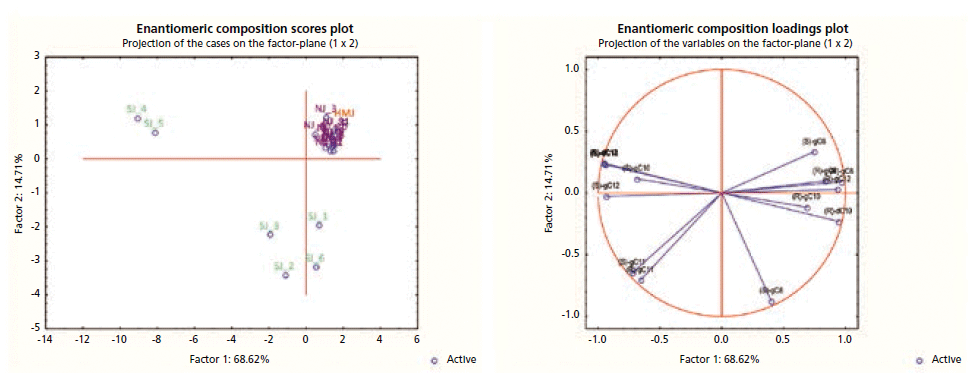
Figure 4: PCA scores and loading plots of the enantiomeric composition for the samples investigated. Legend: HMJ (red), reference juice; NJ (black), natural juice, SJ (green), artificially flavored juice.
Figure 5 reports the PCA scores and loading plots obtained by processing the absolute amount of lactones for the natural peach juices. The results showed clear discrimination of sample 5, both from the other commercial juices and from the reference juice, not detectable from the enantiomeric composition. This is because, although the enantiomeric composition of sample 5 is in accordance with that occurring naturally in peach, the absolute amount of all compounds is considerably higher than that of all other commercial and reference juices, indicating the possible addition of a natural aroma not mentioned in the label. This result clearly emphasizes the need to determine both enantiomeric composition and absolute amount of the chiral key odorants, to authenticate fruit flavored foods.
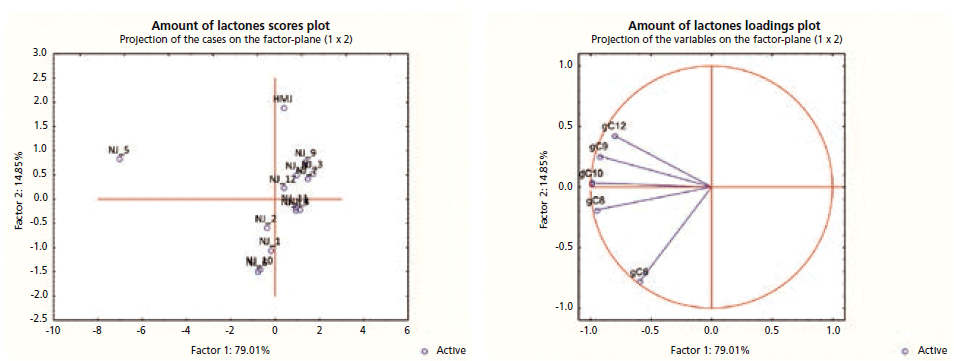
Figure 5: PCA scores and loading plots of the absolute amount of lactones for the natural juices. Legend: HMJ, reference juice; NJ, natural juice.
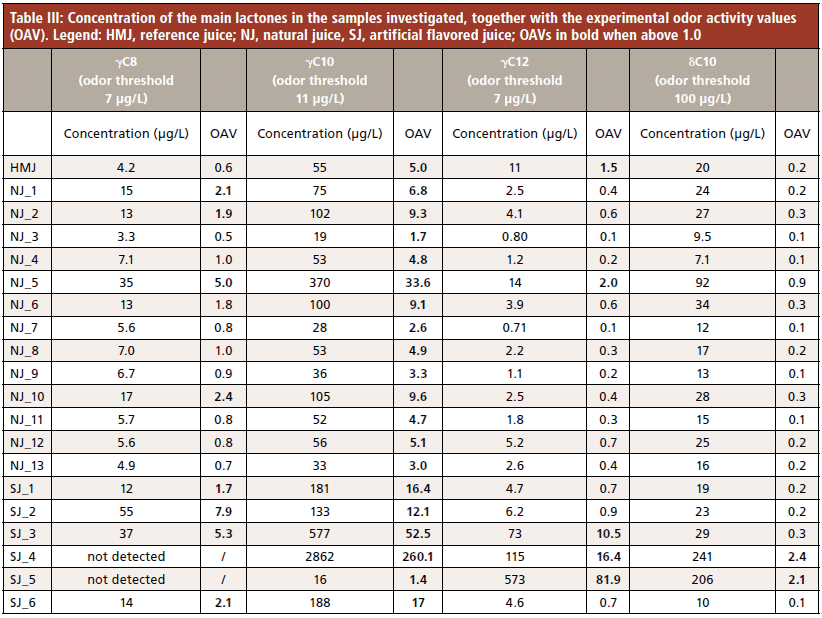
Finally, the absolute amount of the sum of the enantiomers was used to determine the odor activity value (OAV) of those lactones identified by Horvat and associates (18) as major contributors to peach aroma. The results, reported in Table III, show that only for γ-decalactone is the OAV above 1 in all the samples investigated, confirming that it may be considered the peach juice key odorant. The OAVs of the other lactones investigated are more variable, partly because flavoring ingredients are almost always added at concentrations above their odor threshold.
Conclusions
The study describes the development of a total analysis system to authenticate and assess the quality of fruit flavored food, based on quantification and enantiomer recognition of their chiral key odorants, in a single run. Peach was used as model fruit, and the enantiomers of its key aroma components (γ- and δ- lactones) were quantified in a set of natural and artificial peach-flavored juices.
Non-equilibrium fast SBSE with PDMS coating was combined with fast enantioselective GC-MS analysis, producing excellent results in terms of sensitivity (limits of detection and quantification in the ppt range), linearity, and repeatability. The quantitative data and enantiomeric composition were processed through online statistical elaboration (PCA) providing an effective and complementary discrimination among samples.
The total analytical method takes only 30 min, and does not require any sample pretreatment. It is simple, fast, and fully automated, and compatible with the processing of a large number of samples, as required in a routine quality control laboratory.
References
(1) A. Plotto, J. Bai, and E. Baldwin, in Fruits in Springer Handbook of Odor, A. Buettner, Ed. (Springer International Publishing, Cham, 2017), 171–190.
(2) M. Riuaumatell, M. Castellari, E. Lopeztamames, S. Galassi, and S. Buxaderas, Food Chem. 87, 627–637 (2004).
(3) A. Dunkel, M. Steinhaus, M. Kotthoff, B. Nowak, D. Krautwurst, P. Schieberle, and T. Hofmann, Angew. Chem. Int. Edit. 53, 7124–7143 (2014).
(4) C. Cagliero, C. Bicchi, C. Cordero, P. Rubiolo, B. Sgorbini, and E. Liberto, Food Chem. 132, 1071–1079 (2012).
(5) S. E. Ebeler, G. M. Sun, M. Datta, P. Stremple, and A. K. Vickers, J. AOAC Int. 84, 479–485 (2001).
(6) U. Ravid, M. Elkabetz, C. Zamir, K. Cohen, O. Larkov, and R. Aly, Flavour Frag. J. 25, 20–27 (2010).
(7) A. Manz, N. Graber, and H. M. Widmer, Sens. Actuat. B-Chem. 1, 244–248 (1990).
(8) J. C. Giddings, J. Chromatogr. A 703, 3–15 (1995).
(9) E. Baltussen, P. Sandra, F. David, and C. Cramers, J. Microcolumn Sep. 11, 737–747 (1999).
(10) F. David, N. Ochiai, and P. Sandra, Trends Anal. Chem. 112, 102–111 (2019).
(11) B. Sgorbini, C. Cagliero, C. Cordero, E. Liberto, P. Rubiolo, M. R. Ruosi, and C. Bicchi, J Chromatogr. A 1265, 39–45 (2012).
(12) A. Kremser, M. A. Jochmann, and T. C. Schmidt, Anal. Bioanal. Chem. 408, 943–952 (2016).
(13) C. Bicchi, E. Liberto, C. Cordero, B. Sgorbini, and P. Rubiolo, LCGC N. Am. 27, 376–390 (2009).
(14) Y. Zhu, C.-Y. Shao, H.-P. Lv, Y. Zhang, W.-D. Dai, L. Guo, J.-F. Tan, Q.-H. Peng, and Z. Lin, J. Chromatogr. A 1490, 177–190 (2017).
(15) J. Langen, P. Wegmann-Herr, and H.-G. Schmarr, Anal. Bioanal. Chem. 408, 6483–6496 (2016).
(16) C. Aubert, Z. Gunata, C. Ambid, and R. Baumes, J. Agr. Food Chem. 51, 3083–3091 (2003).
(17) C. Derail, T. Hofmann, and P. Sehieberle, J. Agr. Food Chem. 47, 4742–4745 (1999).
(18) R. J. Horvat, G. W. Chapman, J. A. Robertson, F. I. Meredith, R. Scorza, A. M. Callahan, and P. Morgens, J. Agr. Food Chem. 38, 234–237 (1990).
(19) B. Koppenhoefer, R. Behnisch, U. Epperlein, H. Holzschuh, A. Bernreuther, P. Piras, and C. Roussel, Perfum Flavor. 19, 1–14 (1994).
(20) A. Bernreuther, N. Christoph, and P. Schreier, J. Chromatogr,481, 363–367 (1989).
(21) E. Liberto, C. Cagliero, B. Sgorbini, C. Bicchi, D. Sciarrone, B. D. Zellner, L. Mondello, and P. Rubiolo, J. Chromatogr. A 1195, 117–126 (2008).
(22) C. Bicchi, A. D'Amato, and V. Manzin, in Derivatized Cyclodextrins in Enantiomer GC Separation of Volatiles in Flavours and Fragrances, K. A. D. Swift, Ed. (The Royal Society of Chemistry, London, 1997), pp. 57-69.
(23) C. Bicchi, A. D'Amato, V. Manzin, and P. Rubiolo, Flavour Frag. J. 12, 55–61 (1997).
(24) C. Bicchi, L. Blumberg, C. Cagliero, C. Cordero, P. Rubiolo, and E. Liberto, J. Chromatogr. A 1217, 1530–1536 (2010).
Cecilia Cagliero, Alessandro Guglielmetti, Chiara Cordero, Erica Liberto, Arianna Marengo, Barbara Sgorbini, Patrizia Rubiolo, and Carlo Bicchi are with the Department of Drug Science and Technology at the University of Turin, in Turin, Italy. Direct correspondence to: cecilia.cagliero@unito.it
New Study Reviews Chromatography Methods for Flavonoid Analysis
April 21st 2025Flavonoids are widely used metabolites that carry out various functions in different industries, such as food and cosmetics. Detecting, separating, and quantifying them in fruit species can be a complicated process.
Quantifying Terpenes in Hydrodistilled Cannabis sativa Essential Oil with GC-MS
April 21st 2025A recent study conducted at the University of Georgia, (Athens, Georgia) presented a validated method for quantifying 18 terpenes in Cannabis sativa essential oil, extracted via hydrodistillation. The method, utilizing gas chromatography–mass spectrometry (GC–MS) with selected ion monitoring (SIM), includes using internal standards (n-tridecane and octadecane) for accurate analysis, with key validation parameters—such as specificity, accuracy, precision, and detection limits—thoroughly assessed. LCGC International spoke to Noelle Joy of the University of Georgia, corresponding author of this paper discussing the method, about its creation and benefits it offers the analytical community.


