Solid-Phase Microextraction Combined with Flow-Modulated Comprehensive Two-Dimensional Gas Chromatography for Screening Leachables in the Pharmaceutical Industry
Special Issues
Nanomaterials are extremely useful as sorbents for sample preparation, because of their varied morphologies, high surface area, surface-tovolume ratio, porosity, and ability to interact with samples in a variety of ways. Here, we review how nanomaterials are being used in a variety of sample preparation techniques, such as dispersive solid-phase extraction (dSPE), solid-phase microextraction, stir-bar sorptive extraction, and matrix solid-phase dispersion.
Extractables and leachables (E&Ls) are compounds that may be released from materials that contact drugs during drug storage, which may affect product quality and safety. Such compounds typically are found at trace levels, making their evaluation a difficult task. In this article, we propose a simple method for the analysis of leachables employing solid- phase microextraction (SPME) and comprehensive two-dimensional gas chromatography, coupled to mass spectrometry (GC×GC–MS). This fully automated method bypasses the use of solvents and excessive sample handling. Four potential leachables were tentatively identified.
The United States Food and Drug Administration (US FDA) has recently given increased attention to non-intentionally added substances from contact materials, which may contaminate biopharmaceutical products during the manufacturing process or product storage. Extractables and leachables (E&Ls) are chemical compounds that may have both an organic or inorganic nature (1). Extractables are compounds that can migrate from a contact material under laboratory conditions, like exaggerated temperature, solvent, and time exposure (2). Leachables are contaminants that migrate spontaneously from a contact material (container closure system, packaging, or processing equipment) under normal conditions of product use or storage (2). E&Ls have potential effects on product quality and safety, as they may interact with the drugs reducing its efficacy, and may be toxic to patients, as shown in Figure 1 (3) E&Ls result from product interaction (contact) with filters, gaskets, stoppers, storage bags, cartridges, prefilled syringes, septa, caps, and even from the surface of components used in the manufacturing line (pistons and grinders) (2,3). These impurities are of concern for patients, because of potential effects on product quality and safety. For instance, leachables could interact with a protein drug and form protein adducts, and thus affect the quality of the biopharmaceutical product (4). Moreover, drug efficacy may be dampened by chemical reactions between drug and leachables (cross-reaction), as shown in Figure 1, or by impacting a property of the drug product (pH, appearance, particulate matter) (3). Also, E&L testing should be conducted during manufacturing scale-up after drug regulatory approval.

Figure 1: (a) Scope of extractables and leachables (E&L) investigation and (b) dimensions of compatibility assessment.
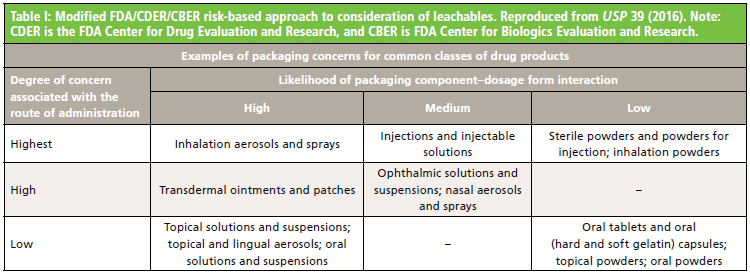
The degree of concern about E&Ls for any given biopharmaceutical product must be evaluated through a risk-assessment process that accounts for the route of administration and the likelihood of interactions between the dosage form and any leachables. Hence, inhalation aerosols and solutions, injections, and injectable suspensions are of the highest concern; ophthalmic solutions and suspensions, transdermal ointments and patches, and nasal aerosols and sprays are of high concern, as shown in Table I (5). The Product Quality Institute has established a Safety Concern Threshold (SCT) for some contaminants; when above the SCT value, a toxicological evaluation must be performed for leachables (6). Although some contaminants have SCT values, there is still no specific standard or guidance for E&L assessment (5). This is due in part to the difficulty of detecting and identifying such compounds, normally present in trace concentrations. Accordingly, there is an urgent need to develop highly efficient and sensitive analytical methods for quality assurance (QA) and quality control (QC).
For instance, some drug impurities are genotoxic and may induce genetic mutations, chromosomal breaks, or rearrangements in humans (7). For example, a tolerable daily intake may be as low as 1.5 µg per day (8). Considering a typical contaminant, such value may translate to low parts per million of impurities in drug substances. However, molecular investigations using conventional techniques such as vibrational spectroscopy, nuclear magnetic resonance, and elemental analysis are somewhat insensitive to trace-level determination of pharmaceutical impurities. The main problem associated with such investigations is the absence of standard protocols. Consequently, E&L research is highly dynamic and generates an aggressive demand for novel and modern analytical methods because E&L studies are product related, which requires extensive and continuous research and development (R&D).
The global pharmaceutical industry has reached unprecedented revenues of $1.11 trillion dollars in 2017 (1). For 2020, the growth is estimated to reach $1.43 trillion dollars. This is a research-driven industry that just in 2015 invested nearly $149.8 billion in R&D projects, being the leading segment in R&D investments. The largest market today is the United States, which accounts for more than 45% of the pharmaceutical market share. In the coming years, it is expected that South American markets will begin to emerge as well. Most of the research efforts are dedicated to drug research, development, and approval. E&L research is an emerging demand of the pharmaceutical industry, and should require considerable investment in R&D projects for quality assurance of E&L from contact materials used in the manufacturing process of the medicines and during product storage. In this context, analytical chemistry is fundamental to tackle the challenges of E&Ls in the biopharmaceutical industry by using high-resolution and sensitive instrumental analysis, such as separations using chromatography and mass spectrometry.
Sample preparation is a mandatory step in almost every analytical method, allowing analyte extraction, cleanup, and preconcentration. Such methods have a high importance for the analysis of trace-level compounds. Contemporary sample preparation techniques have been used for E&L analysis, including Soxhlet extraction, and liquid–liquid extraction (9). Such methods use exhaustive techniques that are both time- and solvent-consuming (10). Besides, exhaustive techniques require multistep procedures that may lead to inaccurate measurements (11). Furthermore, excessive sample handling and multistep methods are more susceptible to sample contamination, compared to single-step procedures, and thus may jeopardize accurate leachable assignment (12,13).
Solid-phase microextraction (SPME) (14) is a solventless and miniaturized technique that enables analyte extraction and preconcentration in a single step (15). This equilibrium-based technique was introduced by Pawliszyn in the early 1990s, and has been applied successfully in many fields of analytical chemistry. SPME may be used to isolate analytes from the headspace (HS), or by direct immersion (DI) into the sample solution, depending on the Henry's law constant of the target compound (16). The latter, DI mode, is recommended for analysis of compounds in low levels in clean matrices, such as drug products (17), being a promising technique for E&L screening.
Comprehensive two-dimensional gas chromatography coupled to mass spectrometry (GC×GC–MS) is a powerful technique for the analysis of volatile and semivolatile complex mixtures, offering unprecedented peak capacity and detectability (18). The principle of GC×GC resides in the hyphenation of two sequential and complementary GC separations in a single run (18). Improved resolving power is attained by a two-factor combination, namely, coupling of two GC columns with distinct selectivity, and highly efficient transfer of the effluent of the primary (1D) to the secondary column (2D) as sharp solute bands. Traditional GC×GC applications relied mostly on thermal and cryogenic interfaces for solute reinjection (19). As a consequence, the costs of acquisition, operation, and upkeep have prevented GC×GC from being considered for routine analysis. Conversely, flow modulation (FM) is an inexpensive and robust technique for GC×GC interfacing, bypassing the need for expert users. For instance, we estimated that a flow modulator enabled a twentyfold reduction in the operating costs compared with a liquid nitrogen (LN2) based cryogenic interface based on our laboratory expenses in the years 2017 and 2018. Furthermore, an 86% savings may be attained with FM when compared to a consumable-free N2 based thermal modulator. In the most efficient setup (20), the modulator uses a microfluidic interface with a small footprint and an auxiliary gas, which operates at typical flow rates up to 20 mL/min. Flow modulation comprises two steps, namely, sampling and reinjection. For solute sampling, the auxiliary gas directs the 1D effluent to an 0.53-mm-id sampling loop (up to 50 µL). Next, the auxiliary gas is actuated and a countercurrent surge of gas sweeps the bands into the 2D. Under typical chromatographic conditions, comprehensive modulation is ensured for sensitive analysis. Flow modulators have been successfully used in GC×GC for the analysis of fragrances and allergens, aroma-related compounds in beverages, and analysis of fuels (21–23). Hence, FM-GC×GC analysis may be an interesting alternative for reliable E&L screening, being particularly suited for trace level investigations.
In this article, we discuss the potential of direct immersion solid-phase microextraction and flow-modulated GC×GC–MS for screening leachables in biopharmaceutical drugs. This case study evaluated potential extractables from a nasal drug solution by DI-SPME and FM-GC×GC–MS. Data mining was performed by using a pixel-based approach, namely, multilinear principal component analysis (MPCA). The proposed method eliminated the use of organic solvents and greatly reduced sample manipulation, being an ideal solution for fully automated and high sample throughput QA and QC methods.
Materials and Methods
Samples and Chemicals
The nasal solutions studied (Batch ABCD-2044) were purchased from a local drug store. Ethanol and methanol were purchased from Honeywell (Morris Plains, NJ, USA). The ultrapure water (18.2 MΩ-cm) used was supplied by a Direct-Q water purification system (Merck KGaA, Darmstadt, Germany). Linalool, ethyl caprate, and naphthalene standards were purchased from Sigma-Aldrich (St. Louis, MO, USA). A 50:30 mm poly-dimethylsiloxane:divinylbenzene (PDMS–DVB) SPME fiber (Sigma Aldrich) was used for analyte isolation. A set of 20 mL clear glass vials, magnetic screw caps, and PTFE–PDMS septa were used throughout the SPME extractions (Sigma-Aldrich).
Evaluation of SPME Desorption Conditions
The PDMS–DVB SPME fiber was conditioned as recommended by the manufacturer. An aqueous working solution composed of 50 mg/mL of linalool, ethyl caprate, and naphthalene was used to evaluate SPME desorption conditions.
In the SPME experiments, 20 mL of working solution was placed into a 20 mL glass vial. Sample was pre-equilibrated at 40 °C for 5 min. DI-SPME was performed by exposing the fiber to the working solution at 40 °C for 15 min. Afterwards, the fiber was desorbed in the GC inlet at 260 °C for 1 min. Each sample was analyzed in quadruplicate for each desorption method, as detailed in Table II.

Profiling Leachables in Nasal Solution
Assignment of leachables used a side-by-side comparison between a control group and a stressed group of nasal solution samples. A total of eight commercial samples were purchased from the same batch (undisclosed manufacturer). In all experiments, the samples were used as received. An accelerated stability test was performed to produce the stressed group of commercial samples, which were kept at 50 °C for 30 d (Jeio Tech, Seoul, South Korea). In the stability experiments, the positioning of the sample boxes was standardized and kept horizontal to ensure solution contact with all components of the low-density polyethylene (PE) flask.
Sample unboxing was only performed prior to chromatographic analysis. For the SPME experiments, aliquots of 20 mL of nasal solution were transferred to 20 mL glass vials. Samples were pre-equilibrated at 45 °C for 5 min. The PDMS–DVB fiber was exposed to the sample solution for equilibration at 45 °C for 30 min. For GC×GC analysis, the fiber was desorbed at the GC inlet for 1 min at 260 °C. The SPME fiber was rinsed with 1:1 (v/v) water:methanol solution between extractions to prevent salt deposit.
GC×GC–MS Method
All analyses were performed on a GC×GC system, comprised of a Trace 1310 GC intrument, ISQ single quadrupole mass spectrometer, and Triplus RSH Autosampler (Thermo Scientific, Waltham, MA, USA). Differential flow modulation using the reverse fill-flush configuration was attained using Insight modulator (SepSolve Analytical, Frankfurt, Germany).
The final method employed helium as the carrier gas and auxiliary gas at constant flow rates of 1.00 mL/min and 12.80 mL/min. Sample introduction was performed using splitless injection and 1.00 min sampling time.
All separations were carried out using a 30 m x 0.25 mm (0.20 µm) Mega-5 primary column and a 5 m x 0.25 mm (0.20 µm) Mega-17 secondary column (Mega, Legnano, MI, Italy). A restriction capillary of 5 m x 0.10 mm and 21 cm x 0.53 mm (50 µL) sampling loop were used for flow modulation. A scanning range of 50 to 450 m/z units was used for signal acquisition (19 scans/s). Transfer line and the ion source were operated at 300 and 275 °C, respectively.
Data Analysis
XCalibur software (Thermo Scientific) and ChromSpace (SepSolve Analytical) were used for instrument control and data acquisition. GC Image (Zoex, Houston, TX, USA) was employed for tentative identification of analytes by combining mass spectrum similarity and linear temperature programmed retention index (LTPRI) filtering. A minimum similarity match of 80% was considered. In addition, the chromatograms were exported to ANDI/netCDF. MATLAB R2014b (MathWorks, Natick, MA, USA) was used to perform pattern recognition. PLS Toolbox 7.5 (Eigenvector Research Inc., Wenatchee, WA, USA) was used to perform multilinear principal component analysis (MPCA).
Results and Discussion
General Considerations for Method Optimization
Flow modulation comprises two stages, namely, sampling (fill) and re-injection (flush) (20). The analyst must select the modulation period within the maximum sampling time allowed by the chromatographic conditions. A general rule is to avoid modulation conditions that exceed 75% of the capacity of the sampling loop to ensure sensitive analyses.
A general guideline may be attained by considering the maximum sampling duration and minimum reinjection duration. Such parameters may be estimated by the equations listed below.
Fill = (0.75 × volume of sampling loop) / 1D flow rate
Flush = (1.5 × sampling loop) / 2D flow rate
Analyte desorption must also be considered when coupling SPME and GC×GC. High linear velocities of carrier gas around the coating during analyte desorption is required to improve mass transfer and peak efficiency (17). Flow modulators, unlike thermal interfaces, typically operate at lower flow rates in the primary column. Therefore, we have designed three representative methods, as detailed in Table II, that may be used to improve mass transfer in the injection port, while retaining the flows required for proper band modulation. The impact of such conditions was evaluated using a stock solution of linalool, ethyl caprate, and naphthalene.
The flow rate in the primary column increased in the following order: method CC < method CP < method PP, where CC is constant–constant flow, CP is constant–programmed flow, and PP is programmed–programmed flow. Clearly, there is a significant improvement in peak volume for all analytes when increasing 1D flow rate, as shown in Figure 2. Although there was an improvement in mass transfer under such conditions, the signal-to-noise ratio was compromised by increasing the injection pulse. Considering that signal-to-noise ratio plays a critical role in peak detection, method CC that uses constant carrier gas flow and constant auxiliary gas flow rates was selected for the analysis of leachables.

Figure 2: Bar graph comparing GC×GC methods considering (a) peak volume, and (b) signal-to-noise ratio. Carrier and auxiliary gases were operated at constant-constant (CC) flow; constant-programmed flow (CP), and programmed-programmed (PP) flow.
Screening of Leachables from a Nasal Drug Solution
Nasal solutions are of high concern in risk assessment for E&Ls. Since leachables may exhibit high toxicity, there is an urgent need to detect and assign such contaminants. An accelerated stability assay uses exaggerated exposure conditions to evaluate leachables. Thus, comparative analysis of samples from the control and stressed groups readily enabled assignment of these contaminants.
The selected nasal spray is sold in a low density polyethylene (PE) bottle. This polymer is readily susceptible to contamination by diffusion of contaminants through the wall into the drug solution. Consequently, components from the cardboard box, label, ink, and adhesive may leach into the solution during the accelerated stability experiment. To screen for leachables, control and stressed samples were analyzed by DI-SPME and GC×GC–MS.
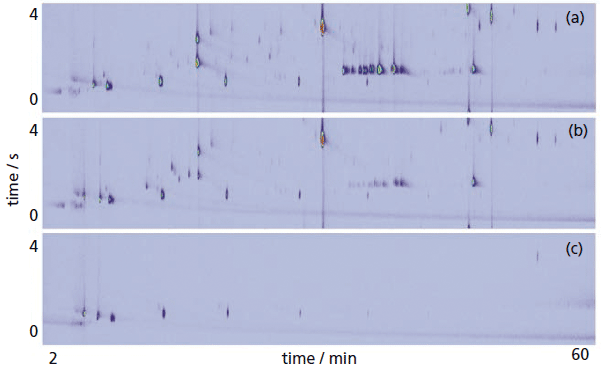
Figure 3: Total ion chromatograms obtained by GC×GC-MS of (a) the control sample, (b) the stressed sample, and (c) the blank using DI-SPME sampling with PDMS-DVB fiber.
GC×GC–MS generates a large amount of structurally complex data, wherein important information may be lost or overlooked during conventional data analysis. For instance, visual inspection of the chromatograms in Figure 3 indicated variations in profile of the control and stressed samples. For proper assignment of leachables, multiway principal component analysis (PCA) was applied for pattern recognition. A two-component scores plot revealed significant differences between the GC×GC profiles of stressed and control samples along the first principal component (PC), as shown in Figure 4.
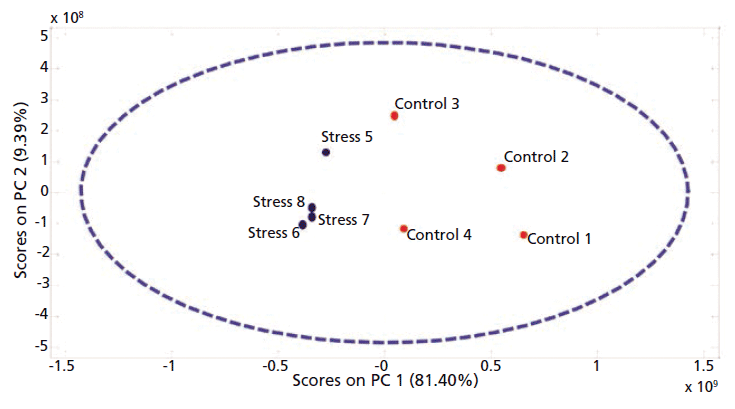
Figure 4: Pixel-based, two-component MPCA scores plot of evaluated samples, namely, nasal solutions after accelerated stability experiment (Stress) and control group (Control).
It can be readily seen from Figure 4 that stress-related peaks can be found in the negative scores and loadings. Therefore, a leachable assignment was performed by template matching using GC Image software. First, a virtual chromatogram was reconstructed using a vector that comprised the negative loadings of PC-1. This image was composed of pixels with proven variance between stressed and control samples and exhibited the shapes of chromatographic peaks (Figure 5). Second, the virtual chromatogram was used to create a template. This template was loaded and applied to the sample chromatograms for leachable identification. The reader is directed elsewhere for a detailed description of this procedure (22,24).
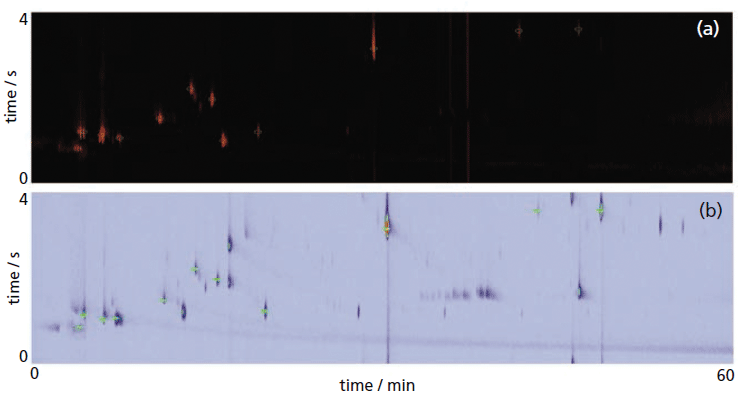
Figure 5: Creation of peak template using the (a) loadings vector, reconstructed chromatogram. (b) showing template matching process using GC Image highlighting potential leachables in the GC×GC-MS total ion chromatogram of a stressed sample of nasal solution.
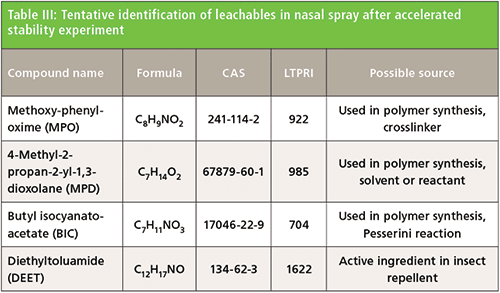
Tentative peak identification of leachables is shown in Table III. Four analytes were found exclusively in stressed samples and assigned as potential leachables, namely methoxy-phenyl-oxime (MPO), 4-methyl-2-propan-2-yl-1,3-dioxolane (MPD), butyl isocyanatoacetate (BIC) and N,N-diethyl-m-toluamide (DEET). MPO is a common non-intentionally added substance that was reported in PE-based milk packaging (25–27). BIC is commonly used in polymer synthesis as part of Passerini reaction (28), while 1,3-dioxolane is used as an aprotic solvent for use in formulation, production processes, and as a reactant in polymer synthesis, which may explain the presence of MPD. Noteworthy, DEET is an active ingredient of commercial insect repellents. This compound is extremely mobile and persistent (29). DEET may have originated from the cardboard contamination or shipping pellets.
Conclusions
Advances in research in the biopharmaceutical industry have contributed to the decline of diseases and to the industry's economic expansion. However, there are still high-risk areas that need to be studied, such as those involving drug storage materials. These materials may represent a potential source of contamination from the migration of extractables and leachables. In this article, we discussed the application of solid-phase microextraction and comprehensive two-dimensional gas chromatography coupled to mass spectrometry for screening leachables in a nasal spray solution. SPME is an interesting alternative to solvent-based techniques for E&L experiments, bypassing the need for solvents and cumbersome liquid handling. Furthermore, flow modulated GC×GC–MS is an inexpensive technique that may be adopted by the pharmaceutical industry for routine analysis, given that FM is more robust and user-friendly than thermal–cryogenic modulation. This method is fully automated, making it ideal for routine analysis in QA and QC laboratories. The results from this study may assist both industry and regulatory agencies to ensure quality and safety for drugs. We hope this proof-of-concept application may also guide regulatory agencies to develop standardized protocols extractable and leachable studies.
Acknowledgments
We are indebted to Nova Analítica (D Pierone and F Lugão) for establishing our research laboratory by generously providing ThermoFisher Scientific instruments. We thank SepSolve Analytical (M Edwards) and MEGA srl (S Galli) for the continuous technical support. J Crucello and A Paiva thank the Coordination for the Improvement of Higher Education Personnel (CAPES) for research fellowships. The São Paulo Research Foundation (FAPESP 2017/24590-1) and National Council for Scientific and Technological Development (CNPq 400182/2016-5) are acknowledged for funding our research.
References
(1) D.B. Lewis, Current FDA Perspective on Leachable Impurities in Parenteral and Ophthalmic Drug Products, AAPS Workshop on Pharmaceutical Stability – Scientific and Regulatory Considerations for Global Drug Development and Commercialization, October 2011. https://www.fda.gov/downloads/AboutFDA/CentersOffices/CDER/UCM301045.pdf (accessed 29 January 2019).
(2) I. Markovic, Expert Opin. Drug Saf. 6 , 487–491 (2007).
(3) D. Jenke, J. Pharm. Sci. 96, 2566–2581 (2007).
(4) D.L. Norwood, D. Paskiet, M. Ruberto, T. Feinberg, A. Schroeder, G. Poochikian, Q. Wang, T.J. Deng, F. DeGraziom M.K. Munos, and L.M. Nagao, Pharm. Res. 25, 727-739 (2008).
(5) B.P.S. Alliance, Bioprocess Int. 5, 36–49 (2007).
(6) T.H. Broschard, S. Glowienke, U.S. Bruen, L.M. Nagao, A. Teasdale, C.L.M. Stults, K.L. Li, L.A. Iciek, G. Erexson, E.A. Martin, and D.J. Ball, Regul. Toxicol. Pharmacol. 81, 201–211 (2016).
(7) T.D. Ho, P.M. Yehl, N.P. Chetwyn, J. Wang, J.L. Anderson, and Q. Zhong, J. Chromatogr. A 1361, 217-228 (2014).
(8) N. Raman, A. Prasad, and R. Reddy, J. Pharm. Biomed. Anal. 55, 662-667 (2011).
(9) N. Dorival-García, S. Carillo, C. Ta, D. Roberts, K. Comstock, S. Lofthouse, E. Ciceri, K. D'Silva, G. Kierans, C. Kaisermayer, A. Lindeberg, and J. Bones, Anal. Chem. 90, 9006–9015 (2018).
(10) E. Carasek, L. Morés, and J. Merib, Trends Environ. Anal. Chem. 19, e00060 (2018).
(11) Z. Zhang, M.J. Yang, and J. Pawliszyn, Anal. Chem. 66, 844A–853A (1994).
(12) M. de Fátima Alpendurada, J. Chromatogr. A. 889, 3–14 (2000).
(13) E. Boyaci, á. Rodríguez-Lafuente, K. Gorynski, F. Mirnaghi, é.A. Souza-Silva, D. Hein, and J. Pawliszyn, Anal. Chim. Acta. 873, 14–30 (2015).
(14) S. Risticevic, J.R. DeEll, and J. Pawliszyn, J. Chromatogr. A. 1251, 208–218 (2012).
(15) J. Pawliszyn, in Handbook of Solid Phase Microextraction, J. Pawliszyn, Ed. (Chemical Industry Press, Beijing, China, 2012), pp. 61–97.
(16) E. Psillakis, A. Mousouraki, E. Yiantzi, and N. Kalogerakis, J. Chromatogr. A 1244, 55-60 (2012).
(17) J. Pawliszyn, Solid Phase Microextraction; Theory and Practice, first ed., (Wiley-VCH, New York, New York, 1997).
(18) J.V. Seeley and S.K. Seeley, Anal. Chem. 85, 557–578 (2013).
(19) P.Q. Tranchida, G. Purcaro, P. Dugo, L. Mondello, and G. Purcaro, Trends Anal. Chem. 30, 1437–1461 (2011).
(20) J.F. Griffith, W.L. Winniford, K. Sun, R. Edam, and J.C. Luong, J. Chromatogr. A. 1226, 116–123 (2012).
(21) M. Edwards, A. Mostafa, and T. Górecki, Anal. Bioanal. Chem. 401, 2335–2349 (2011).
(22) J. Crucello, L.F.O. Miron, V.H.C. Ferreira, H. Nan, M.O.M. Marques, P.S. Ritschel, M.C. Zanus, J.L. Anderson, R.J. Poppi, and L.W. Hantao, Anal. Bioanal. Chem. 410, 4749–4762 (2018).
(23) C. Cordero, P. Rubiolo, S.E. Reichenbach, A. Carretta, L. Cobelli, M. Giardina, and C. Bicchi, J. Chromatogr. A. 1480, 70–82 (2017).
(24) L.W. Hantao, B.R. Toledo, F.A.L. Ribeiro, M. Pizetta, C.G. Pierozzi, E.L. Furtado, and F. Augusto, Talanta. 116, 1079–1084 (2013).
(25) A. Anane, B. Dlubak, H. Idzuchi, H. Jaffres, M.B. Martin, Y. Otani, P. Seneor, and A. Fert, in Handbook of Spintronics , Y. Xu, D.D. Awschalom, and J. Nitta, Eds. (Springer Netherlands, Dordrecht, Netherlands, 2016), pp. 681–706.
(26) J. Yue, Y. Zheng, Z. Liu, Y. Deng, Y. Jing, Y. Luo, W. Yu, and Y. Zhao, Int. J. Food Prop. 18, 2193–2212 (2015).
(27) D. Wang, Y. Zheng, Z. Liu, G. Hu, and Y. Deng, J. Food Nutr. Res. 3, 26–33 (2015).
(28) A. Lv, X.X. Deng, L. Li, Z.L. Li, Y.Z. Wang, F.-S. Du, and Z.-C. Li, Polym. Chem. 4, 3659 (2013).
(29) S.D. Costanzo, A.J. Watkinson, E.J. Murby, D.W. Kolpin, M.W. Sandstrom, Sci. Total Environ. 384, 214–220 (2007).
Juliana Crucello, Andre Cunha Paiva, and Leandro W. Hantao are with the Institute of Chemistry at the University of Campinas, Brazil. Direct correspondence to: wang@unicamp.br
Determining the Effects of ‘Quantitative Marinating’ on Crayfish Meat with HS-GC-IMS
April 30th 2025A novel method called quantitative marinating (QM) was developed to reduce industrial waste during the processing of crayfish meat, with the taste, flavor, and aroma of crayfish meat processed by various techniques investigated. Headspace-gas chromatography-ion mobility spectrometry (HS-GC-IMS) was used to determine volatile compounds of meat examined.

.png&w=3840&q=75)

.png&w=3840&q=75)


.png&w=3840&q=75)


.png&w=3840&q=75)


