Exploring the Efficiency of Various Extraction Approaches for Determination of Crude (4-methylcyclohexyl)methanol (MCHM) Constituents in Environmental Samples
Special Issues
Crude (4-methylcyclohexyl)methanol (MCHM) is a chemical contaminant that must be monitored in fresh water environments, because of significant health risks to surrounding human populations. A new method for MCHM analysis was developed using solid-phase microextraction (SPME) and thin film microextraction (TFME) combined with GC–MS. Both methods achieved limits of quantitation lower than standard methods using SPE.
Crude (4-methylcyclohexyl)methanol (MCHM) is a chemical blend, mainly used in the coal industry for the separation of usable coal from rocks, debris, and coal dust by froth flotation. Following a 2014 MCHM spill in the Elk River in West Virginia, studies demonstrated that MCHM sorbed into water pipes and linings readily desorbed from polyethylene into water at levels above the odor threshold, confirming the risk of its long-term exposure from contaminated tap water pipelines. In light of this, it is imperative to develop analytical methods able to detect crude MCHM components in environmental water samples. In this work, two microextractive methods based on solid-phase microextraction (SPME) in fiber format and thin film microextraction (TFME) were developed and validated. Their performance was compared with a modified solid-phase extraction (SPE) method based on U.S. Environmental Protection Agency (EPA) Method 522 for analysis of volatiles in water. SPME and TFME methods both showed enhanced performance in terms of achievable limit of quantitation (LOQ) compared to the SPE protocol. Moreover, the sensitivity of the TFME method, coupled with its higher analytical throughput, established TFME as the optimal extraction approach for 4-MCHM and other constituents of crude MCHM, with limits of quantitation below the odor threshold for aqueous crude MCHM in 19–21 °C deionized water (0.55 µg/L).
On January 9, 2014, an estimated 37,800 liters (9,986 gallons) of a chemical mixture was spilled into the Elk River upriver from Charleston, West Virginia. This mixture, used in a purification process for coal, contained crude (4-methylcyclohexyl)methanol (MCHM; 88.5%), a proprietary blend of stripped polyglycol ethers (PPh; 7.3%) and water (4.2%). Crude MCHM is composed of (4-methylcyclohexyl)methanol (4-MCHM; 68–89%), 4-(methoxymethyl)cyclohexanemethanol (4MMCH; 4–22%), methyl 4-methylcyclohexanecarboxylate (MMCHC; 5%), dimethyl-1,4-cyclohexanedicarboxylate (DM-1-4-CHC; 1%), 1,4-cyclohexanedimethanol (1-4CHDM; 1-2%), water (4–10%) and methanol (1%) (1). The drinking water treatment plant located in Charleston, operated by West Virginia America Water (WVAW), was contaminated along with the water supply of approximately 300,000 residences. This may be an ongoing problem, given that it has been demonstrated that 4-MCHM readily adsorbs and desorbs from pipes made from polyethylene materials (2), creating a risk of chronic exposure for contaminated households. Analysis was not performed on the day of the spill, but the next day contamination levels as high as 2400 µg/L 4-MCHM were detected exiting the WVAW treatment plant (3). Concentrations of 4-MCHM in the range of 2–5 µg/L were found persisting from January 20 to February 2, 2014 (4). Analysis of tap water from households indicated that contamination was not limited to the WVAW facility, but also affected the entire water distribution system, evidenced by concentrations as high as 420 µg/L being found in drinking water two weeks after the spill (5). Tap water from residences with different water suppliers were demonstrated to be contaminated by crude MCHM, with 4-MCHM being identified over 600 km from the spill site in Louisville, Kentucky (6). Of the approximate 300,000 households directly affected by the spill, an estimated of 25,623 families exhibited health problems, such as rash, skin irritation, respiratory problems, nausea, diarrhea, and other symptoms linked to crude MCHM, according to the Centers for Disease Control and Prevention (7). It has been established that 4-MCHM damages DNA, with its metabolites being more toxic as a result of their potential to cause greater oxidative stress (8). It has also been shown that low levels of 4-MCHM can be cytotoxic when paired with PPh, with concentrations as low as 1.28 µg/L 4-MCHM and 1.52 µg/L PPh (9). It is thus important to develop analytical methods able to quantitate the components of crude MCHM, as well as the associated metabolites, so as to monitor long term accumulation and release of these contaminants in environmental waters. Previous studies employed liquid–liquid extraction (LLE), coupled with gas chromatography with flame ionization detection (GC–FID) (10), or mass spectrometry (GC–MS) (11). Also, headspace (HS) sampling coupled with GC–FID (2,12), purge and trap (P&T) with GC–MS (6), and headspace solid-phase microextraction (HS-SPME) with GC–MS (13) have also been used to detect 4-MCHM only, given that other components of crude MCHM contribute less in the leaked mixture. In light of new toxicological data (8,9), accompanied by a lack of adequate research on the toxicology and sorption behavior of the minor constituents of crude MCHM, we herein propose quantitative methods for analysis of 4-MCHM and all associated compounds, including a primary metabolite of 4-MCHM, trans-4-methyl-1-cyclohexanecarboxylic acid (MCHCA) (14). The goal of this study is to quantitate, for the first time, all known components of crude MCHM, comparing the efficiency of various extraction approaches across different methods. The methods developed in this study utilized solid-phase extraction (SPE), direct immersion solid-phase microextraction (DI-SPME), and direct immersion thin film microextraction (DI-TFME). Each method employed GC–MS for separation and detection. SPE is a sample preparation technique commonly used in the analysis of environmental matrices, utilizing a solid-phase sorbent to exhaustively extract and preconcentrate target analytes in the same procedure (15). SPME is a non-exhaustive sample extraction method accomplished by a supported solid-phase coating, sharing the same advantages as SPE, but with a geometry that allows ease of automation and direct desorption of the SPME device into analytical instrumentation (16). TFME differs in geometry compared to SPME, with the extraction phase being coated on a carbon-mesh film in contrast to the fiber geometry of SPME. The increased surface area of a TFME device compared to a SPME fiber allows it to achieve greater sensitivity, thus making it more suitable for multiresidue trace analysis in environmental matrices (17). Among the methods developed, TFME provided the best results in terms of throughput and limits of quantitation (LOQs) achievable. The TFME based method was thus used for analysis of tap, lake, and river water.
Experimental
Method and Apparatus
Reference standards of 4-MCHM, MMCHC, DM1-4CHC, and MCHCA were purchased from Sigma Aldrich (St. Louis, MO, USA), along with the internal standards toluene-D8, and methyl benzoate-D8. A standard solution of 4MMCH was obtained from Toronto Research Chemicals Inc (Toronto, ON, Canada) and 1,4-CHDM was purchased from Tokyo Chemical Industries Co., Ltd. (Tokyo, Japan). Buffer solutions with pH 4, 6, 8, 10 were purchased from Honeywell Specialty Chemicals (Seelze, Germany). Materials for SPE included Sep-Pak AC2 Plus short Cartridge (400 mg) from Waters (Milford, MA, USA), and Cole-Parmer 2 mL wide neck volumetric vial with PTFE/silicone lined cap (Vernon Hills, IL, USA). Disposable Falcon tubes (3, 10, and 50 mL) were obtained from Becton Dickinson and Company (Franklin Lakes, NJ, USA). HPLC grade water, methanol, and dichloromethane were bought from ThermoFisher Scientific (Fair Lawn, NJ, USA). SPME fibers were purchased from Supelco (Bellefonte, PA). Car/PDMS thin films were obtained from Gerstel (Linthicum, MD, USA). River and tap water samples were collected in glass containers, being completely filled to minimize headspace. The river sample was collected ~0.5 m below the water surface along the bank of the Ohio River located at Portsmouth, Ohio. The lake water was obtained from the west fork of Keuka Lake near Pulteney, New York, in Steuben County, approximately 10 m off shore. The lake water was collected in a plastic container ~1.5 m below the surface. Tap (drinking) water was obtained at a residence in Louisville, Kentucky. Samples were stored in their original containers at 4 °C until analysis. An Agilent 7890 B GC instrument hyphenated to a 5977 B single quadrupole mass spectrometer (Agilent Technologies, Santa Clara, CA, USA) and equipped with a DB-5ms column (30 m x 250 µm x 0.25 µm, Agilent Technologies), MultiPurpose Sampler, MPS, (Gerstel, Inc., Linthicum, MD, USA), a cooled injection system, CIS 4, (Gerstel, Inc., Linthicum, MD, USA) and a thermal desorption unit, TDU, (Gerstel, Inc., Linthicum, MD, USA) was used for analysis of the crude MCHM constituents. Ultrapure helium (99.999%) was used as the carrier gas at a flow of 1.5 mL/min for each method. For SPE and SPME analysis, the GC oven temperature was held at 50 °C for 2 min, then raised to 220 °C at a rate of 20 °C/min, then held at held 220 °C for 2 min. During TFME analysis, the GC oven was programmed at an initial temperature of 50 °C (held for 2 min), then raised to 290 °C at a rate of 20 °C/min, then held at 290 °C for 2 min. The mass spectrometer was used in electronic ionization (EI) mode at 70 eV with the MS source being set at 230 °C and the quadrupole at 150 °C, collecting full scan mass spectra. All data analysis was performed with Agilent Masshunter Workstation Quantitative Analysis software (Agilent Technologies, Santa Clara, CA, USA) for GC–MS. The response for each analyte was obtained as the sum of individual peak areas for trans and cis isomers, with exception of DM1-4-CHC and MCHCA.
SPE Protocol
The SPE extractions were conducted according to a modified-protocol based on EPA method 522 (18) before GC–MS analysis. SPE cartridges were first conditioned with 2 mL of dichloromethane. The cartridges were then equilibrated by passing 2 mL of HPLC grade methanol, followed by 10 mL of HPLC grade water through the cartridge. Throughout the equilibration step and onward, care was taken not to allow the cartridges to come to dryness during solvent exchange and sample loading. For extraction, 18 mL of each aqueous solution spiked with the targeted analytes was loaded onto the SPE cartridge. Any water residues was removed from the cartridge by purging it with high purity argon gas for 3 min until dryness. A 2 mL volumetric vial was used for collection of the eluate. Elution of the analytes was performed with the addition of dichloromethane to the cartridge. During this step, dichloromethane was initially used to soak the SPE cartridge for 1 min. Elution then proceeded in a dropwise fashion into a volumetric vial. Additional dichloromethane was added to the cartridge until the eluted volume in the vial was 1.5 mL.
To eliminate residual water in the eluate, 0.4 g of anhydrous sodium sulfate was added to each vial. The samples were sealed, and then stored in the refrigerator at 4 °C until GC–MS analysis.
SPME Protocol
The extraction efficiency of five commercially available SPME fibers, namely Carboxen/polydimethylsiloxane (Car/PDMS), divinylbenzene/Carboxen/polydimethylsiloxane (DVB/Car/PDMS), divinylbenzene/polydimethylsiloxane (DVB/PDMS), polyacrylate (PA), and polydimethylsiloxane 100 µm (PDMS), was assessed using a 100 µg/L aqueous solution containing the targeted analytes. Optimization of pH was performed using both Car/PDMS and DVB/Car/PDMS by adjusting the pH of the 100 µg/L aqueous solution containing the targeted analytes to pH 4, 6, 8, 10 using disodium hydrogen citrate plus sodium dihydrogen citrate plus sodium chloride buffer solution at pH 4, trisodium citrate-2-hydrate plus disodium hydrogen citrate buffer solution at pH 6, sodium chloride plus disodium tetraborate buffer solution at pH 8, and disodium tetraborate plus sodium hydroxide buffer solution at pH 10. The optimized SPME protocol consisted of 1 min incubation, followed by 30 min extraction, both performed at 65 °C and 300 rpm agitation speed. Desorption was performed for 10 min in splitless mode at 300 °C for Car/PDMS, 270 °C for DVB/Car/PDMS, 300 °C for PA, 270 °C for DVB/PDMS and 280 °C for PDMS. The conditions used for desorption prevented the occurrence of carryover of the analytes on the SPME coatings. Carryover was tested by re-desorbing the fibers immediately after the first extraction and desorption cycle and verifying the absence of peaks attributable to the targeted analytes in the obtained chromatograms.
TFME Protocol
Samples for TFME method optimization were prepared following the same procedures described for SPE and SPME to ensure direct comparison between extraction methods. During extraction, TFME devices were held in place by stainless steel pins penetrating the vial septum, with the thin films fully submerged in the sample solution. Samples were placed in a water bath at 65 °C for 5 min without agitation, and subsequently stirred at 900 rpm for 15 min by a magnetic stir bar placed in the vial. After agitation, the TFME device was quickly wiped, and then placed into a baffled glass desorption liner prior to insertion into the TDU. TDU parameters were first set at 30 °C, held at 30 °C for 0.5 min, raised to 270 °C at a rate of 700 °C/min, then held at 270 °C for 8 min, all performed in splitless mode at a 280 °C transfer temperature. Coupled to the TDU was a CIS 4, with an initial temperature of -50 °C, raised to a final temperature of 280 °C at 10 °C/s, then held at 280 °C for 3 min. Under the desorption conditions used for TFME devices, minimum carry over (<1%) was achieved for the targeted analytes.
Method Validation
The methods developed were validated with respect to linearity, precision, accuracy, and limits of quantitation (LOQs). Calibration curves were obtained for each target by plotting the signal ratio of the analyte and the isotopically labeled internal standards (A/Is) for various concentration levels (8 for the SPE protocol and 10 for the SPME and TFME protocols) in three independent replicates. Toluene-D8 was used as internal standard for the SPE method, while methylbenzoate-D8 was used for the SPME and TFME methods. Furthermore, three validation points selected within the linear range of each method were analyzed to assess precision and accuracy. LOQs were calculated as the lowest calibration point, with precision values lower than 20% and accuracy within 70–120%.
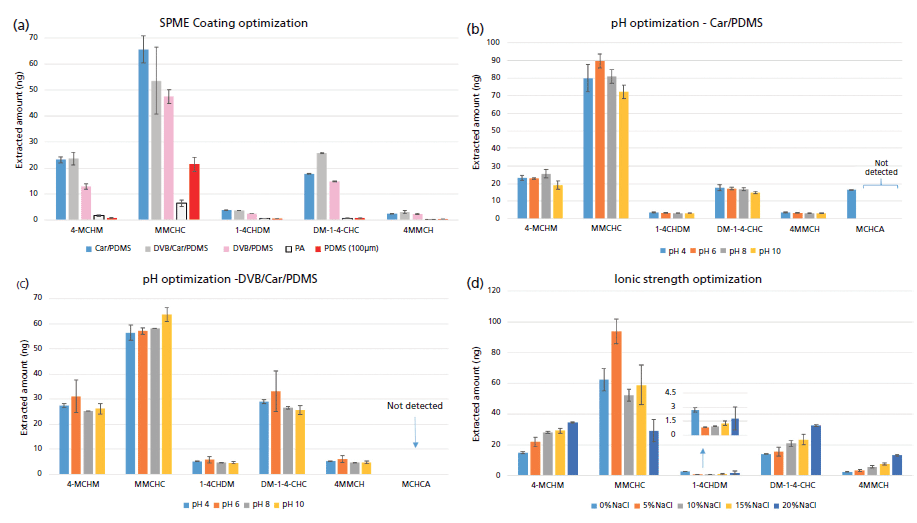
Figure 1: Optimization of SPME parameters including: (a) coating evaluation of five commercially available fibers; pH optimization using (b) Car/PDMS fiber and (c) DVB/Car/PDMS fiber; and (d) ionic strength optimization with Car/PDMS fiber.
Results and Discussion
SPME Optimization
Various parameters affecting SPME were optimized to achieve the most suitable conditions for extraction of the major components of crude MCHM and a metabolite of 4-MCHM, namely MCHCA. At first, we tested the extraction performance of 5 commercially available SPME coatings, PDMS 100 µm, PA, PDMS/DVB, Car/PDMS, and DVB/Car/PDMS in order to select the most suitable extraction phase. Results shown in Figure 1(a) reveal that the best performance was achieved with Car/PDMS and DVB/Car/PDMS. Considering that SPME coating optimization was performed before optimization of other parameters such as pH and ionic strength of the solution, it was not possible to achieve extraction of MCHCA (a carboxylic acid with pKa = 4.89). Consequently, Car/PDMS and DVB/Car/PDMS were both used to perform the optimization of matrix pH with the purpose of determining which of the coatings could best extract MCHCA. Figures 1(b) and 1(c) compare results obtained adjusting the pH of the aqueous solution at 4, 6, 8, and 10 pH units. The results demonstrate that MCHCA is most efficiently extracted by the Car/PDMS coating, which was selected for further optimization and method validation. Moreover, it was also noticed that adjusting the pH of the aqueous solution to 4 guaranteed simultaneous and best extraction of all the analytes targeted in this study. The next step was the optimization of the sample ionic strength. The adjustment of ionic strength was performed by adding opportune concentrations of NaCl to aqueous samples adjusted to pH 4. However, changes in ionic strength also resulted in variations of the final pH of the sample originally adjusted at 4. A similar effect was noticed by changing the type of salt (potassium nitrate and magnesium nitrate) used for ionic strengths adjustments. Therefore, we decided to perform two separate sample preparations: to extract MCHCA. The sample was adjusted to pH 4 with no adjustment of ionic strength; for the remaining analytes, the sample was kept at pH 7, adjusting the ionic strength to 20% with NaCl, per the results obtained in Figure 1(d).
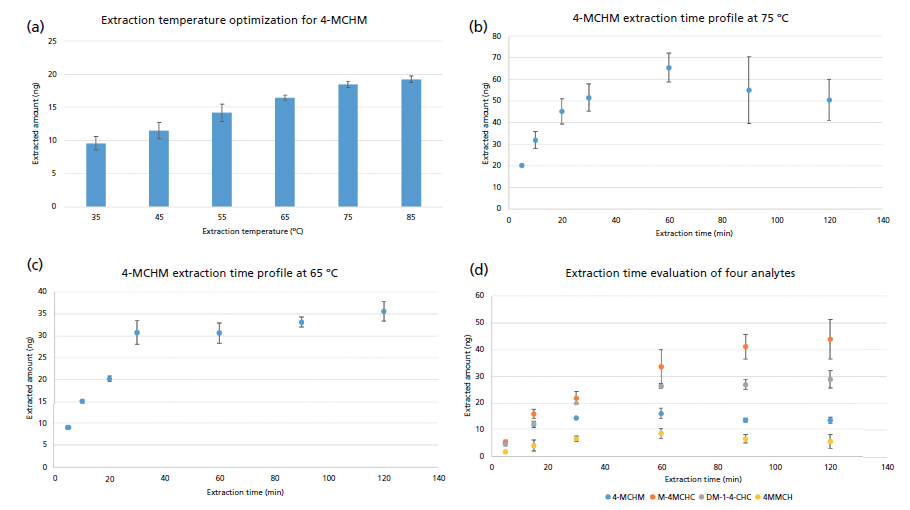
Figure 2: (a) Extraction temperature optimization for 4-MCHM. Extraction time profile of 4-MCHM at (b) 75 °C and (c) 65 °C. (d) Extraction time profile at 65 °C of four crude MCHM constituents.
Extraction temperature was also evaluated from 35 to 85 °C (Figure 2(a), representative results for MCHM). From the trend obtained, the best extraction performance was achieved at 85 °C. However, due to pressure built up in the vial with consequent partial deformation of the vial cap septum, 75 °C was selected as the optimum, since no pressure buildup occurred in the vial. While performing the extraction time profile for MCHM at optimized extraction conditions (pH 7, 20% NaCl content, 75 °C extraction), high variability of the measurements and a decline in the MCHM response over time were observed (Figure 2(b)). This indicates that a probable degradation of the analyte occurred under the used experimental conditions. To investigate if the extraction temperature were the main contributing factor to the trend observed, the extraction time profile was repeated at 65 °C, while keeping all the other parameters constant. As can be seen in Figures 2(c) and 2(d), good reproducibility was obtained with a reasonable trend for the equilibration process. Therefore, 65 °C was considered the optimum extraction temperature for further testing and validation. Moreover, 30 min extraction time was selected as the best compromise between analyte response and analysis throughput. In summary, the extraction conditions used for 4-MCHM, 4MMCH, MMCHC, 1-4CHDM, and DM-1-4-CHC were Car/PDMS SPME fiber, 30 min extraction time, 65 °C extraction temperature with the sample adjusted at pH 7 with 20% (w:w) of NaCl. For analysis of the MCHM metabolite MCHCA, the optimized extraction conditions were: Car/PDMS SPME fiber, 30 min extraction time, 65 °C extraction temperature, with the sample adjusted at pH 4 with no adjustment of the ionic strength of the solution.
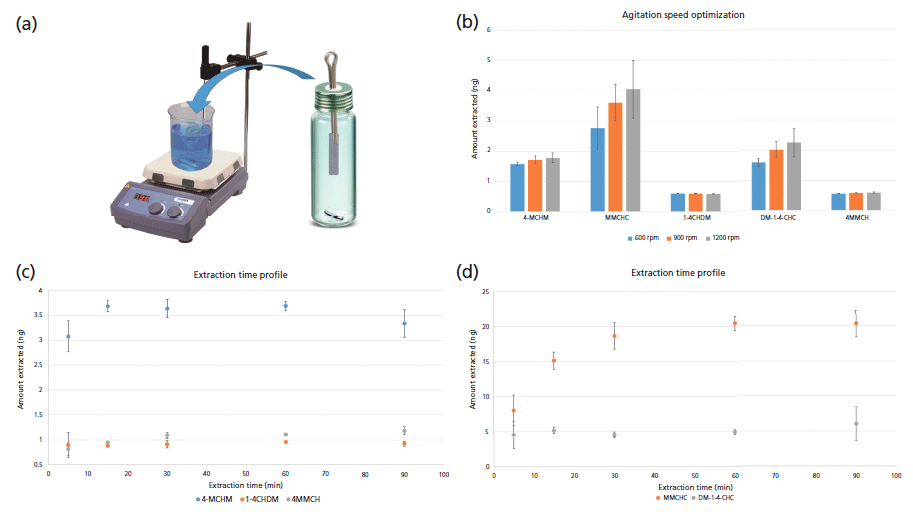
Figure 3: (a) Diagram of apparatus used for extraction procedures by TFME; (b) Agitation rate optimization; (c) Extraction time profile by TFME for 4-MCHM, 1-4 CHDM, and 4 MMCH; (d) Extraction time profile by TFME for MMCHC and DM-1-4-CHC.
TFME Optimization
During SPME optimization, it was determined that the extraction phase Car/PDMS was best suited for analysis of crude MCHM components. Consequently, we used a Car/PDMS TFME device for further method optimization and validation. Some of the optimized operating conditions, such as sample ionic strength, pH, and extraction temperature, are unaffected by the geometry of the microextraction device, and thus further optimization of these parameters for the TFME method was unnecessary. However, parameters such as extraction speed and extraction time required further optimization as extraction by TFME devices was not automated (Figure 3[a]). Moreover, the microextraction device geometry, as well the agitation method used, directly influence the kinetics of the extraction process. Figure 3(b) compares the extraction performance achieved at agitation speeds of 600, 900, and 1200 rpm during extraction, each experiment being performed at optimized conditions. Results show that at 1200 rpm extraction efficiency is the greatest, however, with greater variability compared to the comparably efficient 900 rpm; thus, 900 rpm was chosen as the optimal agitation speed. Using this new optimal agitation speed, figures 3(c) and 3(d) show the extraction time profile for the analysis of crude MCHM constituents by TFME using all optimized parameters. Obtained results clearly demonstrate that all analytes, with the exception of MMCHC, equilibrate at the optimal 15 min extraction time. MMCHC equilibrated soon after 15 min, however, considering its high affinity for the extraction phase, extraction was carried conveniently at 15 min for all the target analytes.

Figure 4: Comparison of signal obtained for 4-MCHC spiked at 0.25 µg/L for (a) SPME and (b) TFME methods.
Method Validation and Analysis of Real Samples
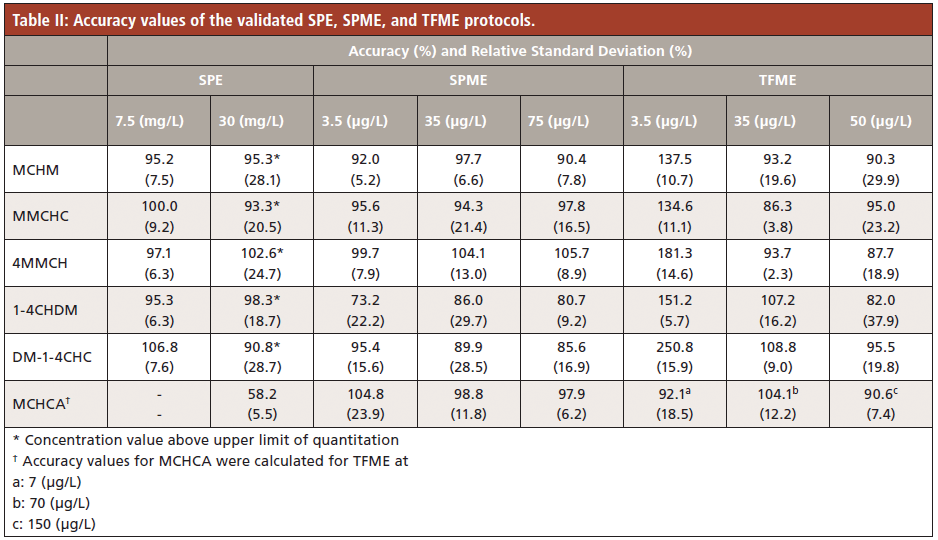
A summary of the results obtained from the method validation of the SPE, DI-SPME, and DI-TFME methods are presented in Table I. LOQs obtained with the SPE protocol were several orders of magnitude higher than the results of the other two extraction techniques tested, indicating that this technique is not suitable for extraction of crude MCHM constituents at trace level. Linear ranges of most compounds were very narrow, notably for MCHCA; some ranges spanned only one order of magnitude or less. SPME and TFME both circumvent the caveats of using SPE, with the two microextraction protocols exhibiting similar linear ranges and coefficients of determination. TFME recorded lower limits of quantitation than both SPE and SPME for most compounds (Table I) with comparable accuracy, except for the accuracy level at 3.5 ppb (Table II).

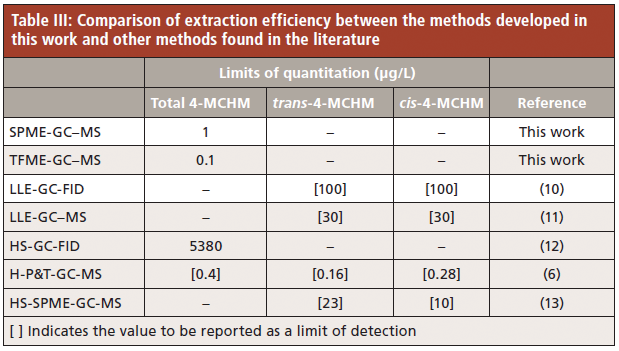
Further comparison with previously published work demonstrates that the microextraction methods developed in this study, in addition to being the first to simultaneously detect and quantitate all known components of crude MCHM, also quantitate 4-MCHM at concentrations at levels lower than any previous published method. These results are shown in Table III.
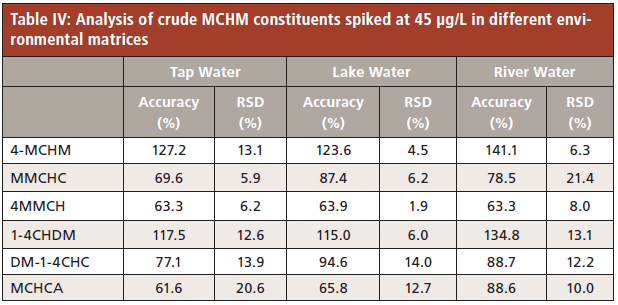
Compared to other extraction techniques evaluated in this study, TFME recorded lower limits of quantitation and better throughput; extraction times are shorter than SPME (15 min for TFME versus 30 min for SPME). Consequently, TFME was chosen as the best extraction protocol to follow for analyzing real matrices. Tap, river, and lake water samples were chosen to compare different possible matrices where 4-MCHM and its constituents might be detected. No detectable amount of the target analytes was discovered in the samples. Subsequently, each sample was fortified with the targeted analytes and tested for accuracy using the TFME method developed and validated as mentioned above. Results shown in Table IV reasonably validate the TFME protocol for analysis of real matrices for the contributing compounds of crude MCHM and one 4-MCHM metabolite, MCHCA.
Conclusions
For the first time, methods utilizing SPME and TFME were developed and optimized for simultaneous analysis of 4-MCHM and all other known components of crude MCHM. MCHCA, a primary metabolite of 4-MCHM, was also determined independently with only minor modifications to the sample preparation protocol. The performance of these microextraction-based analytical methodologies was compared to an SPE method that was also tested in this study. Our results show that lower limits of quantitation can be achieved with microextraction methods. Relating these results to previously developed methods, both SPME and TFME are competitive in detecting and quantitating 4-MCHM. The TFME-GC–MS method recorded a limit of quantitation for 4-MCHM lower than any currently known method, with only 15 min of extraction time needed. To validate this, water samples from various sources were analyzed using TFME and the accuracy of the method was determined. The sensitivity of the TFME method, coupled with its increase in analytical throughput, made it clear that TFME is the optimal extraction approach for 4-MCHM and its constituents found in crude MCHM.
Acknowledgments
This work was supported by funds provided by The University of Toledo. The authors are grateful to Gerstel USA, particularly to Dr. Robert Collins for enabling the use of Gerstel TDU unit in our laboratory, to Dr. John Stuff for the useful scientific discussions and for providing the TFME devices used in this work, and to Daniel Gatch for the expert technical support with the MPS autosampler and the TDU unit. The authors also thank Prof. Jon Kirchhoff and Daniel Gatch for providing the lake and tap water samples, respectively. Acknowledgements are also due to Rachel Avina, Elijah Long, and Tharuka Ubayasena for their assistance in the early stages of this work.
References
(1) Eastman Chemical Company, Crude MCHM- Safety Data Sheet version 3.1, 1–18 (2016).
(2) M. Ahart, D.L. Gallagher, P. Scardina, A.M. Dietrich, J. Environ. Eng. 142, 04016045 (2016). doi:10.1061/(ASCE)EE.1943-7870.0001116.
(3) West Virginia Division of Homeland Security and Emergency Management. Operation Log 18Jan1800 Initial, (2014). http://dhsem.wv.gov/Documents/SamplingResults/OPERATION LOG 18JAN1800 Initial.pdf.
(4) West Virginia Division of Homeland Security and Emergency Management. MCHM test results at 2 ppb, (2014). http://dhsem.wv.gov/Documents/SamplingResults/MCHM Test Results at 2ppb.pdf.
(5) A.J. Whelton, L.K. McMillan, M. Connell, K.M. Kelley, J.P. Gill, K.D. White, R. Gupta, R. Dey, C. Novy, Environ. Sci. Technol. 49, 813–823 (2015). doi:10.1021/es5040969.
(6) W.T. Foreman, D.L. Rose, D.B. Chambers, A.S. Crain, L.K. Murtagh, H. Thakellapalli, K.K. Wang, Chemosphere 131, 217–224 (2015). doi:10.1016/j.chemosphere.2014.11.006.
(7) Disaster Response and Recovery Needs of Communities Affected by the Elk River Chemical Spill, West Virginia. (U.S. CDC, Nation Center for Environmental Health, Division of Environmental Hazards and Health Effects; Health Studies Branch: Atlanta, GA USA, 2014). http://dhhr.wv.gov/News/2014/Documents/WVCASPERReport.pdf.
(8) J. Lan, M. Hu, C. Gao, A. Alshawabkeh, A.Z. Gu, Environ. Sci. Technol. 49, 6284–6293 (2015). doi:10.1021/acs.est.5b00371.
(9) A.A. Han, E.B. Fabyanic, J. V. Miller, M.S. Prediger, N. Prince, J.A. Mouch, J. Boyd, Environ. Monit. Assess. 189, 190 (2017). doi:10.1007/s10661-017-5895-5.
(10) J. Weidhaas, L.S. Lin, K. Buzby, Sci. Total Environ. 574, 1396–1404 (2017). doi:10.1016/j.scitotenv.2016.08.063.
(11) D.L. Gallagher, K. Phetxumphou, E. Smiley, A.M. Dietrich, Environ. Sci. Technol. 49, 1319–1327 (2015) . doi:10.1021/es5049418.
(12) T.S. Jeter, E.A. Sarver, H.M. McNair, M. Rezaee, Chemosphere 157, 160–165 (2016) . doi:10.1016/j.chemosphere.2016.04.125.
(13) I.M. Cozzarelli, D.M. Akob, M.J. Baedecker, T. Spencer, J. Jaeschke, D.S. Dunlap, A.C. Mumford, A.T. Poret-Peterson, D.B. Chambers, Environ. Sci. Technol. 51, 12139–12145 (2017). doi:10.1021/acs.est.7b03142.
(14) G. Speijers, A. Renwick, Alicyclic Primary Alcohols, Aldehydes, Acids, and Related Esters (WHO Food Additives Series: 50. 1997). http://www.inchem.org/documents/jecfa/jecmono/v50je10.htm.
(15) B. Buszewski, M. Szultka, Crit. Rev. Anal. Chem. 42, 198–213 (2012). doi:10.1080/07373937.2011.645413.
(16) N. Reyes-Garcés, E. Gionfriddo, G.A. Gómez-Ríos, M.N. Alam, E. Boyaci, B. Bojko, V. Singh, J. Grandy, J. Pawliszyn, Anal. Chem. 90, 302–360 (2018). doi:10.1021/acs.analchem.7b04502.
(17) Y.A. Olcer, M. Tascon, A.E. Eroglu, E. Boyaci, Trends Anal. Chem. 113, 93–101 (2019). doi:10.1016/j.trac.2019.01.022.
(18) J.W. Munch, P. Grimmet, EPA Method 522, Determination of 1,4-Dioxane in Drinking Water by Solid Phase Extraction (SPE) and Gas Chromatography Mass Spectrometry (GC/MS) with Selected Ion Monitoring (SIM), 2008.
Ronald V. Emmons, Amila M. Devasurendra, Nipunika H. Godage, and Emanuela Gionfriddo are with the Department of Chemistry and Biochemistry at the University of Toledo, in Toledo, Ohio. Direct correspondence to: Emanuela.Gionfriddo@utoledo.edu

New Method Explored for the Detection of CECs in Crops Irrigated with Contaminated Water
April 30th 2025This new study presents a validated QuEChERS–LC-MS/MS method for detecting eight persistent, mobile, and toxic substances in escarole, tomatoes, and tomato leaves irrigated with contaminated water.

.png&w=3840&q=75)

.png&w=3840&q=75)


.png&w=3840&q=75)


.png&w=3840&q=75)


