Trends in Sample Preparation, Part II: Sample Considerations and Techniques
In the October 2023 installment of “Sample Prep Perspectives,” we reported results obtained from a survey on sample preparation techniques, and compared those to results from previous surveys. The results uncovered trends in the field over the last generation and their impact in areas such as which technologies are currently being used, sample types, and sample load. This installment will continue our look at the sample preparation survey, focusing on sample sizes, laboratory techniques used, automation, the use of solid-phase extraction (SPE) devices (cartridges, disks, plates, tips), SPE chemistries and selection criteria, and problems encountered in SPE.
Periodically, LCGC International surveys readership concerning trends in sample preparation. Over the 30 years of this survey, several developments in the field have been uncovered. In the October 2023 issue, we discussed several of these developments (1). Here we discuss considerations with sample type and size, laboratory techniques, including solid-phase extraction (SPE).
Sample Considerations
Previously, we noted several trends regarding samples in the current survey (1). The survey showed an increase in the number of liquid samples analyzed, with a decrease in solid samples, and fewer sample types per laboratory. However, more samples per instrument per week are characterized, though whether this trend will continue is uncertain. We postulated that, combined with post-pandemic considerations, laboratories are becoming more selective in the types of analyses they perform. The top sample matrices reported included pharmaceutical and over-the-counter drugs, foods, water, soils, polymers, biomass, inorganics, metals, and fruits, vegetables, and grains.
Sample Sizes
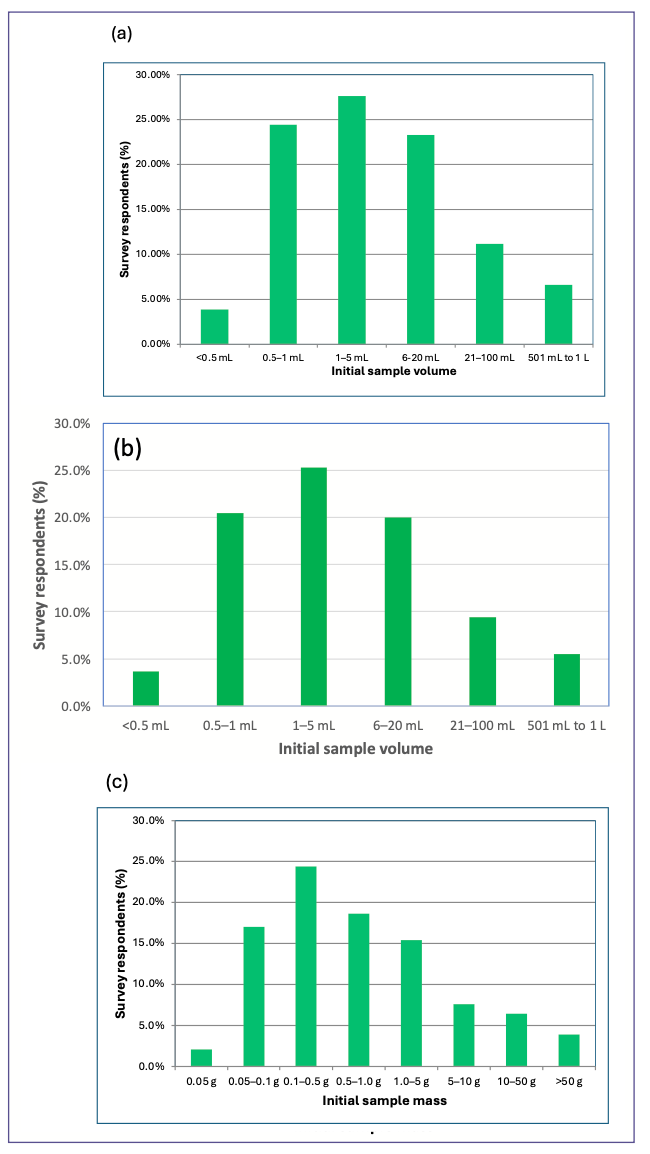
Continuing on the sample theme, it appears that sample sizes are getting smaller and analytes are less concentrated. The size distributions (masses and volumes) of different sample types are shown in Figure 1, and seems to reiterate the trend of fewer environmental samples, whose heterogeneity demands larger sample sizes. For liquid samples, just over three quarters (75.4%) of samples are between 0.5 and 20 mL. While only 3.9% of liquid samples are less than 0.5 mL (down from 14.4% a decade earlier [2]), 57.7% (normalized to exclude those who do not analyze liquids) are less than 5 mL, compared with 39.5% in 2013. Turning to gaseous samples, the initial sample size distribution is somewhat similar to that reported in 2016 (3), while most samples are less than 5 mL (58.6%, normalized), fewer samples less than 1 mL (28.6%) are noted compared to 2016 (38%). On the other hand, there are also fewer large samples. In 2023, only 6.5% of samples are greater than 500 mL, compared with over twice that many (14%) in 2016. Finally, with solid samples, about 10% more samples less than 1 g (65.1% in 2023 vs. 59% in 2016) are observed over the past seven years. However, for samples greater than 10 grams, we saw a significant decrease to 10.4% in 2023, compared with 17% in 2016.
FIGURE 1: Initial amounts (volume or mass) of (a) liquid, (b) gaseous, and (c) solid samples typically analyzed by survey respondents.
Sample Concentrations
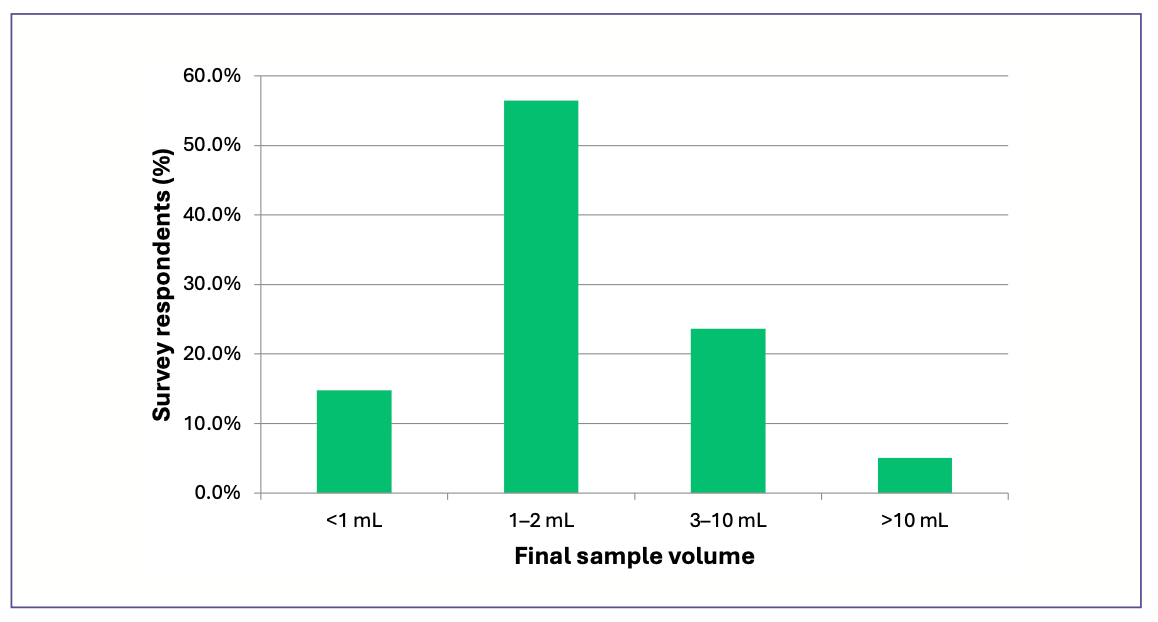
The trend in sample concentrations, the distribution from the 2023 survey is shown in Figure 2, skews toward trace levels of analyte. In 2023, nearly three-fourths of samples (71.8%) are less than one part per million, significantly greater than over the previous two decades (47% in both the 2013 and 2002 [4] surveys). Just over a third of samples, 35.6%, are in the 1–100 parts per billion range. One would think that sample concentration would help dictate the final sample volume prior to injection into a chromatograph, but this assumption is only partially correct. Over the past decade, the amount of samples at 2 mL or less (compatible with most standard autosampler vials) is fairly constant (71.3% in 2023, 68.7% in 2013). But the number of samples whose concentration is adjusted to less than 1 mL has dropped significantly, to 14.8% in 2023, compared with 38% in 2013 and 25% in 2002. The distribution of final sample dilutions from the 2023 survey is presented in Figure 3.
FIGURE 2: Initial sample concentrations typically analyzed by survey respondents.
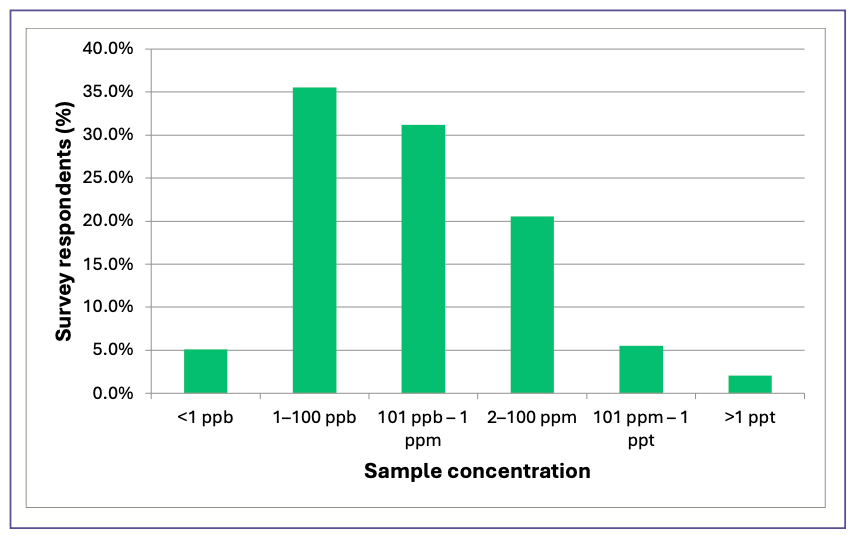
FIGURE 3: Distribution of final sample volumes prior to chromatographic injection reported by survey respondents.
Techniques Used
Laboratory Techniques
Before delving into sample preparation procedures used by survey respondents, we queried the techniques used in the laboratory. Results are shown in Figure 4. This question was also asked 10 years ago (2). In both surveys, respondents could select more than one answer (in 2023, respondents were limited to three selections, while 2013 had no restrictions). When normalized to the total number of responses, it appears that the number of techniques used in a given laboratory has decreased significantly, from 3.9 in 2013 to 2.7 in 2023. This is in line with our hypothesis that laboratories are becoming more specialized. The two most widely used techniques, each used in about a third of the respondent laboratories, are liquid chromatography-mass spectrometry (LC–MS) and gas chromatography (GC). Looking at the normalized data, some type of LC and some form of GC are of similar popularity and used in proportions similar to a decade ago; in 2023, 30.0% of respondents used some form of LC and 28.9% use some form of GC, compared with 33.3% (LC) and 28.4% (GC) in 2013. Ion chromatography (5.9% in 2023, vs. 7.7% in 2013) and size exclusion chromatography (4.4% vs. 5.6%) slightly dipped in popularity, while various forms of electrophoresis saw a small uptick (6.3% vs. 4.3%). This was the first year in which ultra-high pressure liquid chromatography (UHPLC) and headspace sampling (combined with GC) were queried in our survey and each of these techniques tallied use by about a quarter of respondents.
FIGURE 4: Laboratory techniques currently in use (yellow) and those reported in 2013 (grey) as a percentage of survey respondents.

Sample Preparation Procedures
Figure 5 turns to procedures specific to sample preparation. The survey results are interesting, and somewhat surprising, though they seem to support the observation of bioanalysis taking a higher priority than environmental analysis among amount survey respondents. First, we can see the widespread adoption of each of the surveyed techniques. In prior surveys, the lesser utilized techniques found use among about 10–15% of the most widely employed techniques. This year, the least frequently used technique was employed at a rate at least 50% of the most widely used technique. Next, for every technique queried, if not currently being used in a given laboratory, it is under consideration. Often those considering using these techniques exceeds those using them. Several techniques were queried for the first time in this year’s survey, namely cloud-point and coacervative extraction, QuEChERS (Quick, Easy, Cheap, Effective, Rugged, and Safe), β-glucuronidase removal, phospholipid removal, stir-bar sorptive extraction (SBSE), and protein precipitation. Each of these techniques are currently used by about a third of survey respondents, with another 40–50% contemplating their use. Three of these approaches (β-glucuronidase and phospholipid removal and protein precipitation) are used to remove biological macromolecules which interfere with LC–MS separations, perhaps leading to other problems like ion suppression. This is consistent with the support of bioanalysis and increased use of LC–MS over the past 10–20 years. It is also encouraging that newly developed techniques such as SBSE and QuEChERS are being readily adopted by the analytical community, as both of these techniques were introduced after the advent of this survey series, SBSE in 1999 (5) and QuEChERS in 2003 (6).
FIGURE 5: Sample preparation procedures currently in use (blue) or planned to use (red) by survey respondents.
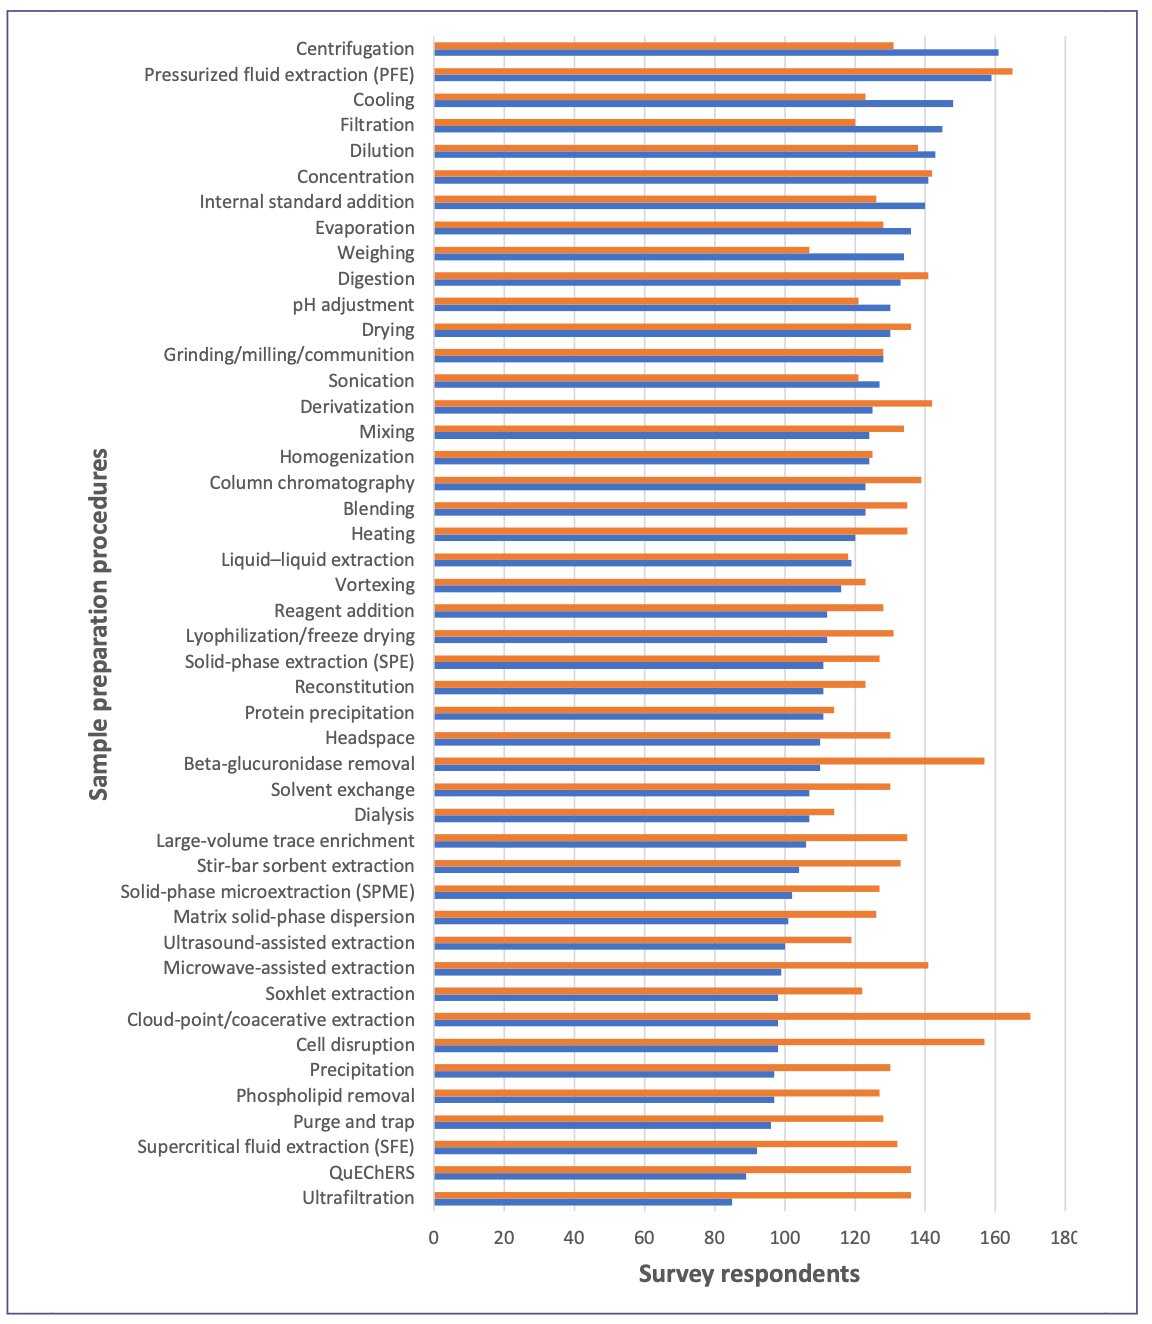
The biggest surprises in the trends in sample preparation procedures can be gleaned from Table I, which compares the ten most widely used procedures every ten years of the survey history. Historically, weighing, filtration, centrifugation, and internal standard addition are the most common sample preparation procedures. While this trend continues, notably, weighing dropped from its historic perch as the top s ample preparation procedure to ninth on the list. Meanwhile, centrifugation, which was in the ninth spot 20 years ago, is now the most common procedure. Cooling jumped from a less common procedure to the third most common, and digestion continues a steady climb up the list. Each of these techniques are more common to bioanalysis, reiterating our observation on the overall trend in chemical analysis practice.

A final surprise is concerns pressurized fluid extraction (PFE). Introduced by Dionex (now part of ThermoFisher) as accelerated solvent extraction in 1996 (7), subsequent to the beginning of this survey series, it has jumped from very low in usage to the second most common procedure. While there may be anomalies in this, or any, survey, PFE has demonstrated utility in a number of application areas and been accepted by regulatory agencies worldwide. In recent years updates and competitors to the original systems have emerged which may lead to more its widespread use.
Sample Loads
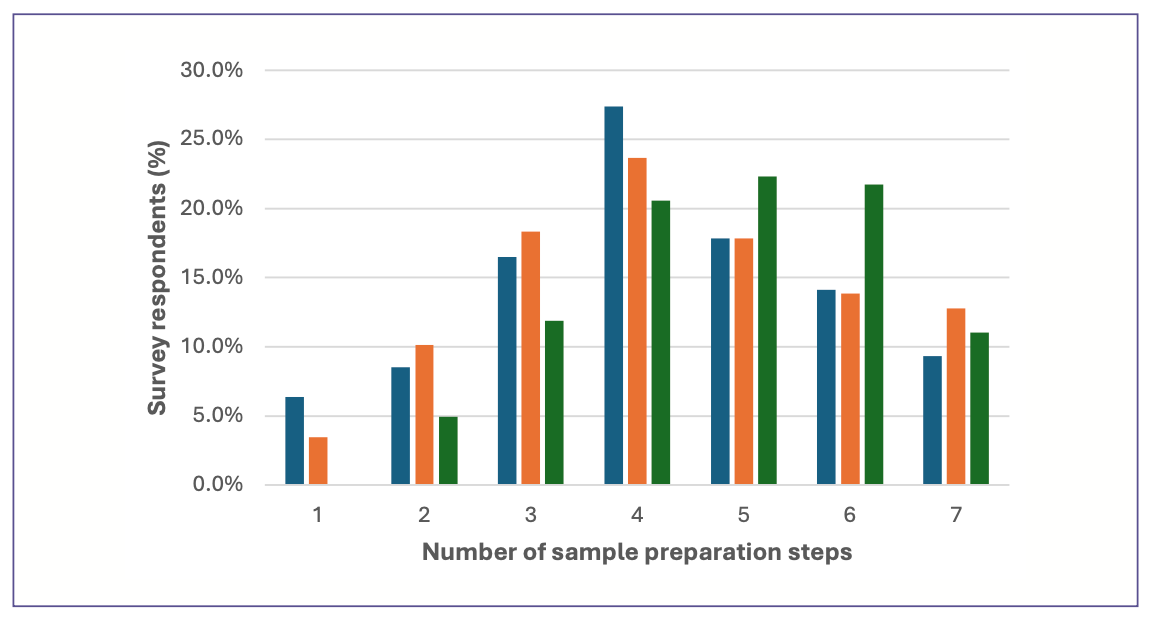
Apparently, laboratories are performing more sample preparation steps for each sample. This trend is shown in Figure 6. An average of 4.35 steps per sample was reported in this survey. This is an increase from previous years, as the 2002 survey reported 3.43 steps (4) and 2013 reported 3.10 steps per sample (2). This perhaps can be explained by looking at the steps involved in each sample type. Our survey found that solids averaged 4.2 sample preparation techniques per sample, up from 4.0 in 2016 (3), liquid samples increased from 3.4 techniques in 2016 to 4.3 in 2023, and gases jumped from 1.8 techniques in 2016 to 4.5 in 2023. The jump for gases was remarkable as, in 2016, no more than four steps were used in this analysis. Perhaps this may be attributed to determination of trace levels of environmental pollutants, off-flavors, and related samples.
FIGURE 6: Average number of sample preparation steps from raw sample to chromatographic injection reposted by survey respondents for solid (blue), liquid (red), and gaseous (grey) samples.
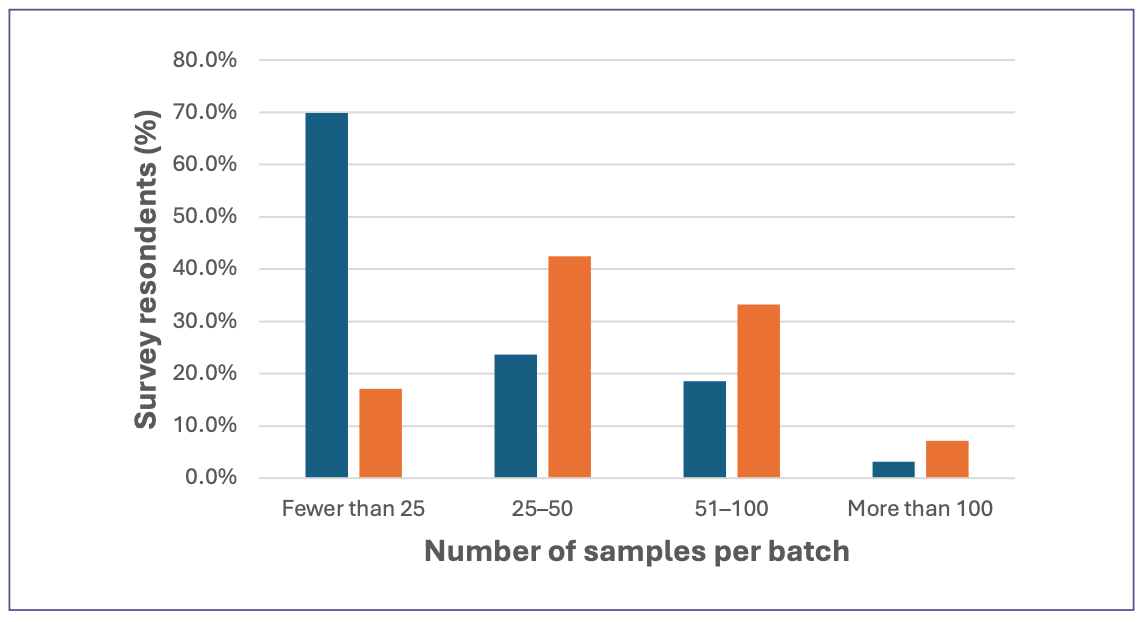
In Part I of our 2023 survey results (1), we reported an increased number of samples processed in analytical laboratories. This impacts how the samples are processed. Generally, samples are processed individually as needed (40.7% of samples) or batchwise (54.8% of samples); only 4.6% of samples are processed serially. This is unchanged since 2013 (2). However, what has changed is the size of batches processed in this manner. Figure 7 demonstrated the tremendous shift to larger size batches. A decade ago, essentially all samples (93.3%) processed as batches were in batches of 50 or less. Currently, 59.6% of samples are in batches of 50 or less, with more samples being processed in larger batch sizes.
FIGURE 7: Average number of samples per batch reported by survey respondents for sample prepared batchwise in 2013 (blue) and 2023 (red).
Automation
No more than about a quarter of the sample preparation procedures previously discussed are performed in an automated manner, according to survey respondents. But with the larger reported number of samples, the use of automation has increased dramatically, from 29% of respondents in 2013 to 39% in 2016 to 84% of current survey respondents. Additionally, 42% of respondents claim to be planning or considering use of automation in the coming year, up from just 15% a decade ago. This follows the survey finding that only 25% of respondents do not have the sample throughput to justify automation, down from 55% a decade earlier. Of those using automated sample preparation systems, nearly a third (32.4%) use an autosampler with sample preparation capabilities and a quarter (24.5%) use an automated solid-phase extraction (SPE) system. Lesser numbers of laboratories use a full laboratory robot (14.6%), an automated liquid handling system (12.3%), or an autosampler (9.1%).
Solid-Phase Extraction
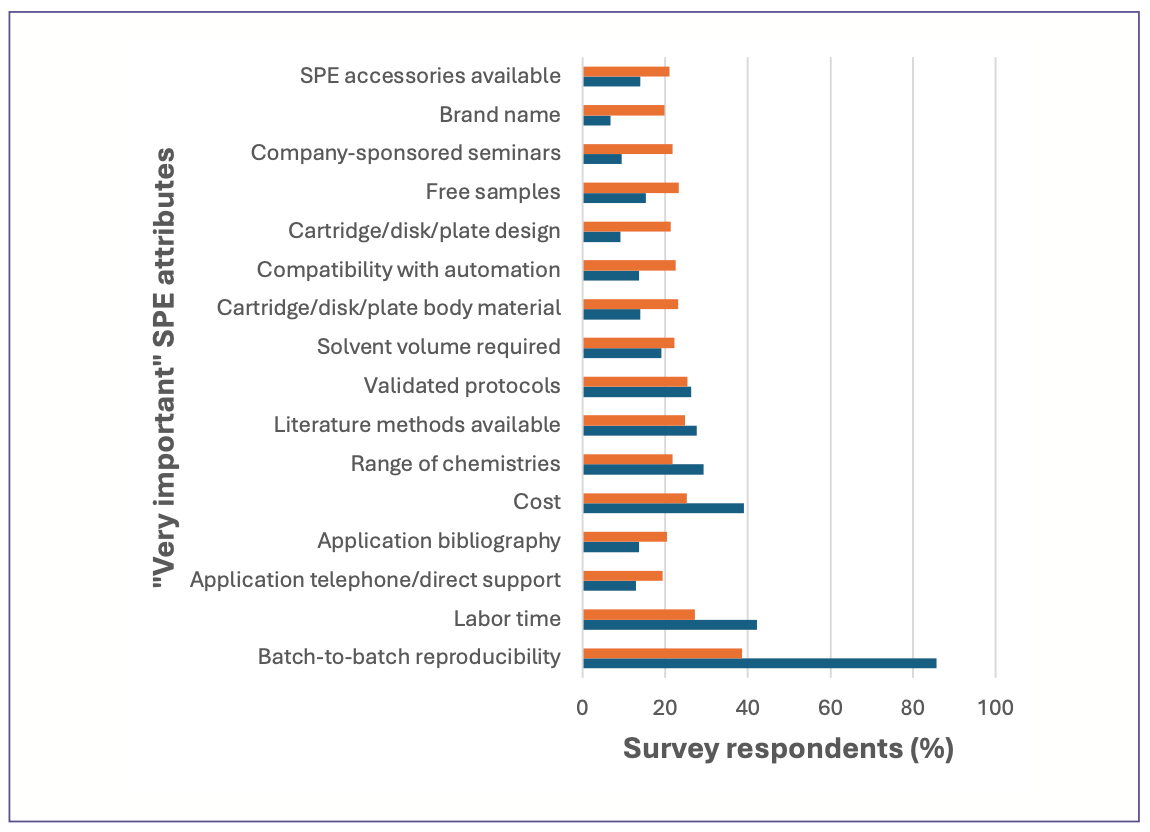
A large percentage (82.8%) of survey respondents use SPE and historically this survey has looked into trends in SPE. We continue exploring SPE trends with the current survey. While, based on previous surveys, it is highly likely that practitioners use more than one SPE format, this year’s survey showed a fairly even distribution of those using the traditional cartridge form of SPE (26.3%), the disk format (28.6%), and well plates (28.1%), with fewer using the pipette tip approach (15.5%). Of these formats, cartridge users prefer sorbent beds of 500 mg or less (71%), with 100-mg (31.2%) and 500-mg (29.1%) beds the most commonly used. Nearly 60% of those using SPE disks use 47-mm disks, with approximately equal number of users with either larger or smaller disk sizes. The SPE phases used are summarized in Figures 8 and 9, for silica-based and polymer-based sorbents, respectively. With silica-based SPE, a large dropoff in the use of octadecyl (ODS) is observed, perhaps offset by increasing use of octyl (C8) and sorbent functionalities which traditionally have seen little use, such as diol, amino, and butyl, among others. With polymer-based systems, use of neutral polymers has dropped off while ion exchange and application-specific columns have seen increased use, perhaps reflecting their utility across a broader pH range. When looking at users’ preferences in selecting SPE products, the trend in the past decade shows less discernment in which factors are considered “very important” in this choice (Figure 10), though batch-to-batch reproducibility remains the top factor, reflecting the major concern during the developmental stages of SPE and a lingering concern.
FIGURE 8: Silica-based SPE chemistries used, as reported in 2013 (blue) and 2023 (red).
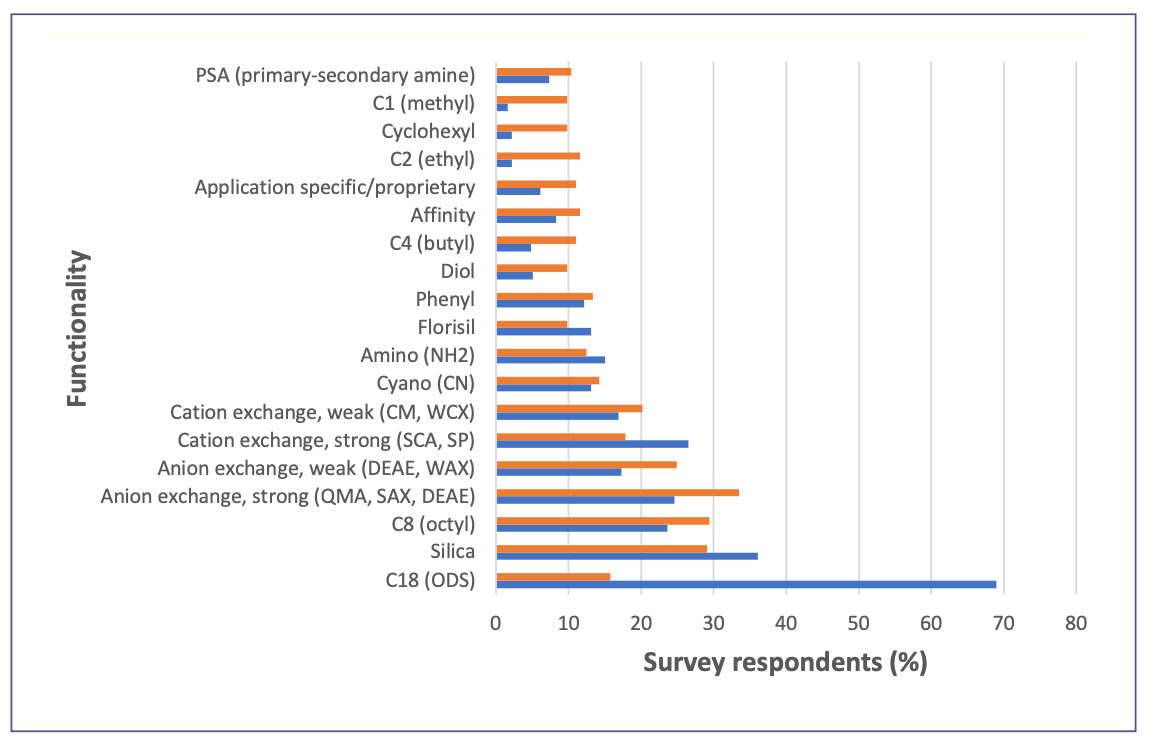
FIGURE 9: Polymeric-based SPE chemistries used, as reported in 2013 (blue) and 2023 (red).

FIGURE 10: SPE characteristics considered “very important” by survey respondents in 2013 (blue) and 2023 (red).
Future Directions and Conclusions
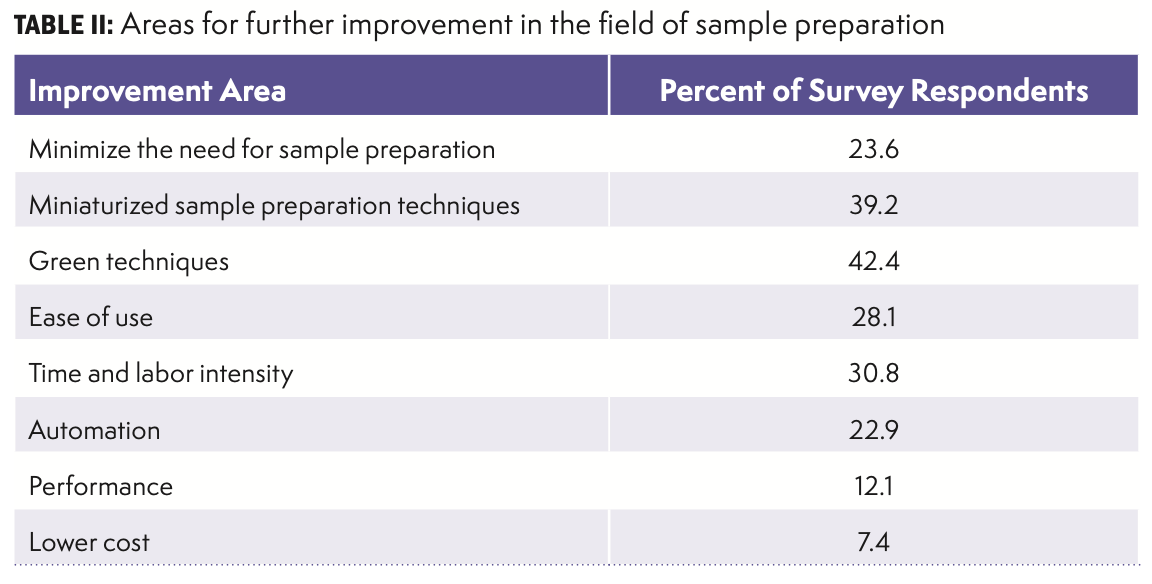
This year’s survey asked readers, “As the field of analysis and sample preparation continues to evolve, which of the following would you like to see further developed?” The results are shown in Table II. The top two desired features are the development of green or miniaturized techniques, trends which have taken increasing prominence in recent years. Other concerns (including ease of use, time and labor intensity, performance, and cost) follow from the most frequently identified problems with sample preparation reported previously (1). Meanwhile, respondents were asked to identify up to three emerging technologies that may become commonplace in the next five years. Not surprisingly, primary among these are green approaches to sample preparation, namely greener solvents and solventless methods and recycling solvents, reagents, and materials. Other emerging technologies identified are use of three-dimensional printing, flow injection, nanoparticle technology, and vacuum heating.
Over the past thirty years, LCGC has polled readership concerning trends and practices in the area of sample preparation. In this two-part summary of the 2023 survey, we see the shift to bioanalysis as the driving force of new practices. Concern over green chemistry and sustainability is rising to the forefront and will force new developments in the near-term future of the field.
References
(1) Raynie, D. E. Trends in Sample Preparation, Part 1: Current State of the Field. LCGC N. Am. 2023, 41 (9), 374–380, 393. DOI: 10.56530/lcgc.na.tu5672b5
(2) Majors, R. E. Trends in Sample Preparation. LCGC 2013, 31 (3), 190–202.
(3) Raynie, D. E. Trends in Sample Preparation. LCGC 2016, 34 (3), 174–188.
(4) Majors, R. E. Trends in Sample Preparation. LC-GC 2002, 20 (12), 1098–1113.
(5) Boltussen, P. Sandra, F. David, C. A. Cramers. Stir Bar Sorptive Exraction (SBSE),A Novel Extraction Technique for Aqueous Samples, Theory and Principles. J. Microcol. Sep. 1999, 11 (10), 737–747.
(6) Anastassiades, M.; Lehotay, S. J.; Stajnbaher, D.; Schenck, F. J. Fast and Easy Multiresidue Method Employing Aetonitrile Extraction/Partitioning and “Dispersive Solid-Phase Extraction” for the Determination of Pesticide Residue in Produce. J. AOAC Int. 2003, 86 (2), 412–431. DOI: 10.1093/jaoac/86.2.412
(7) Richter, B. E.; Jones, B. A.; Ezzell, J. L.; Porter, N. L.; Avdalovic, N.; Pohl, C. Accelerated Solvent Extraction: A Technique for Sample Preparation. Anal. Chem. 1996, 68 (6), 1033–1039. DOI: 10.1021/ac9508199
About the Author
“Sample Prep Perspectives” editor Douglas E. Raynie is Professor Emeritus at South Dakota State University. His research interests include green chemistry, alternative solvents, sample preparation, high-resolution chromatography, and bioprocessing in supercritical fluids. He earned his PhD in 1990 at Brigham Young University under the direction of Milton L. Lee. Raynie is a member of LCGC’s editorial advisory board. Direct correspondence to: LCGCedit@mmhgroup.com

Thermodynamic Insights into Organic Solvent Extraction for Chemical Analysis of Medical Devices
April 16th 2025A new study, published by a researcher from Chemical Characterization Solutions in Minnesota, explored a new approach for sample preparation for the chemical characterization of medical devices.
Study Explores Thin-Film Extraction of Biogenic Amines via HPLC-MS/MS
March 27th 2025Scientists from Tabriz University and the University of Tabriz explored cellulose acetate-UiO-66-COOH as an affordable coating sorbent for thin film extraction of biogenic amines from cheese and alcohol-free beverages using HPLC-MS/MS.
Multi-Step Preparative LC–MS Workflow for Peptide Purification
March 21st 2025This article introduces a multi-step preparative purification workflow for synthetic peptides using liquid chromatography–mass spectrometry (LC–MS). The process involves optimizing separation conditions, scaling-up, fractionating, and confirming purity and recovery, using a single LC–MS system. High purity and recovery rates for synthetic peptides such as parathormone (PTH) are achieved. The method allows efficient purification and accurate confirmation of peptide synthesis and is suitable for handling complex preparative purification tasks.

.png&w=3840&q=75)

.png&w=3840&q=75)


.png&w=3840&q=75)


.png&w=3840&q=75)
