An Efficient Procedure for Determining Simple Sugars in Fruit Juices
A fast, simplified procedure for determining simple sugars in fruit juices is described. Sample preparation has been generalized to allow for differences in the sample matrices. The use of an evaporative light scattering detector and a different separation column produces separations of fructose, glucose, sucrose, and maltose in less than three minutes, offering a significant improvement over standard methods. Part of the sample preparation can be automated further by using the programming features of many modern autosamplers.
The determination of simple sugars in food and food products is an important step in the production and marketing of these products to consumers. In the United States, current regulations require that manufacturers provide data on “total sugars” as part of the mandatory nutritional labelling (1). Analytical methods for these sugars (fructose, glucose, galactose, sucrose, maltose, and lactose) are not new, with methods appearing in the first books about high performance liquid chromatography (HPLC) (2). Early methods employed a variety of stationary phases, including silica, amino, ion exchange, hydroxylic, and other specialty phases. In combination with the appropriate mobile phase, many of these methods operated in hydrophilic interaction liquid chromatography (HILIC) mode. Detection required either refractive index (RID) or evaporative light scattering (ELSD) for use with the native molecules. Chemical derivatization allowed the use of more common detectors, such as absorbance or fluorescence, and it also added time and complexity to the procedure. Much of the early work on the separation of simple sugars and other carbohydrates has been reviewed and summarized by S. C. Churms (3). More recent method development efforts have focused on other detection options such as pulsed amperometric detection (PAD) (4) and mass spectrometry (MS) (5). Other recent reports have explored operating conditions, sample preparation, and sample types, with most studies using an amino or ligand-exchange column with either refractive index or light scattering detection (6–15).
Typical analysis times are 10 min or more. If information on disaccharides (such as, for example, maltose and lactose) and higher sugars is desired, the retention times on amino phases are even longer, as the retention is directly proportional to the number of sugar units. Current standardized methods used by many laboratories are similar to these procedures (16). Despite their popularity in published studies, most amino stationary phases suffer from reactivity and stability problems (17), resulting in constantly changing retention times and short column lifetimes. When coupled with refractive index detection, the user is further restricted to isocratic separations, resulting in lengthy equilibration and analysis times.
The hydroxylated phases, such as diol, offer better stability profiles but different selectivity toward carbohydrates. Reducing sugars exist in two anomeric forms, where the stereochemistry changes only at the anomeric carbon. These forms are slightly separated on the hydroxylated phases, causing peak splitting (17). Recent reports used a pentahydroxy phase and light scattering detection to produce much faster separations for a wider range of simple sugars and oligosaccharides (18–20). The present report describes using that same column under further optimized conditions to produce separations of four simple plant sugars (fructose, glucose, sucrose, and maltose) in fruit juices in only 3 min with a simpler mobile phase system. Sample processing has been evaluated and adjusted to improve applicability for matrix-specific challenges.
Materials and Methods
Reagents, Standards, and Supplies
Reagent grade (purity >99%) sugar standards (fructose, glucose, sucrose, and maltose) were obtained from Sigma-Aldrich Corporation. HPLC grade solvents (water and acetonitrile) were provided by Tedia, Inc. and Spectrum Chemicals, Inc. Ultra purity nitrogen was supplied by Airgas. The sample vials, syringe filters (0.2 µm nylon), and plastic filter vials (Thomson, 0.45 µm nylon) were ordered from Chrom Tech, Inc. The filter vial consisted of a bottom section and a top insert which contained the filter element. The total volumetric capacity of the unit was approximately 450 µL.
Equipment
All separation experiments were performed using an Agilent Technologies 1290 HPLC, which included a model G4220A binary pump, a G4226A high performance autosampler, a G1316C heated column compartment, a G4212A diode array, and a G4218A ELSD. Data acquisition, processing, and reporting were completed using the OpenLab ChemStation (version C.01.09). An Agilent 1100 system containing a G1312A binary pump and G1313A standard autosampler was programmed to perform sample dilutions (see “Processing Option 3”).
Samples
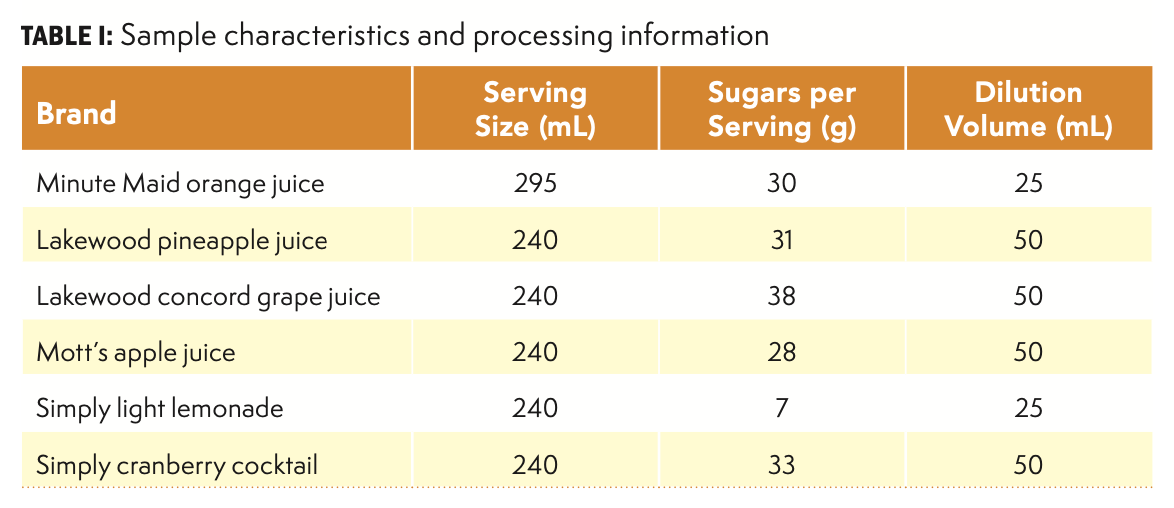
Juice samples were obtained from a local retail store. Brands and sugar content are summarized in Table I. These juice types were selected to represent a range of color, complexity, and sugar content.
Sample Preparation
Upon receipt, a 100 mL aliquot of each sample was centrifuged for 10 m at 5000 rpm (ThermoFisher ST8 Centrifuge). The supernatant was carefully transferred to a sealed plastic container and stored at approximately 4 °C when not in use. A measured volume (nominally one mL) of supernatant was measured into a Class A volumetric flask. Flask volumes of 25 mL and 50 mL were used, with the final choice depending on the expected sugar concentration (see Table I). Additional sample processing used one of three general options.
Processing Option 1
An additional volume of water, approximately equal to the volume of sample, was added to the flask with swirling. The desired volume of acetonitrile was then added directly to the flask. For example, if a level of 70% acetonitrile (v/v) was desired, approximately 17 mL was added to the 25 mL flask and approximately 35 mL to the 50 mL flask. Strict control of this volume was not necessary (see “Results” for more details). Following swirling to mix the solution, each sample was allowed to warm to room temperature because of the normal endothermic cooling that occurred when water and acetonitrile were mixed. Each solution was adjusted to its final volume using water. If significant foaming was observed, the final few drops used acetonitrile rather than water. A small aliquot was filtered directly into an HPLC vial and sealed immediately.
Processing Option 2
This option followed the same procedure as Option 1, except that the diluent was a premixed solution of acetonitrile and water. For example, a 70% (v/v) solution of acetonitrile:water would be added to the flask containing the sample and dilution water rather than adding the components separately. After partial dilution and equilibration to room temperature, the solution was adjusted to the final volume using the premix solution and filtered into a vial as in Option 1.
Processing Option 3
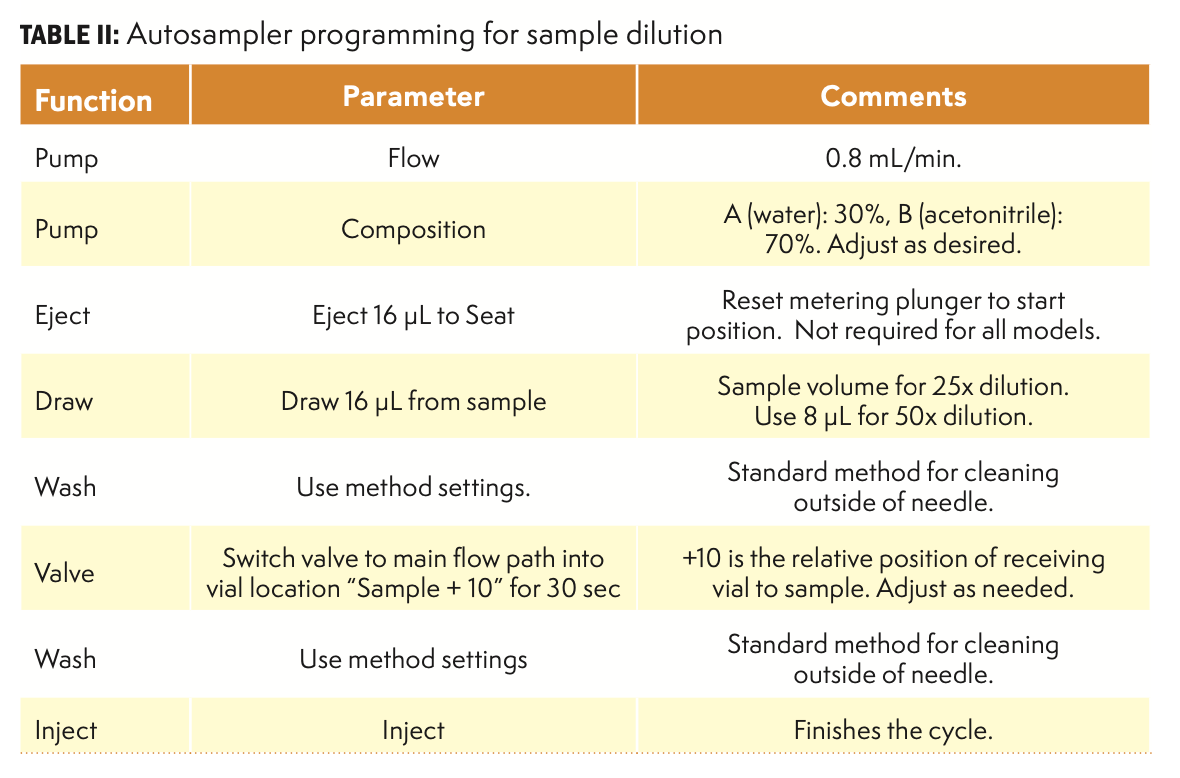
The sample supernatant solutions were loaded into the autosampler tray of the Agilent 1100 system. The base of the filter vial was placed at a specific location relative to the corresponding sample. For example, if the sample vials were loaded into locations 11–15, then the base units would be in positions 21–25, ten vial positions after each sample. The system was programmed to dilute all samples, as summarized in Table II. This general approach used the measuring capability of the autosampler to draw the sample and the flow accuracy of the pump to dilute the sample. The total volume of delivery was controlled by adjusting the flow rate and length of time that the autosampler directed the flow to the vial. Each cycle of this program produced one diluted sample and required approximately 2–3 m to complete. Following completion of this sample processing step, the top filter insert was pushed into the bottom section of the vial, causing the diluted sample to be filtered into the upper section of the vial. All vials were then transferred to the analytical autosampler for analysis. Additional information on this general dilution method is available from the author. This procedure is feasible on any systems that have the appropriate programming capabilities, but it is better suited to a standard HPLC system rather than a high pressure ultrahigh-pressure liquid chromatography (UHPLC) system because of the low operating pressures that result.
Preparation of Calibration Standards
Stock solutions of the four sugars were accurately prepared in water:acetonitrile (80:20 v/v) at 5 and 2 mg/mL levels of each compound. Subsequent dilution of these solutions in water:acetonitrile (50:50 v/v) produced a total of five calibration standards at nominal levels of 0.10, 0.20, 0.50, 1.0, and 2.0 mg/mL levels. A separate check standard was also prepared at approximately 0.50 mg/mL levels of each sugar. The smaller acetonitrile amounts in the initial stock solutions were necessary to ensure solubility of all components.
HPLC Conditions
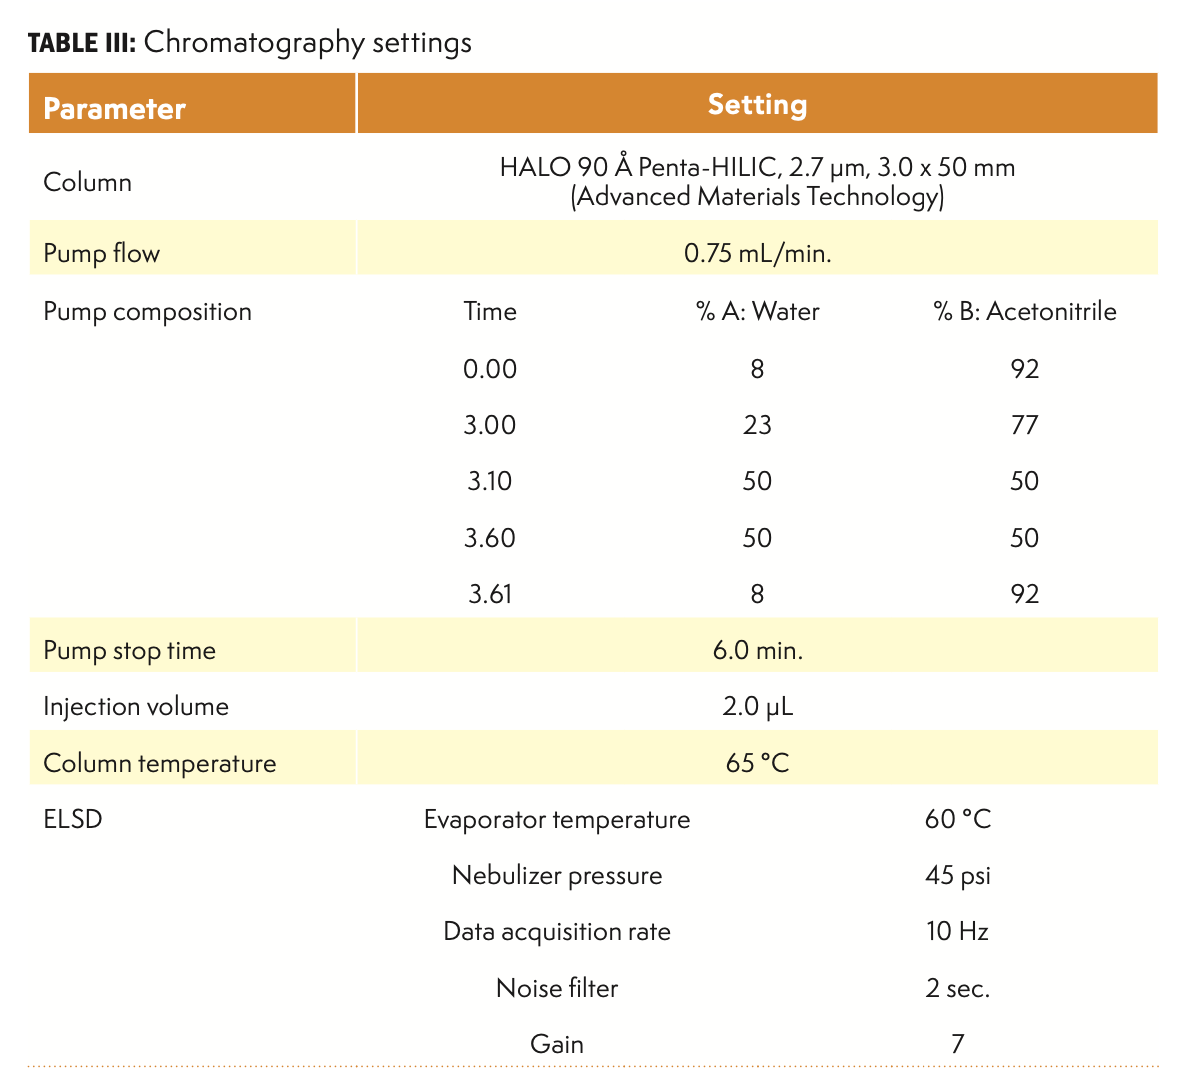
Table III summarizes the instrumental parameters for all separations. This separation is an example of a HILIC operating mode. Water is a strong solvent in this system, and it is programmed to larger concentrations during the main elution phase, followed by a cleaning step at 50% levels. Programmed cleaning is optional for samples, which are not expected to contain highly retained components such as proteins. The equilibration time here (from 3.6 to 6.0 min) is optimized for a typical UHPLC system, and other HPLC systems with larger system volumes may require longer equilibration times. The column temperature was chosen to minimize the separation of anomers. At lower temperatures, peak splitting was observed.
System Calibration
Calibration of the instrument was accomplished using duplicate injections of standards from 0.10 to 2.0 mg/mL. Evaporative light scattering detectors (ELSD) are known to produce nonlinear calibration curves. The data from this system required the use of a second order polynomial for the average peak areas, but the correlation coefficients (r2) for all compounds were greater than 0.999. Given the performance variability of modern ELSD instruments, other systems may require use of a different calibration range. The sample amount and dilution volume can then be adjusted as needed to produce final solutions within the calibrated concentration range.
Analysis of Samples
Samples were analyzed by duplicate injections of a single preparation. Multiple preparations were not needed because of the inherent homogeneity of liquids and the observation that the primary source of variability was related to the detector’s response rather than the sample preparation procedure. Each sample set included injection of a process blank and a check standard (0.50 mg/mL calibration standard or separate check sample) before and after the sample injections. Analysis results were only acceptable if check standard concentrations were within ten percent of the expected value.
Results
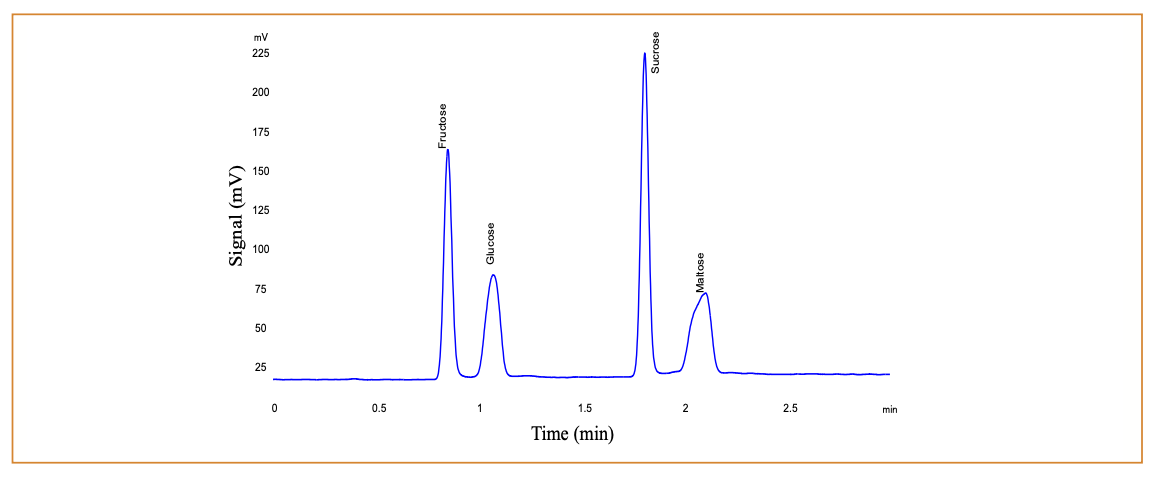
The Halo Penta-HILIC column was chosen for this work because it produced high efficiency separations in a short time, typically generating 10,000 theoretical plates with a 50-mm length. The bonded phase consisted of a penta-hydroxy five carbon phase attached to a superficially porous particle (SPP) with a diameter of 2.7 µm. These particle types are similar in performance to sub-2-µm fully porous particles (FPPs), but generate significantly lower pressures and can be used on typical HPLC instrument with a 600-bar pressure limit. Additionally, this phase did not suffer from the stability problems associated with bonded amino phases. Previous work with the Penta-HILIC phase in this laboratory established gradient elution conditions for separating oligo- and polysaccharides. Those conditions were adjusted to stop the gradient after elution of the disaccharides, resulting in a 3-min gradient program as described above. Retention times for fructose, glucose, sucrose, and maltose were approximately 0.85, 1.05, 1.8, and 2.1 min, respectively. Figure 1 is an example of a typical chromatogram. Note that fructose, glucose, and maltose are reducing sugars and exist in two anomeric forms. In these anomers, the stereochemistry changes at the anomeric carbon, which is the carbon containing the carbonyl functional group (aldehyde or ketone) in the open form of the sugar. These anomers are slightly separated on this column phase, but the peaks coalesce at higher operating temperature. Still, the presence of the anomers is evident from the increase in peak width and small peak shape distortions for these sugars, when comparing to sucrose, which does not have anomeric forms.
FIGURE 1: Typical chromatogram of 0.50 mg/mL calibration standard.
The total gradient cycle time was approximately 6 min for a standard UHPLC system. Transferring to a traditional HPLC with a larger system volume would probably require more time for column equilibration, but the additional time should keep the total analysis time under 10 min. Compare this situation to the many literature references above, where the analytes were eluted at 10 min or later.
Optimization of Sample Diluent
In traditional reversed-phase (RP) methods, water is a weak solvent, and direct injection of a filtered aqueous solution is highly advantageous. In HILIC mode, however, water is a strong solvent and direct injection of aqueous solutions can produce peak shape problems (17).
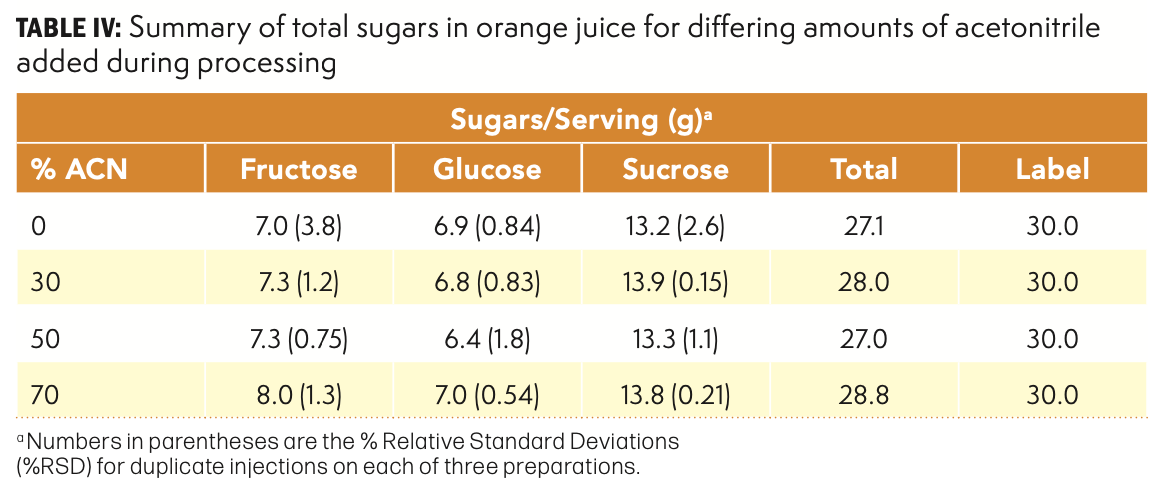
The influence of different amounts of acetonitrile on both peak shape and analysis results for orange juice was evaluated over a range from 0 to 70% (v/v) acetonitrile, using Processing Option 1. Results are summarized in Table IV, including data for individual sugars and total sugars, on a per serving basis. All values for total sugars were within 10% of the nutrition label claim, indicating that the overall procedure produced appropriate results. The lack of a clear trend across these experiments also suggests that the amount of acetonitrile does not appear to be a critical experimental variable. Such results allow the method to be adjusted as needed for a particular sample to improve processing or remove interferences. The general experience in this laboratory for a wide range of samples indicates that the filtration resistance and solution clarity can vary with differing amounts of acetonitrile, and the ability to adjust that processing variable without altering the analytical results is a significant advantage for this procedure.
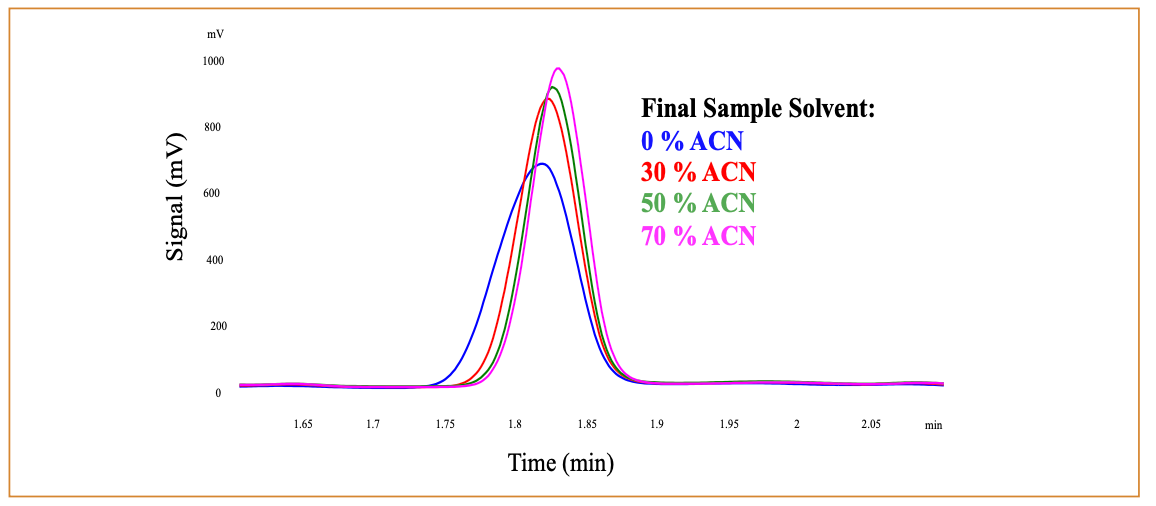
The impact on peak shape is another consideration when evaluating this experiment. Figure 2 provides an excellent illustration of the impact that sample solvent composition has on peak shape in a HILIC system. Although the general separation is unchanged, there are subtle differences that become apparent when looking closely at any individual peak. The all-aqueous injection has a reduced retention time, and the peak width is noticeably wider. In addition, peak fronting is observed. Such observations are expected when the sample solvent is significantly stronger than the mobile phase. As noted in the previous paragraph, the analytical results are not affected by this change in sample solvent, so the user may decide that the reductions in peak shape and resolution are not more important than the increased cost and time associated with the addition of acetonitrile during processing. On the other hand, if chromatographic interferences are present or other problems are observed during processing, the use of acetonitrile in the sample solvent may be warranted. A secondary benefit of adding acetonitrile is the opportunity to precipitate other sample components, such as proteins, that might otherwise remain on the column, resulting in earlier column failure.
FIGURE 2: Typical chromatography for sucrose in orange juice when the amount of acetonitrile in the final sample solvent is varied. In this region of the separation, the amount of acetonitrile in the mobile phase varies from 92% to 77%.
All other results presented here used 70% acetonitrile in sample processing, as it produced the best combination of peak shape, visual sample clarity, and filtration resistance for this type of samples. Clearly, other sample types may require a different optimum concentration, and the user should strongly consider at least a preliminary evaluation during method development.
Analysis of Juice Samples
Six juice samples obtained from a local retailer were analyzed using Processing Option 1 with 70% acetonitrile. No unusual problems were observed, and all dilutions were easily filtered prior to analysis. The results are summarized in Table V. This group of samples represented a range of total sugar content as well as the relative amounts of individual sugars. At least two sugars were present in all samples, and the amounts of each varied as expected. Maltose was not found in any of these samples. In each case the calculated value for total sugars was close the label claim for all samples. Given the inherent variability in food products and regulatory labelling requirements, it was expected that the measured values would likely be somewhat lower than the label claim. The analysis results were generally in agreement with the label, except for grape juice, which was somewhat higher.
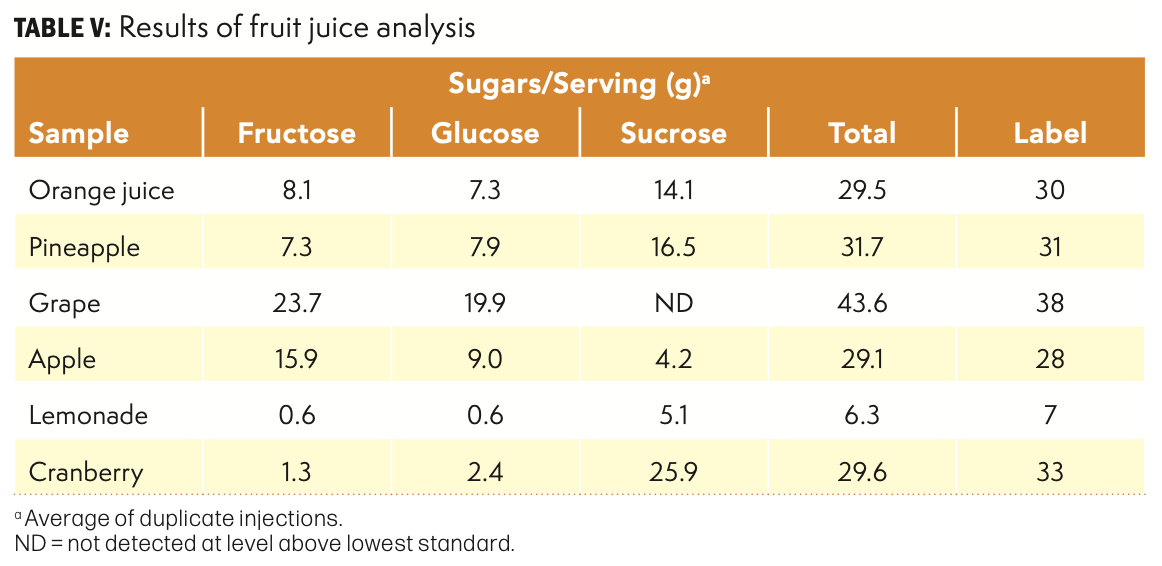
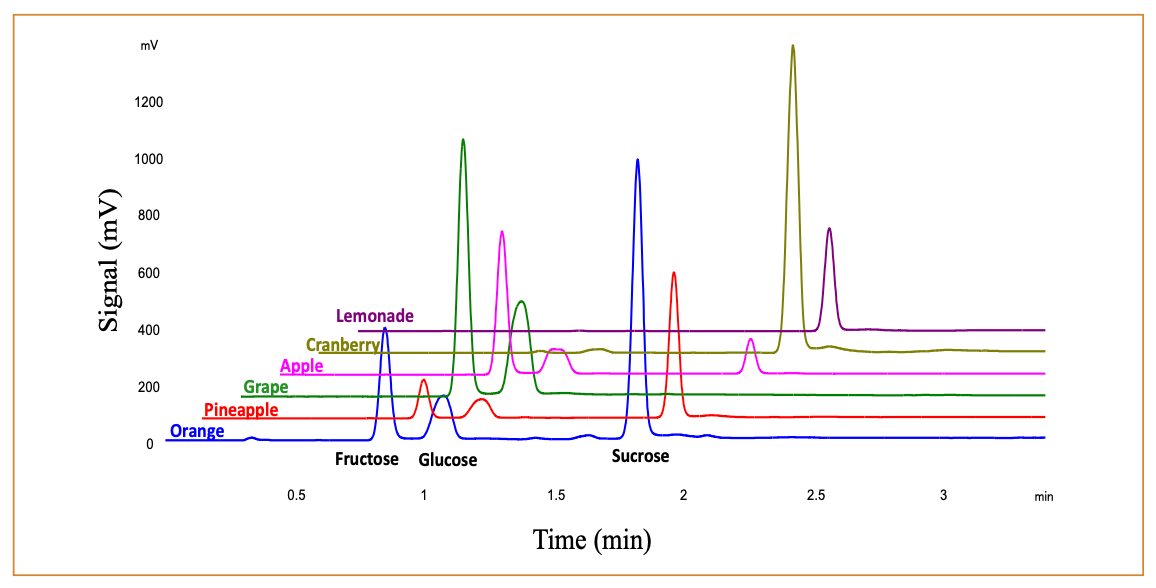
Figure 3 displays typical chromatographic results for fruit juices. In these samples, no unknown peaks interfered with fructose and glucose. Some small peaks were observed just after the sucrose peaks and careful review of retention times and peak shape was necessary to ensure proper peak identification and construction of the integration baselines. Experience in this laboratory for a wide variety of sugar-containing drinks suggested that interferences were the exception, not the rule. Of course, more complex samples and actual food samples would likely require additional sample preparation; however, the current procedure provides a good starting point for method development with such sample types.
FIGURE 3: Chromatographic examples for fruit juices.
Automation of Sample Processing
With sample processing and analysis optimized, one final experiment explored the possibility of automating the sample processing step using a programming feature of many modern autosamplers. This procedure, outlined above as Processing Option 3, uses the pump and autosampler of an HPLC system to dilute a sample directly into an HPLC vial.
Modern HPLC autosamplers are capable of accurately drawing known volumes of samples into the needle and loop at volumes between approximately 2 and 100 µL. Meanwhile, the solvent delivery systems can deliver an accurate composition at a carefully controlled flow rate. Since the general sample processing steps in this method involved the simple dilution of a known volume of sample to another known total volume, this procedure could easily be programmed using the Injector Program feature of the software. The total solution was directed into the bottom section of the two-piece filter vial. After completion of the injector cycle, the top section of the filter vial was pushed into the bottom section, forcing the diluted sample into the top section while also filtering out particulates and precipitates. This vial was then immediately transferred to the analytical instrument and analyzed using the established method. A second set of samples was prepared manually for comparison, using Processing Option 2 (dilution with a pre-mixed water-acetonitrile solution). The results are summarized in Table VI.

An analysis of variance for the two data sets indicated no differences at the 95% level. Clearly, the automated procedure generated total sugar values that were not different from the manual method. However, the automated method required no additional volumetric glassware or pipettes and used much less total solvent than the manual method.
Limitations
Although the many advantages of this procedure have been outlined here, it is important to understand the limitations that also exist.
- This method was developed for fast analysis of four components in relatively simple matrices with no significant interference. As the sample becomes more complex, separation problems may arise which might require the use of alternative sample preparation, a longer gradient, or a longer column.
- Most ELSD instruments produce nonlinear calibration curves and require polynomial fits for proper calibration. Although there are no technical issues with using a nonlinear calibration equation if the model properly fits the data, some users are uncomfortable with this approach.
- Glucose and galactose are not well separated, and lactose and maltose are also not completely resolved. Thus, the analysis of dairy sugars is not going to provide a separate value for these components.
- Some sugar alcohols interfere with some of the sugars studied here. Ribitol, xylitol, and arabitol are only partially separated from fructose. Sorbitol, mannitol, and dulcitol co-elute with glucose and maltitol is only partially separated from maltose. Fortunately, the levels of these compounds are expected to be low in most fruit juices. If they are present at interfering levels, then changes to the gradient or column length will probably be necessary.
Conclusions
An HPLC-based method has been described that separates four common sugars in fruit juices in less than 3 min using a simple acetonitrile–water mobile phase, with a total run time of 6 min. The sample preparation procedures were generalized to allow variable amounts of organic solvent depending on the individual needs for the analysis. Furthermore, the processing and dilution scheme could be adjusted as needed to produce analyte concentrations within the range of the calibration system, and automation of this step was feasible. No significant interferences were observed in the six fruit juices.
Future Extensions of this Work
Previous experiments established a general procedure for analyzing some oligo- and polysaccharides, and that work will continue as an alternative to more laborious testing regimens. The general methodology approach that is outlined here has been successfully applied to other juices and drinks containing plant sugars (unpublished results), and extension to raw fruits and vegetables, and even some processed foods, should be successful. Of particular interest is the measurement of fermentable oligosaccharides, disaccharides, monosaccharides, and polyols (FODMAP). This group of compounds includes short-chain carbohydrates that are poorly absorbed in people with irritable bowel syndrome (IBS) and other digestive disorders (21). Foods that have higher levels of fructose compared to glucose can lead to gastric problems in susceptible individuals. The method described here can make that determination with a 6-min analysis.
Acknowledgments
The author thankfully acknowledges the support of Advanced Materials Technology for supplying columns and technical discussions, Agilent Technologies for providing equipment and software, and Aveka, Inc. for facilities support.
References
(1) Food and Drug Administration, Department of Health and Human Services, Subchapter B, Food for Human Consumption. Total Sugars; 21 CFR 101.9(c)(6)(ii).
(2) Snyder, L. R.; Kirkland, J. J. Introduction to Modern Liquid Chromatography, 2nd Ed. John Wiley & Sons, 1979; p 310.
(3) Churms, S. C. Recent Progress in Carbohydrate Separation by High-Performance Liquid Chromatography Based on Hydrophilic Interaction. J. Chromatogr. A 1996, 720 (1–2), 75–91. DOI: 10.1016/0021-9673(95)00306-1
(4) Vennard, T.R.; Ruosch, A. J.; Wejrowski, S. M.; Ellingson, D.J. Sugar Profile Method by High-Performance Anion-Exchange Chromatography with Pulsed Amperometric Detection in Food, Dietary Supplements, Pet Food, and Animal Feeds: First Action 2018.16. J. AOAC International 2020, 103 (1), 89–102. DOI: 10.5740/jaoacint.19-0193
(5) Rego, A.; Jesus, S.; Motta, C. et al. Quantification by LC-MS/MS of individual sugars in fruit juice consumed in Portugal. J. of Physics: Conf. Ser. 2018, 1065, 232004. DOI: 10.1088/1742-6596/1065/23/232004
(6) Kelebek, H.; Selli, S.; Canbas, A.; Cabaroglu, T. HPLC Determination of Organic Acids, Sugars, Phenolic Compositions and Antioxidant Capacity of Orange juice and Orange Wine Made from a Turkish cv. Kozan. Microchemical J. 2009, 91, 187–192. DOI: 10.1016/j.microc.2008.10.008
(7) Rodrigues, D. P.; Mitterer-Daltoe, M. L.; de Lima, V. A. et al. Simultaneous Determination of Organic Acids and Sugars in Fruit Juices by High Performance Liquid Chromatography: Characterization and Differentiation of Commercial Juices by Principal Component Analysis. Cienc. Rural 2021, 51 (3). DOI: 10.1590/0103-8478cr20200629
(8) Vlaic, R. A.; Muresan, A. E.; Muresan, C. C. et al. Quantitative Analysis by HPLC and FT-MIR Prediction of Individual Sugars from the Plum Fruit Harvested during Growth and Fruit Development. Agronomy 2018, 8, 306. DOI: 10.3390/agronomy8120306
(9) Petkova, Tr. N; Pascal, B. A.; Annick, M. et al. HPLC Analysis of Mono- and Disaccharides in Food Products. Food Science, Engineering and Technology Conf. 2013, 761–765. DOI: 10.13140/RG.2.1.1139.1840
(10) Odumosu, P. O.; Dayol, A. D. Determination of the Sugar Content in Fruit Flavoured Drinks by HPLC. J. Pharmacy & Bioresources 2015, 12 (2), 144–149. DOI: 10.4314/jpb.v12i2.9
(11) Rokai, N.; Sana, S. HPLC Analysis and Determination of Saccharides in Selected Fruit and Vegetable Juice. Int. Res. J. Eng. Tech. (Online) 2020, 7 (11), 101–107. https://www.irjet.net/archives/V7/i11/IRJET-V7I1117.pdf
(12) Tiwari, M.; Mhatre, S.; Vyas, T.; Bapna, A.; Raghavan, G. A Validated HPLC-RID Method for Quantification and Optimization of Total Sugars: Fructose, Glucose, Sucrose, and Lactose in Eggless Mayonnaise. Separations 2023, 10, 199–210. DOI: 10.3390/separations10030199
(13) Armoogum, V.; Boodhoo, K. Full Optimization and Validation of an HPLC Method for the Quantitative Analysis of Total Sugars in a Soft Drink. Bull. Chem. Soc. Ethiop. 2020, 34(2), 419–426. DOI: 10.4314/bcse.v34i2.17
(14) Montesano, D.; Cossignani, L.; Giua, L. et al. A Simple HPLC-ELSD Method for Sugar Analysis in Goji Berry. J. Chem. 2016, 6271808. DOI: 10.1155/2016/6271808
(15) Duarte-Delgado, D.; Navaez-Cuenca, C.-E. Development and Validation of a Liquid Chromatographic Method to Quantify Sucrose, Glucose, and Fructose in Tubers of Solanum tuberosum Group Phureja. J. of Chromatogr. B Analyt. Technol. Biomed. Life Sci. 2015, 975, 18–23. DOI: 10.1016/j.jchromb.2014.10.039
(16) Official Methods of Analysis of AOAC International 22nd Edition, Methods 982.14 and 996.04, 2023. DOI: 10.1093/9780197610145.001.0001
(17) Jandera, P. Stationary and Mobile Phases in Hydrophilic Interaction Chromatography: A Review. Anal. Chim. Acta 2011, 692, 1 –25. DOI: 10.1016/j.aca.2011.02.047
(18) Kubica, P.; Wasik, A.; Kot-Wasik, A. et al. An Evaluation of Sucrose as a Possible Contaminant in e-Liquids for Electronic Cigarettes by Hydrophilic Interaction Liquid Chromatography–Tandem Mass Spectrometry. Anal. Bioanal. Chem. 2014, 406, 3013 –3018. DOI: 10.1007/s00216-014-7690-2
(19) Crha, T.; Pazourek, J. Rapid HPLC Method for Determination of Isomaltulose in the Presence of Glucose, Sucrose, and Maltodextrins in Dietary Supplements. Foods 2020, 9, 1164. DOI: 10.3390/foods9091164
(20) Pazourek, J. Rapid HPLC Method for Monitoring of Lactulose Production with a High Yield. Carbohydr. Res. 2019, 484, 107773. DOI: 10.1016/j.carres.2019.107773
(21) Bellini, M.; Tonarelli, S. et al. Low FODMAP Diet: Evidence, Doubts, and Hopes. Nutrients 2020, 12 (1), 148. DOI: 10.3390/nu12010148
Merlin K. L. Bicking is with ACCTA, Inc., in St. Paul, Minnesota. Direct correspondence to: mbicking2@accta.com
Analytical Challenges in Measuring Migration from Food Contact Materials
November 2nd 2015Food contact materials contain low molecular weight additives and processing aids which can migrate into foods leading to trace levels of contamination. Food safety is ensured through regulations, comprising compositional controls and migration limits, which present a significant analytical challenge to the food industry to ensure compliance and demonstrate due diligence. Of the various analytical approaches, LC-MS/MS has proved to be an essential tool in monitoring migration of target compounds into foods, and more sophisticated approaches such as LC-high resolution MS (Orbitrap) are being increasingly used for untargeted analysis to monitor non-intentionally added substances. This podcast will provide an overview to this area, illustrated with various applications showing current approaches being employed.
Thermodynamic Insights into Organic Solvent Extraction for Chemical Analysis of Medical Devices
April 16th 2025A new study, published by a researcher from Chemical Characterization Solutions in Minnesota, explored a new approach for sample preparation for the chemical characterization of medical devices.

.png&w=3840&q=75)

.png&w=3840&q=75)


.png&w=3840&q=75)


.png&w=3840&q=75)
