Tips & Tricks GPC/SEC: Inter-Detector Delay
The Column
Combinations of detectors are often used in gel permeation chromatography/size-exclusion chromatography (GPC/SEC) to measure absolute molar masses or chemical compositions as a function of elution volume. Such multidetector setups require the correction of the delay volume between the detectors for correct data processing. This instalment of Tips & Tricks explains more.
Photo Credit: saicle/Shutterstock.com

Daniela Held and Wolfgang Radke, PSS Polymer Standards Service GmbH, Mainz, Germany
Combinations of detectors are often used in gel permeation chromatography/size-exclusion chromatography (GPC/SEC) to measure absolute molar masses or chemical compositions as a function of elution volume. Such multidetector setups require the correction of the delay volume between the detectors for correct data processing. This instalment of Tips & Tricks explains more.
Different detectors can be applied in gel permeation chromatography/size-exclusion chromatography (GPC/SEC) depending on the analytical task to be solved. Refractive index detectors (RID) or (less often) evaporative light scattering detectors (ELSDs) are used to measure the concentration of samples lacking chromophores. Ultraviolet (UV) detectors or diode array detectors (DADs) can be applied alone to determine the concentrations of UVâactive samples or in combination with RID to derive the chemical composition distribution of a sample. On-line viscometers or light scattering detectors are applied in conjunction with an RID or UV detector to calculate true molar masses or to derive structural information on the sample. The order in which the different detectors should be installed has already been covered in a previous instalment of GPC/SEC Tips & Tricks (1).
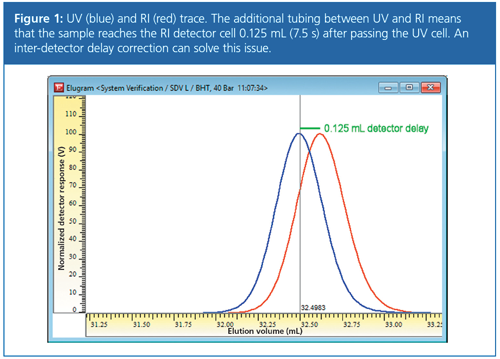
However, if several detectors are used either “daisy-chained” or in parallel, the sample fraction leaving the column will reach the detectors at different times. The difference in time (or volume) between the detectors is commonly referred to as interâdetector delay. Figure 1 shows an example of a setup with a UV detector (first detector) and an RI detector installed in series. The tubing between the two detectors means that the sample reaches the RI detector cell (red trace) 0.125 mL (equal to 0.125 min or 7.5 s at 1 mL/min flow-rate) after it has passed the UV cell (blue trace).
GPC/SEC software packages are often able to correct for this time and volume difference. This is of advantage for multidetector setups because it reduces the calibration efforts. For example, if the interâdetector delay is properly corrected for, all detector signals can be evaluated using the same calibration curve, while if the interâdetector delay correction is not supported by the software, separate calibration curves need to be established for each detector.
However, using separate calibration curves is not applicable if the desired results require correlating signal intensities of different detectors corresponding to the same elution volume. Typical examples are the determination of:
- absolute molar mass using light scattering or triple detection;
- structure parameters using viscometry, triple detection, or light scattering;
- chemical composition using dual detection;
- low-molecular-weight heparin according to the European Pharmacopoeia (Ph. Eur.).
In cases like these, the signal intensities of different detectors corresponding to the same GPC/SEC-slice are related to each other. A correctly determined inter-detector delay is therefore a prerequisite for such applications.
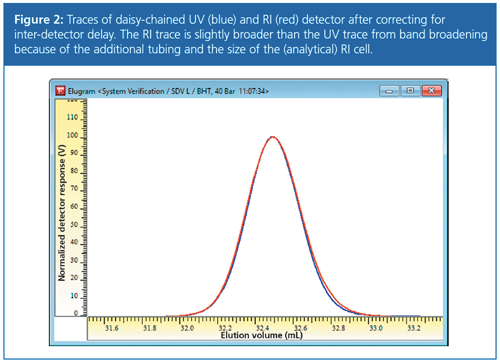
Figure 2 shows how the data from Figure 1 look after properly accounting for the inter-detector delay. The delay for the RI has been determined so that both detector traces overlay and the maxima of both signals match each other. Figure 2 also shows that the RI trace is slightly broader than the UV trace because of band broadening resulting from the additional tubing between the detectors and from the size of the RI cell.
How Can the Inter-Detector Delay Be Determined?
The most accurate and precise approach to determine the inter-detector delay is using a truly monodisperse substance, which yields sufficient signal intensities in all detectors used. This is easy for the vast majority of setups where only concentration detectors, such as RI and UV, are applied. In organic solvents, substances like butylated hydroxytoluene (BHT) or toluene can be used. In aqueous solvents, a protein (for example, BSA) or an amino acid might be suited to determine the inter-detector delay. If a truly monodisperse material is not available, reference materials with a narrow molar mass distribution can be used (2).
To determine the inter-detector delay the substance is run on the system without correction. The result should look similar to Figure 1. The volume difference between the peak maxima of detector trace 1 and trace 2 is the inter-detector delay. For detector setups with more than two detectors, an inter-detector delay of 0 mL is usually assigned to the first detector, and positive inter-detector delays, with respect to the first detector, are given to all following detectors. Simply using the elution volume difference of the peak maxima works nicely if truly monodisperse materials are available because the detector traces are directly related to the concentration profile of the material.
However, the situation is more difficult when molar mass sensitive detectors (light scattering or viscometer) are used. There are two aspects to be considered. First, monodisperse low molar mass substances, such as BHT, toluene, or an amino acid, will usually not provide sufficient signal intensities for molar mass sensitive detectors because of their low molar mass.
Since the signal intensity of molar mass sensitive detectors increases with molar mass, narrowly distributed reference materials with molar masses between 50–100 KDa should be applied to measure the volume between the peak maxima.
Second, certain results obtained using molar mass sensitive detectors are very sensitive to the inter-detector delay. In GPC/SEC-viscometry the determined Mark–Houwink coefficient, α, is strongly influenced by an incorrect inter-detector delay (3). The sensitivity of the Mark–Houwink exponent on the selected inter-detector delay can be used to fine-tune the inter-detector delay, once a first estimate is obtained by overlaying the peak maxima.
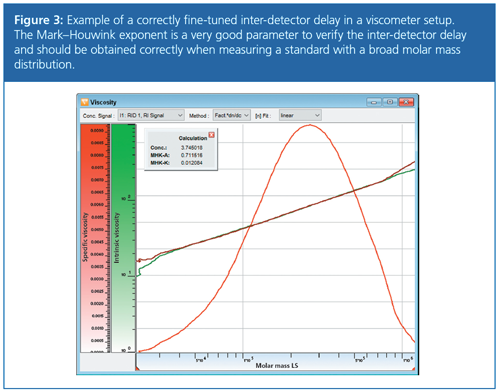
To fine-tune the inter-detector delay, a broadly distributed linear standard with a known Mark–Houwink exponent is run. The Mark–Houwink exponent is determined from SEC-viscometry using the previously estimated inter-detector delay. If the exponent is not yet correctly determined, the inter-detector delay of the viscometer can be slightly adjusted until the correct Mark–Houwink exponent α is obtained. Figure 3 shows an example of this. As described above, the inter-detector delays were first estimated using a standard with a narrow molar mass distribution. A broadly distributed polystyrene standard was then analyzed. The inter-detector delay for the viscometer was slightly varied until the resulting Mark–Houwink exponent α shows the expected value of 0.714 (THF, 30 °C).
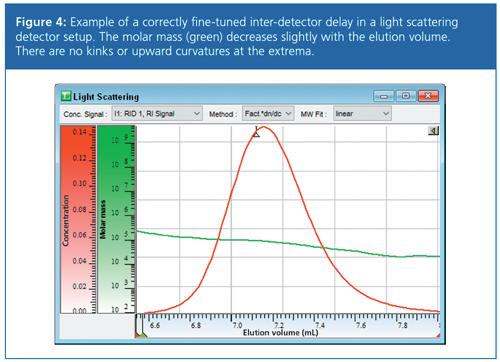
A similar approach is applicable in GPC/SEC-light scattering. It is already possible to verify or correct the determined interâdetector delay by using a narrowly distributed molar mass reference standard. Physically meaningful inter-detector volumes result in a slightly decreasing molar mass with increasing elution volume. A positive example is shown in Figure 4, where the measured molar mass (green trace) shows the expected behaviour. There are no kinks and no unexpected upward curvatures at low concentrations (red trace).
Samples with Broad Molar Mass Distributions in Multidetection GPC/SEC
It is important to understand that the interâdetector delay should be determined with a monodisperse standard or a standard with a narrow molar mass distribution in multidetection setups. The different molar mass responses of molar mass sensitive detectors and concentration detectors result for broadly distributed samples in different detector traces. The light scattering trace and the viscosity trace usually appear to be shifted to lower elution volumes, even when correcting properly for inter-detector delay.
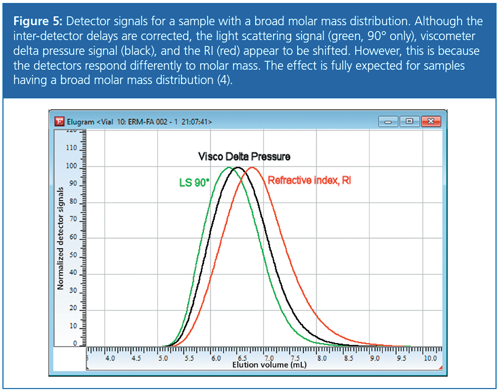
This results from the fact that at identical concentrations, that is, identical signal heights in the RID, the molar mass on the left-hand side of the RID peak is higher than on the right-hand side. Consequently, the light scattering signal at the left-hand side is of a higher intensity than on the rightâhand side of the peak. The higher the polydispersity, the higher the effect. Figure 5 shows light scattering (green), viscometry (black), and refractive index (red) traces for a broadly distributed polystyrene sample (PDI approximately 2.3). The peak maximum for the light scattering trace is observed at lower elution volumes (higher molar masses) compared to the RI trace. The dependence of the viscosity signal on molar mass is not as strong as that of the light scattering signal. That is why the peak maximum of the viscosity signal is found at higher elution volumes (lower molar masses) when compared to the light scattering trace. However, both peak maxima are shifted to lower elution volumes compared to the RIâtrace. The order of the detector signals agrees fully with the expectation and the effect clarifies why narrow standards should be applied when determining the inter-detector delay.
Summary
- GPC/SEC is a powerful multidetector method. However, the time and volume delay between the detectors must be properly accounted for.
- Inter-detector delays can be measured using low molar mass, monodisperse substances.
- When molar mass sensitive detectors are used, the inter-detector delay is determined using a standard with a narrow molar mass distribution and a molar mass between 50–100 kDa.
- When molar mass sensitive detectors are used, fine-tuning of the inter-detector delay is recommended. The narrow standard is sufficient for light scattering detectors, while viscometers often require the additional running of a standard with a broad molar mass distribution.
References
- P. Kilz and D. Held, The Column 8(18), 9–12 (2012).
- D. Held, J. Preis, and F. Gores, The Column11(12), 20–23 (2015).
- P. Kilz and D. Held, in Quantification in LC and GC, S. Kromidas and J. Kuss, Eds. (Wiley, 2009).
- D. Held and P. Kilz, The Column4(10), 17–20 (2008).
Daniela Held studied polymer chemistry in Mainz, Germany, and works in the PSS software and instrument department. She is also responsible for education and customer training.
Wolfgang Radke studied polymer chemistry in Mainz, Germany, and Amherst, Massachusetts, USA, and is head of the PSS application development department. He is also responsible for instrument evaluation and for customized trainings.
E-mail:DHeld@pss-polymer.comWebsite:www.pss-polymer.com

Analyzing Vitamin K1 Levels in Vegetables Eaten by Warfarin Patients Using HPLC UV–vis
April 9th 2025Research conducted by the Universitas Padjadjaran (Sumedang, Indonesia) focused on the measurement of vitamin K1 in various vegetables (specifically lettuce, cabbage, napa cabbage, and spinach) that were ingested by patients using warfarin. High performance liquid chromatography (HPLC) equipped with an ultraviolet detector set at 245 nm was used as the analytical technique.
Removing Double-Stranded RNA Impurities Using Chromatography
April 8th 2025Researchers from Agency for Science, Technology and Research in Singapore recently published a review article exploring how chromatography can be used to remove double-stranded RNA impurities during mRNA therapeutics production.
The Effect of Time and Tide On PFAS Concentrations in Estuaries
April 8th 2025Oliver Jones and Navneet Singh from RMIT University, Melbourne, Australia discuss a recent study they conducted to investigate the relationship between tidal cycles and PFAS concentrations in estuarine systems, and offer practical advice on the sample preparation and LC–MS/MS techniques they used to achieve the best results.
Assessing Safety of Medications During Pregnancy and Breastfeeding with LC–MS/MS
Published: April 8th 2025 | Updated: April 8th 2025Researchers conducted a study on medications used in psychiatry and neurology during the perinatal period, assessing how antiepileptic drugs (AEDs) affect placental functions, including transport mechanisms, nutrient transport, and trophoblast differentiation. Several quantitative methods, such as those for antianxiety and hypnotic drugs, were established to evaluate the safety of pharmacotherapy during breastfeeding using liquid chromatography-tandem mass spectrometry (LC–MS/MS).


