The Thermal Conductivity Detector
LCGC Europe
Thermal conductivity detectors have been in use since before the beginning of gas chromatography. Essential for fixed-gas detection - no substitute has the same ease of use and stability - thermal conductivity detectors are also employed when the auxiliary or combustion gases required by flame ionization or other detectors are unsafe or impractical. Although they cannot match the sensitivity of ionization detectors, thermal conductivity detectors are the third most used detector, surpassed only by flame ionization and bench-top mass-spectrometry detectors. This month's instalment of "GC Connections" takes a look at the operating principles and inner workings of the thermal conductivity detectors.
Gas chromatography (GC) detectors can be classified into two broad categories: bulk-property and chemical-specific. Flame ionization detectors1 fall into the chemical-specific class: molecules that contain carbon-hydrogen bonds are ionized and the resulting current is amplified to produce a signal, while other chemical classes produce little or no response. Nevertheless, thermal conductivity detectors do not interact with solutes chemically but instead respond to changes in a bulk physical property, namely, the thermal conductivity of pure carrier gas compared with the conductivity of the solute–carrier-gas mixture passing through the detector reference and sample cells, respectively. Thermal conductivity detection (TCD) responds in proportion to the concentration in the sample cells of any gas that has a thermal conductivity different than that of pure carrier gas. The sensitivity of TCD response to various solutes is dictated by the solutes' thermal conductivities relative to the carrier: solutes with thermal conductivities close to that of the carrier gas will elicit small responses and those that differ more from the carrier gas in their thermal conductivities will generate larger sensitivities. This makes TCD respond universally without dependence upon specific chemical elements or structures, beyond any indirect effects on solutes' thermal conductivity.
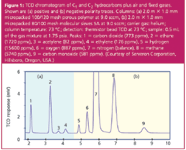
Thermal conductivity detectors comprise one or more active thermal-sensing elements in two gas streams: the reference stream contains pure carrier gas and the sample stream contains the column effluent. The thermal elements' temperatures are nearly the same with pure carrier gas flowing in both the sample and the reference streams. The thermal conductivity of the gas in the sample cell changes as peaks are eluted from the column, while that of the reference stream remains constant. The temperature of the affected sample-sensing element changes in response, while the reference side stays the same and the resulting imbalance changes the circuit output level. Figure 1 shows a typical chromatogram of gases using a thermistor bead thermal conductivity detector.
Figure 1: TCD chromatogram of C1 and C2 hydrocarbons plus air and fixed gases. Shown are (a) positive and (b) negative polarity traces. Columns: (a) 2.0 m × 1.0 mm micropacked 100/120 mesh porous polymer at 9.0 sccm, (b) 2.0 m × 1.0 mm micropacked 80/100 mesh molecular sieves 5A at 9.0 sccm; carrier gas: helium; column temperature: 73 °C; detection: thermistor bead TCD at 73 °C; sample: 0.5 mL of the gas mixture at 1.75 psia. Peaks: 1 = carbon dioxide (773 ppmv), 2 = ethane (1720 ppmv), 3 = acetylene (82 ppmv), 4 = ethylene (176 ppmv), 5 = hydrogen (15600 ppmv), 6 = oxygen (887 ppmv), 7 = nitrogen (balance), 8 = methane (5740 ppmv), 9 = carbon monoxide (581 ppmv). (Courtesy of Serveron Corporation, Hillsboro, Oregon, USA.)
Thermal Conductivity
The coefficient of thermal conductivity λ determines the rate of heat transfer, or flux, through a pure gas or gas mixture that spans a temperature gradient. Thermal conductivity is defined in terms of the heat flux qz and thermal gradient dT/dz by the following equation:

The units for λ are cal.cm-1 .s-1 .°C-1 . The negative sign in equation 1 reflects the fact that heat flows from higher to lower temperatures. Values of λ for some pure gases encountered in GC are listed in Table 1. Methane has one of the highest thermal conductivities for hydrocarbons and benzene one of the lowest hydrocarbon conductivities. Equation 1 indicates that higher thermal conductivities and larger temperature gradients will produce a greater heat flux in a one-dimensional system with correspondingly larger responses to changes in gas thermal conductivity. In a real detector, the dynamics of heat flow depend strongly upon the three-dimensional structure and flow pattern through the detector cells as well as the gases' thermal conductivities and the temperature gradient. Thus, TCD response varies significantly with different designs.
Most solutes have conductivities that are lower than common carrier gases such as helium, argon or nitrogen. So, in general, the thermal conductivity of a carrier–solute mixture will be lower than pure carrier gas. This means that the temperature of the sensing elements in the column effluent stream will increase as peaks are eluted. There is a risk of overheating and damaging the thermal sensing elements if they are operated close to their upper temperature limits to obtain the highest sensitivity. Some thermal conductivity detectors can operate the elements at a constant temperature, measuring the heat required to keep the temperature constant rather than measuring the increase in temperature as peaks are eluted.
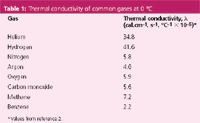
Table 1: Thermal conductivity of common gases at 0 °C
Measuring Thermal Conductivity
The thermal conductivities of the carrier gas and the solute–carrier mixture are measured ratiometrically in TCD. The thermal-sensing elements in a thermal conductivity detector are made either from positive temperature coefficient materials such as metal filaments that exhibit an increasing electrical resistance with increasing temperature, or from negative temperature coefficient materials such as thermistors in which the electrical resistance decreases as the temperature increases. Filament thermal conductivity detectors span a wider operating temperature range than thermistor detectors do, but the latter devices can yield somewhat better sensitivities at operating temperatures below about 100 °C. Sensing materials are chosen carefully for their electrical properties. A metal with a high-temperature coefficient is desirable for TCD filaments. Tungsten or tungsten–rhenium alloys are commonly employed. For thermistor detectors, a bead with a nominal resistance of around 1–3 kΩ at the operating temperature is often used. In either instance, the thermal sensing elements must be closely matched to each other to bring the system and its electronics close to balance in the presence of pure carrier gas. Both types of thermal sensor operate with similar detector layouts and circuitry, although the voltages and currents employed differ significantly.
Figure 2 shows a schematic layout of a four-wire filament thermal conductivity detector. Four cells (represented by the shaded areas in Figure 2) are drilled into a metal block, and a thin resistance-wire filament of about 0.001 in. outer diameter is suspended inside each cell. Pure carrier gas is routed to two of the cells (the reference cells), and column effluent to the other two (the sample cells). The block is heated to a constant temperature of about 20–25 °C above the maximum operating column temperature and a small current on the order of 50 to several hundred milliamperes supplies additional heat to each filament. After an equilibration period, the filaments reach a constant temperature above the block temperature that is determined by the flow-rate and conductivity of pure carrier gas through each cell and by the filament current. Thermal leakage by radiation, convection and conduction through the filament connections is significant, but is assumed to be constant. When a peak is eluted from the column, the different conductivity of the carrier–solute mixture causes a change in the filament temperatures in the sample cells while the reference cell filament temperature remains constant.
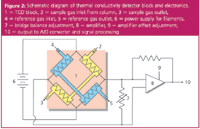
Figure 2: Schematic diagram of thermal conductivity detector block and electronics. 1 = TCD block, 2 = sample gas inlet from column, 3 = sample gas outlet, 4 = reference gas inlet, 5 = reference gas outlet, 6 = power supply for filaments, 7 = bridge balance adjustment, 8 = amplifier, 9 = amplifier offset adjustment, 10 = output to A/D converter and signal processing.
The change in filament resistance caused by solute passage through the sample cells is measured with a Wheatstone bridge circuit, also shown in Figure 2. As the resistance of the filaments changes, a corresponding positive or negative signal is produced at the amplifier output. Electrical balancing and zeroing circuits are also included in TCD amplifiers as noted in Figure 2. In modern GC systems, TCD output is filtered, digitized and processed in much the same manner as for a flame ionization detector (see reference 1 for more details on detector signal processing).
In general, filament-type thermal conductivity detectors can be operated in either a constant-current mode or a constant-temperature mode. In constant-current operation, the filament temperatures are allowed to vary as solutes are eluted and the cell electrical current is kept constant. In the constant-temperature mode, the cell current is reduced or increased as required to keep the filament temperatures constant. An alternative arrangement, not shown here, uses a single-filament cell into which reference gas and column effluent are alternately routed by a microvalve operating at about 10 Hz. The resulting chopped signal is synchronously demodulated to produce the detector output.
Detector Geometry
As peaks are eluted from the column and pass through the detector sample cells, their widths and thus, their resolution, can be adversely affected by too large cell volumes and unswept areas in the detector. Thermal conductivity detectors that are intended for general packed-column use are usually rugged and stable, but they might not be well suited for use with wide-bore capillary columns with inner diameters ≥ 0.32 mm. Although make-up gas can be used to better sweep capillary column flows through the detector cells, the extra flow will dilute the column effluent and reduce sensitivity. In addition, such detectors might not respond rapidly enough to capillary peaks. Low-volume thermal conductivity detectors can handle most packed-column flow-rates as well as wide-bore capillary columns down to around 3–5 mL/min, and are generally considered best for multipurpose applications. Figure 3 illustrates a typical cell design often found in general purpose packed-column detectors [Figure 3(a)] and a low-volume cell [Figure 3(b)]. The differentiating factor here is the manner in which the electrical leads to the sensing elements are routed. The first type is easier to replace but tends to have a larger internal volume to accommodate the two legs of the sensing element mount. The second type requires factory service to replace a burned-out element but occupies lower volumes than the first.
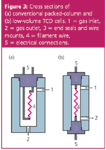
Figure 3: Cross sections of (a) conventional packed-column and (b) low-volume TCD cells. 1 = gas inlet, 2 = gas outlet, 3 = end seals and wire mounts, 4 = filament wire, 5 = electrical connections.
Choice of Carrier Gas
The thermal conductivity of the carrier–solute mixture changes in direct proportion to solute concentration from about 1 part-per-million by volume (ppmv, 1 × 10⁻⁶ ) at the lower end up to several percent: typical thermal conductivity detectors have a linear dynamic range of close to 104 . There is one notable exception: low percent levels of hydrogen separated with helium carrier gas. Even though pure hydrogen has a higher conductivity than pure helium and would be expected to increase the conductivity of an eluting solute–carrier gas mixture, the thermal conductivity of a mixture of these two gases decreases relative to pure helium at low hydrogen concentrations up to about 8% and then decreases at higher hydrogen concentrations. The result can be disconcerting and impossible to quantify "W"-shaped peaks for hydrogen compositions in the percent range.3 A special carrier-gas blend of 10% hydrogen in helium is available for this situation. Hydrogen peaks will then go in the opposite (negative) direction to other peaks with lower thermal conductivities, as is also the situation when analysing hydrogen with nitrogen or argon carrier. In the case of hydrogen, either of these latter two carrier gases will produce a larger response than with helium carrier.
As can be seen from the previous example, the best choice of carrier gas for TCD applications can be a compromise. Helium carrier gas, with its high thermal conductivity, yields larger TCD responses than nitrogen or argon carrier for nonhydrogen peaks, and is normally chosen if helium itself is not one of the solutes to be separated. Its high conductivity also allows TCD filaments to be operated at higher currents without risking filament overheating and burn out. Hydrogen sensitivity is low, however, as seen in Figure 1, where the hydrogen peak is small yet represents a high gas concentration level. If high hydrogen sensitivity is desired while also separating air components and light hydrocarbons, then a flame ionization detector can be placed in series with the thermal conductivity detector exit — TCD does not destroy or alter the eluted components — and used with argon carrier gas. The hydrogen sensitivity is higher than it would be with helium or a hydrogen–helium carrier-gas mixture, other air components such as carbon dioxide and oxygen have good responses, and the hydrocarbons are left to the much higher sensitivity flame ionization detector. Note that nitrogen is not suitable as a carrier gas when oxygen or carbon monoxide is to be detected: the thermal conductivities of these three gases are very close.
If the carrier gas has an intermediate thermal conductivity then solutes with lower conductivities will cause the detector to respond in a direction opposite to those solutes with higher conductivities. For example, when separated with argon or nitrogen carrier gas, a mixture of C1–C3 hydrocarbons in helium will produce positive peaks for the hydrocarbons and a negative peak for the helium. If helium were selected as the carrier, the thermal conductivity detector would not respond to helium in the injected mixture (that is, as long as the eluted helium peak is pure). TCD will respond to impurities such as oxygen, water or nitrogen that are coeluted with the helium peak. Note also that if the carrier gas itself contains a few parts per million of nitrogen or other contaminant then a limited response to even a pure helium peak will be seen. Thus, contrary to some chromatographic intuition, carrier-gas purity can be important even for a TCD system.
In addition to the series-detection arrangement described previously, TCD also can be applied in microscale preparative GC by using a fraction collector at the detector outlet to obtain enough pure solute for nuclear magnetic resonance (NMR), elemental analysis or other ancillary analytical techniques. TCD is also useful in fragrance research. The eluted peaks are detected by a thermal conductivity detector, often along with an ionization detector operated in parallel, and the GC effluent is humidified before olfactory evaluation.
Set-up and Operation
Set-up and operation of thermal conductivity detectors are simpler than for combustion detectors such as the flame ionization detector because there are no combustion gas flows to set and no flame to ignite. The procedure involves installing the columns, setting the carrier-gas and reference flows and then turning on the detector at a selected sensitivity or filament current setting.
Flow-rates: At the initial column temperature, the total flows through the sample and reference sides of the thermal conductivity detector should be within about 10% of each other. Measure the flow at the sample and reference exit ports. Set the column flow first, and then set the reference to match. If make-up gas is used with a capillary column, be sure to set the reference flow to equal the column plus make-up flow-rates.
It is important to maintain a constant gas flow through a thermal conductivity detector during operation. If the GC oven is to be temperature programmed, constant carrier-gas flow operation is essential. Use the constant-flow mode in an electronic pressure controlled system or use constant mass-flow carrier and reference gas regulators. Avoid using a constant pressure setting for the carrier gas.
Detector current: In general, to obtain the best sensitivity, the highest possible filament current should be used. In a microprocessor-controlled gas chromatograph, the filament current is set in discrete steps. In analogue systems, there will be a knob or a series of switch settings for this purpose. Referring to the instrument manual, select the highest current setting that does not exceed the maximum level for the carrier gas and cell temperature that you are using. Currents for thermistor detectors are on the order of 8–15 mA, much lower than typical levels of 50–300 mA for filament detectors.
Electrical balance: Many thermal conductivity detectors have both a balance setting that affects the sensor current balance through the bridge circuit plus another zeroing circuit that offsets the detector output as it appears at the amplifier. It is important to adjust the sensor balance control to bring the detector cells near electrical balance before applying additional external zeroing offsets. If the amplifier output is zeroed to offset detector cells that are already far out of balance, the linearity and dynamic range can be cut short.
To balance the detector, turn on the instrument, set the detector temperature, flows and cell current and then allow the detector baseline to stabilize. Turn off detector autozeroing and observe the detector signal on a chart recorder or on the instrument display if a direct readout is provided. Adjust the balance control until the signal is near zero. Then, turn on autozeroing so that the signal is zeroed and adjusted as required for subsequent digitization and data handling. This procedure will ensure that the cell is in balance at the baseline. When the detector is heated and stabilized, it is ready for use.
Troubleshooting
Thermal conductivity detectors are not subject to as many problems as other GC detectors because they are somewhat simpler in construction and are not as sensitive. However, there are several common problems that are easily remedied.
Filament protection circuits: Many TCD designs include one or more means of protecting the filaments from potentially damaging conditions. The most common scheme is to monitor the filament temperatures as indicated by their resistance. If the maximum temperature is exceeded, current is removed, and the detector shuts down. This condition is indicated by a complete lack of response to peaks. The signal will usually go fully positive or negative if a filament does burn out, and it will not be possible to balance the detector. If the filament protection circuit trips repeatedly, then either the current setting is too high for the carrier gas and detector temperature in use or the detector has been set too far out of balance.
The second type of protection circuit temporarily interrupts the filament current during the passage of a large peak and restores current after the peak has passed. This out-of-range condition is intended mainly as a protection against filament burn out from the higher filament temperatures during a large solvent peak. During the out-of-range period, the detector is not delivering a quantitative signal: it is clipped. However, even without the protection, the signal would be clipped for such large peaks. If a quantitative peak area is needed, a lower filament current should be selected.
Thermistors tend to be more rugged than filaments and do not commonly burn out.
Flow effects: The detector also responds to changes in column or reference flow-rates. If one of the flows is changed, it might be necessary to rebalance the detector or make a corresponding change to the other flow. During a temperature-programmed run, the flow through the column changes because of changes in the carrier-gas viscosity. Even using a mass-flow controller, significant transient fluctuations can occur in the column flow. These temperature-related effects, which are seen in addition to drift from column bleed, cause the baseline to drift up or down during a run. A matching reference column or restrictor is often installed in the oven so that both sides of the detector experience the same flow changes with changing oven temperature. Even in this instance, the two flows might not perfectly cancel each other out; electronic baseline profile compensation is very useful for ironing out these residual effects.
Inverted peaks: Peaks that represent solutes with thermal conductivities greater than the carrier gas, such as helium in nitrogen carrier or hydrogen in argon carrier are expected to have the opposite polarity of solutes with lower thermal conductivities than the carrier gas, such as hydrocarbons in helium, nitrogen or argon carrier. If all peaks are inverted, then the detector polarity is backwards. When two columns are in use, one connected to either side of the thermal conductivity detector, the TCD polarity should be reversed when injecting on the second column.
Gradual sensitivity losses: Sometimes a gradual loss of sensitivity is observed over a period of weeks or months. This loss is usually caused by slow degradation of the filaments or thermistor beads as a result of corrosion or to contaminant deposition. The only practical solution is to replace the damaged elements. Note that replacement elements are sold as matched pairs. Do not try to replace only one of them — you probably would not be able to balance the detector properly. If you have a low-volume detector with feedthrough filaments, the whole block will need to be sent to the manufacturer to be rebuilt. Many instrument companies will give a credit for returning a damaged unit in exchange for a completely refurbished or new detector.
Conclusion
The thermal conductivity detector is a reliable device with good sensitivity and universal response. Its design simplicity makes it easy to set up, maintain and troubleshoot. Some care is required in selecting carrier gases, setting column and reference flows and choosing the correct sensing current. With proper care, a thermal conductivity detector should last for the life of the gas chromatograph.
"GC Connections" editor John V. Hinshaw is senior staff engineer at Severon Corp., Hillsboro, Oregon, USA and a member of the Editorial Advisory Board of LCGC Europe.
Direct correspondence about this column to "GC Connections", LCGC Europe, Advanstar House, Park West, Sealand Road, Chester CH1 4RN, UK, e-mail: dhills@advanstar.com
For an ongoing discussion of GC issues with John Hinshaw and other chromatographers, visit the Chromatography Forum discussion group at http://www.chromforum.com
References
1. J.V. Hinshaw, LCGC Eur., 19(4), 206–216 (2006).
2. S. Dal Nogare and R.S. Juvet, Gas-Liquid Chromatography Theory and Practice (Interscience Publishers, New York, USA 1962), p. 192.
3. B.J. Gudzinowicz, in The Practice of Chromatography, L.S. Ettre and A. Zlatiks, Eds. (Interscience Publishers, New York, USA, 1967), p. 246.
Determining Enhanced Sensitivity to Odors due to Anxiety-Associated Chemosignals with GC
May 8th 2025Based on their hypothesis that smelling anxiety chemosignals can, like visual anxiety induction, lead to an increase in odor sensitivity, a joint study between the University of Erlangen-Nuremberg (Erlangen, Germany) and the Fraunhofer Institute for Process Engineering and Packaging (Freising, Germany) combined behavioral experiments, odor profile analysis by a trained panel, and instrumental analysis of odorants (gas chromatography-olfactometry) and volatiles (gas chromatography-mass spectrometry).
Investigating 3D-Printable Stationary Phases in Liquid Chromatography
May 7th 20253D printing technology has potential in chromatography, but a major challenge is developing materials with both high porosity and robust mechanical properties. Recently, scientists compared the separation performances of eight different 3D printable stationary phases.
Detecting Hyper-Fast Chromatographic Peaks Using Ion Mobility Spectrometry
May 6th 2025Ion mobility spectrometers can detect trace compounds quickly, though they can face various issues with detecting certain peaks. University of Hannover scientists created a new system for resolving hyper-fast gas chromatography (GC) peaks.

.png&w=3840&q=75)

.png&w=3840&q=75)


.png&w=3840&q=75)


.png&w=3840&q=75)
