Dwell Volume Revisited
In terms of practical use of the results, resolution is generally more critical than retention.
This month's instalment of "LC Troubleshooting" is prompted by an error that I made in February's instalment.1 A reader had enquired about the source of an observed change in peak width and retention time when moving a gradient liquid chromatography (LC) method from one LC system to another. I misconstructed the example chromatograms of Figure 1 in February's column,1 which confused the associated discussion. What concerns me more than the error is the fact that only two readers brought it to my attention — usually if I make a mistake, I get dozens of e-mails pointing out my error. This made me decide to return to the topic of dwell volume for this month's column.
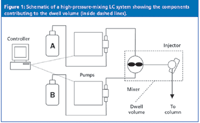
Figure 1: Schematic of a high-pressure-mixing LC system showing the components contributing to the dwell volume (inside dashed lines).
Dwell Volume and Dwell Time
When we refer to "dwell volume", we mean the system volume from the point at which the mobile phase solvents are mixed until they reach the head of the column. For high-pressure-mixing LC systems, this comprises the mixer, connecting tubing and autosampler loop as the primary components (Figure 1). Low-pressure mixing systems combine the solvents upstream from the pump, so additional tubing plus the volume of the pump head (or heads) is added to the components of the high-pressure mixing system (Figure 2). Typical dwell volumes for today's LC systems are 1–3 mL for high-pressure mixing and 2–4 mL for low-pressure mixing systems. These volumes can be reduced to < 0.5 mL for systems modified for use with mass spectrometry detection (LC–MS) or can be 5–8 mL, or even larger, for some of the older equipment still in use. Dwell volume (VD) is measured easily, as described in Figure 4.
Dwell volume is of practical importance only for gradient applications. When mobile phase components are mixed on-line for isocratic separations, the dwell volume still exists, but because the mobile phase concentration is constant, there is no observed difference between chromatograms run on different dwell-volume systems. Gradient methods, conversely, rely on a change in the concentration of mobile phase over time to facilitate the separation. The delay created by the dwell volume can make a difference in the appearance of the chromatogram for different gradient systems.
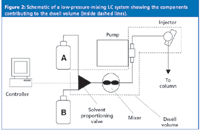
Figure 2: Schematic of a low-pressure-mixing LC system showing the components contributing to the dwell volume (inside dashed lines).
We generally report chromatographic retention in units of time, not volume, so it is often convenient to express the dwell volume as dwell time instead. Dwell time (tD) is obtained by dividing the dwell volume by the flow-rate. So a system with a dwell volume of 3 mL run at a flow-rate of 1.5 mL/min would have a dwell time of 2 min.
The Chromatogram
Example chromatograms for LC systems with 1.5 and 3.5 mL dwell are shown in Figures 3(a) and 3(b), respectively. Note that this is identical to the erroneous Figure 1 of reference 1 except the chromatograms are interchanged. If you keep "LC Troubleshooting" for future reference, I encourage you to photocopy Figure 3 and paste it over Figure 1 of the February 2006 instalment. At a flow-rate of 2 mL/min, the gradient reaches the head of the column at (1.5 mL/2 mL/min) = 0.75 min in the run of Figure 3(a), as noted by the arrow in the gradient overlay. In a similar manner, the dwell time for Figure 3(b) is 1.75 min.
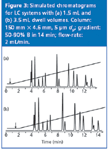
Figure 3: Simulated chromatograms for LC systems with (a) 1.5 mL and (b) 3.5 mL dwell volumes. Column: 150 mm x 4.6 mm, 5 μm dp; gradient: 50â90% B in 14 min; flow-rate: 2 mL/min.
As an oversimplified model of gradient elution, we can think of a compound being frozen at the column inlet until a strong enough solvent arrives to wash it through the column. If this were the case, all the peaks in two runs on different dwell-volume systems would be shifted by the difference in dwell time. In the present example, the difference in dwell time is 1 min, so one would expect the peaks of Figure 3(b) to be delayed by 1 min relative to those of Figure 3(a). As a first approximation, this is true, especially for more strongly retained peaks. Table 1 compares the retention times between the two runs, and the last few peaks differ by > 0.9 min. However, the first peaks differ by much less than 1 min. This is because some peak migration nearly always takes place during the isocratic hold created by the dwell volume. The longer the hold, the more migration takes place before the gradient reaches the column, so the difference in retention will be less than that expected just from the dwell volume. This is illustrated in Table 1 for the first two peaks, which differ in retention by < 0.5 min.

Figure 4: Dwell volume measurement from a blank gradient. See text for details.
Because the peaks in the two runs of Figure 3 spend a different proportion of their time under isocratic and gradient conditions, it is not surprising that there are differences in relative retention and, thus, changes in resolution (Rs). The change is a minor change in the depth of the valley between the first two peaks in Figure 3; Rs = 1.05 in Figure 3(a) and Rs = 1.18 in Figure 3(b). In other instances, the difference can be dramatic.
Two Concerns
Two concerns arise from the changes in the appearance of the chromatogram, as in Figure 3, when a method is moved between LC systems of different dwell volume. These account for the perceived difficulty of transferring a gradient method from one laboratory to another. First, a shift in retention can mean that the data system settings for one system probably will not work with the other. Peaks are identified based upon their retention times, so the data system is set to recognize a peak if it appears in a narrow retention time window. If the peak retention time has shifted with the system, it is unlikely that it will be eluted within the same retention window. This is not particularly significant if the method documentation is written to align the peak detection window with the retention time of an injected standard — in such instances the adjustment from one system to the other is almost automatic. In contrast, many methods are written such that the retention time must fall within a specific time window. This makes it much more difficult to transfer a gradient method between two systems. If you develop and document methods, be sure to specify retention relative to a standard, so you do not unnecessarily restrict future use of the method.
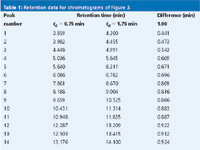
Table 1: Retention data for chromatograms of Figure 3.
The second major concern when moving a gradient method between LC systems of different dwell volume is the change in resolution often observed for early eluted peaks. In terms of practical use of the results, resolution is generally more critical than retention. If a change in dwell volume reduces resolution sufficiently that the data are no longer usable, you could be in trouble. One way to avoid this problem is to check the method, before validation, on systems that cover the expected dwell volume range so that it (and the method documentation) can be modified if necessary to work satisfactorily on all LC systems.
The simplest way to deal with dwell volume differences between equipment is to develop the method with sufficient resolution that it will tolerate the changes encountered on systems of different dwell volume. There are two other approaches that compensate for differences in dwell volume, such that the chromatogram is unchanged when a different system is used. We'll look at these next.
Maximum Dwell Volume Methods
If you know in advance the largest dwell volume system on which the method will be run, you can build the method accordingly. In the example of Figure 3, let's assume the development system is the 1.5 mL dwell system, and the maximum dwell that will be encountered is 3.5 mL. In this instance, just increase the dwell volume of the development system to match the maximum dwell volume, then develop the method in the normal manner. So we would add 2 mL of volume to the 1.5 mL system. This isn't very practical, but there is a simpler, and equally effective, alternative — just add the difference in delay time as an isocratic hold at the beginning of each run. So each gradient in our 1.5 mL dwell system would start with a 1 min isocratic hold (assuming a flow-rate of 2 mL/min). Now, as far as the column is concerned, the two systems of Figure 3 would be identical. The method could be written to allow adjustment of the initial hold so that the true dwell time plus the hold equals 1.75 min. Several years ago, I developed a series of methods for a multinational pharmaceutical company. The challenge was that the largest dwell volume of any system in their laboratories was 4.5 mL, so they made a policy that all gradient methods would be developed with the equivalent of a 4.5 mL dwell. Our LC systems had a 2.3 mL dwell, so we added the equivalent of 2.2 mL of hold for each run. The methods were written so that part of the method set-up procedure included adjustment of the hold so that the total equivalent dwell volume was 4.5 mL. The methods transferred easily all over the world.
Zero Dwell Volume Methods
Another approach to addressing dwell volume differences is to set the dwell volume to zero for all methods. Of course this cannot be done from a plumbing standpoint, but many, if not most, new LC systems have a feature that allows you to inject the sample after the gradient has started. For example, with a 2 min dwell time, you would start the gradient and wait 2 min before injection. This will only work for LC systems that have this capability, but as older systems are replaced, the feature should be more and more common. If this approach is taken, be sure to allow sufficient time for column equilibration before the next injection because the timing will be a bit different than normal. The main danger of developing methods using this technique is that someone will try to transfer the method to an older system without injection delay capabilities.
Summary
The practical impact of the system dwell volume on retention and resolution is not something to take lightly. It is unfortunate that many chromatographers ignore dwell volume considerations when developing and transferring gradient LC methods. As a result, they have unnecessary problems with the methods, and gradient elution as a technique gets a bad name as being unreliable. This month, we've seen that dwell volume is not such a big mystery — measure the dwell volume for each LC system and plan ahead for the use of gradient methods on different equipment and you should have few problems.
"LC Troubleshooting" editor John W. Dolan is vice-president of LC Resources, Walnut Creek, California, USA; and a member of the Editorial Advisory Board of LCGC Europe. Direct correspondence about this column to "LC Troubleshooting", LCGC Europe, Advanstar House, Park West, Sealand Road, Chester, CH1 4RN, UK.
Readers can also direct questions to the Chromatography Forum at http://www.chromforum.com
References
1. J.W. Dolan, LCGC Eur., 19(2), 72–79 (2006).
Polysorbate Quantification and Degradation Analysis via LC and Charged Aerosol Detection
April 9th 2025Scientists from ThermoFisher Scientific published a review article in the Journal of Chromatography A that provided an overview of HPLC analysis using charged aerosol detection can help with polysorbate quantification.
Analyzing Vitamin K1 Levels in Vegetables Eaten by Warfarin Patients Using HPLC UV–vis
April 9th 2025Research conducted by the Universitas Padjadjaran (Sumedang, Indonesia) focused on the measurement of vitamin K1 in various vegetables (specifically lettuce, cabbage, napa cabbage, and spinach) that were ingested by patients using warfarin. High performance liquid chromatography (HPLC) equipped with an ultraviolet detector set at 245 nm was used as the analytical technique.
Removing Double-Stranded RNA Impurities Using Chromatography
April 8th 2025Researchers from Agency for Science, Technology and Research in Singapore recently published a review article exploring how chromatography can be used to remove double-stranded RNA impurities during mRNA therapeutics production.

