A Test Mixture for Performance Verification of Multi-User UHPLC–MS Instruments
LCGC Europe
Chromatographic techniques with mass spectrometric detection are important enablers in modern drug discovery. With the development of robust instrumentation and implementation of user-friendly software (or software packages), non-expert users can now walk up to easily accessible advanced chromatographic systems and perform experiments at their own convenience. Although remarkable improvements in robustness and ease-of-use have happened since the introduction of the first high performance liquid chromatography–mass spectrometry (HPLC–MS) systems, the instrument performance still needs to be qualified and monitored to ensure consistent high-quality results. This article will demonstrate how a simple test mixture of carefully selected compounds can facilitate both the development of generic ultrahigh-pressure liquid chromatography–mass spectrometry (UHPLC–MS) methods and automated performance monitoring of multiple instruments located in separate laboratories and buildings.
Photo Credit: wongwean/Shutterstock.com

Tomas Leek1, Niklas Falk2, Ayda Babapour3, and Magnus Klarqvist1, 1Respiratory, Inflammation and Autoimmunity, Innovative Medicines and Early Development Biotech Unit, AstraZeneca, Mölndal, Sweden, 2TIBCO Spotfire, Gothenburg, Sweden, 3AkzoNobel Pulp and Performance Chemicals, Bohus, Sweden
Chromatographic techniques with mass spectrometric detection are important enablers in modern drug discovery. With the development of robust instrumentation and implementation of user-friendly software (or software packages), non-expert users can now walk up to easily accessible advanced chromatographic systems and perform experiments at their own convenience. Although remarkable improvements in robustness and ease-of-use have happened since the introduction of the first high performance liquid chromatography–mass spectrometry (HPLC–MS) systems, the instrument performance still needs to be qualified and monitored to ensure consistent high-quality results. This article will demonstrate how a simple test mixture of carefully selected compounds can facilitate both the development of generic ultrahigh-pressure liquid chromatography–mass spectrometry (UHPLC–MS) methods and automated performance monitoring of multiple instruments located in separate laboratories and buildings.
Medicinal chemistry is an important part of early drug discovery where novel compounds are designed and synthesized to develop treatments for unmet medical needs (1,2). The iterative optimization of biological activity and compound properties is typically described by a designâmakeâtest-analyze (DMTA) cycle (3). The consequences of progressing an erroneous sample in the DMTA-cycle can be severe, leading not only to the waste of valuable project resources by diverting project efforts in the wrong direction, but also potentially causing ambiguity on ethical and intellectual property issues. One widely adopted technology for the analysis of reaction mixtures and final screening compounds is ultrahighâpressure liquid chromatography (UHPLC) in the reversed-phase mode with mass spectrometric (MS) detection. Following the development of more robust instrumentation and user-friendly software packages, multi-user UHPLC–MS instruments are now a common feature of many laboratories for organic synthetic chemistry (4). Walkâup (which in this article is used as a generic term for a multiâuser system with a user-friendly sample login, standardized methods, and automated report generation) solutions provide the endâuser with the convenience of performing standardized highâperformance analytical experiments in close proximity to their workplaces without the need of direct support from separation and MS experts. This article will present an example of how a simple test mix can facilitate both method development and function as a system suitability test (SST) mix in a UHPLC–MS-based walkâup platform. The initiative to develop this new generic test mix originated in a technology shift where seven UHPLC–MS systems were replacing 17 high performance LC (HPLC)–MS instruments in the walk-up platform for medicinal chemistry. The main benefits from the technology shift were expected to be an increase in performance, including a higher sample capacity and a higher flexibility by enabling each UHPLC–MS system to operate with both high and low pH mobile phases. As in every analytical procedure, a relevant SST protocol must be implemented to ensure adequate instrument performance before running actual samples. Given the complexity of designing a generic test mix, the benefits of using multivariate analysis (MVA) became clear early in the process and MVA was found to be a valuable tool in the selection process of test mix compounds.
After implementation, the SST protocol evolved rapidly from monitoring the performance of individual instruments to automatically monitoring and visualizing the performance of all UHPLC–MS instruments in the platform. The aim of the extended routine was to ensure interchangeable systems where data acquired on one of the UHPLC–MS systems should be the same as that obtained on any of the other systems. To efficiently visualize the results from the expanded protocol, a novel and efficient visualization of SST data is described and the benefits discussed.
Experimental
Instrumentation: All experiments were performed on Acquity I-Class or Acquity Classic UPLC systems (Waters Corporation). The systems consisted of a binary pump, in-line degasser, autosampler, heated column compartment, diode array UV detector, and Waters SQD or Waters SQD2 MS detectors with electrospray ionization.
Software: Instrument control and data acquisition: MassLynx 4.1 software (Waters Corporation); multivariate data analysis and visualization: SIMCA 13 (Umetrics); data evaluation and visualization: TIBCO Spotfire 6.5 (TIBCO Spotfire); calculation of logD and pKa ADC/Labs 2012 (Advanced Chemistry Development, Inc); php-scripting and visualization of performance monitoring: pChart 2.0 (www.pchart.net).
Chemicals and Columns: Acetonitrile (HPLC grade) was purchased from Fisher Chemical. Water was obtained from an in-house Millipore system (resistivity: 18.2 MΩ × cm at 25 °C). Formic acid, ammonia-solution (26%), ammonium hydrogen carbonate, trifluoroacetic acid (TFA), and final test compounds 3-Acetaminophenol, glyburide, amitriptyline (hydrochloride), and (DHQD)2PHAL were purchased from Sigma-Aldrich at analytical grade or higher. Test compounds dissolved in dimethyl sulfoxide (DMSO) were acquired from company internal compound management. Method development was made on 50 mm × 2.1 mm and 30 mm × 2.1 mm 1.7-μm BEH C18 or 1.8âμm HSS C18 Acquity columns from Waters Corporation
General Mobile Phases and Stock Solutions: Two different generic systems for gradient elution were applied, one at pH 3 and one at pH 10 (apparent pH as measured in the weak mobile phase). In both cases, mobile phase A consisted of 5% acetonitrile and 95% water, mobile phase B was 95% acetonitrile and 5% water. The pH was adjusted as described below. Low pH-system: 10 mM formic acid and 1 mM ammonia in both A and B. High pH-system 6.5 mM ammonium hydrogen carbonate with 47 mM ammonia in both A and B
The test compounds were dissolved and diluted to 0.2 mg/mL in DMSO or in reference mix (30:70 w/w acetonitrile–water), and were dispensed into glass vials and sealed with a pre-slit silicone septum.
General UHPLC–MS Setup and Core Methods for Test Mix Development: Generic 2.5-min 5–95% acetonitrile gradients at a flow rate of 1 mL/min at 45 °C were used at low and high pH. For the analysis of test mix stability, the gradients were extended to 5 min. All other conditions were constant. UV detection was at 210 nm and 230 nm for impurity profiling. Peak capacity studies were performed with an initial hold of 1 column volume (CV) followed by the gradient elution at a different length. The gradient ended with a 3 CV wash and 5 CV equilibration of the column at starting conditions before the next injection.
Procedure for Virtual Screening: A virtual global space map (5) was used to position test compounds relative to the compounds in a diverse reference library. In the first step the variability in chemical space was described using a principal component analysis (PCA) of calculated common physiochemical descriptors (lipophilicity, hydrogen bond properties, polar surface area) for the reference library. In the next step the test mix candidates and a library of bioavailable compounds (for comparison) were positioned via PCAâscore prediction in the virtual global map. As new test mix candidates were identified they could be included by the same procedure and visualized in the chemical space without changing the underlying t-scores.
Procedure for Test Mix Stability: Test compounds were dissolved in DMSO to 0.2 mg/mL or in an acetonitrile–water mix (30:70 w/w). The sample solutions were dispensed into amber glass vials sealed with pre-slit silicone septum and stored at three different conditions: 1: in the UHPLC autosampler (20 °C and dark); 2: in the laboratory (ambient temperature and protected from light); and 3: in the fridge (8 °C and dark).
Stability samples were analyzed at both pH 3 and pH 10 and evaluated regarding peak area of the respective test compound and the number of total impurities formed at 3 days, 5 days, 8 days, 15 days, and 30 days and compared with the initial data point. The test mix stability was investigated both in vials stored continuously at the different conditions and in vials cycled in and out of storage
General Procedure for Performance Monitoring (PM): The PM procedure was initiated by an automated creation of a batch-file job in MassLynx, including several blank injections to clean and condition the system prior to running the test mix. The raw data processed in openlynx and the results moved into a repository file server. The chromatographic channels (UV and MS) were extracted together with instrument metadata. The data was presented using pChart 2.0 in an internal web page, easily accessible for both analytical experts and service engineers. The test chromatograms (with UV lamp usage time and number of injections) were visualized in a primary panel to obtain a swift overview of the overall instrument(s) performance. The processed data (RT, peak area) was stored in a database and data from the most recent 30 days can be visualized to detect drift and ageing in trend plots. When needed the content in the database can be accessed and visualized with descriptive statistics in the software (6).
Results and Discussion
To secure adequate system performance and ensure the quality of the generated data, SST should be part of any analytical method (7). However, the inherent nature of medicinal chemistry means that content and composition of future samples is unknown and therefore the strategy used to select representative test mix compounds was to cover most of the chemical space used by drug projects. Ideally, the test mix should also be applicable to performance testing of the entire chromatographic system. With this approach the same test mix can be used both for method development and as a mix of performance indicators for SST. Although the future compounds for biological testing are unknown, the chemical space occupied by these compounds and the synthetic intermediates leading to them will cover a vast chemical space. The final walk-up methods and hence the test mix should therefore cover the range from polar low-molecularâweight (MW) compounds to lipophilic highâmolecular-weight intermediates. As a guideline for test mix development, a lipophilicity range between logP 0–10 and a molecular weight of 100–1000 should be covered with a mix of neutral, basic, and acidic compounds. When considering a minimum SST protocol, the primary aim is to ensure that only systems with adequate performance are available for walk-up analysis. Based on experience and the literature (8), frequent errors and unacceptable variance in retention and peak area were associated with mobile-phase composition, flow rate, and injected sample amount. Since the function of the separate instrument modules is tested after service and repair, the SST protocol can be reduced to monitor variance in retention time and peak area of test compounds and not the function of individual instrument modules. In addition, the drift caused by ageing of stationary phases and contamination of MS ion source needs to be captured and monitored to facilitate preventive maintenance.
Test Mix Development
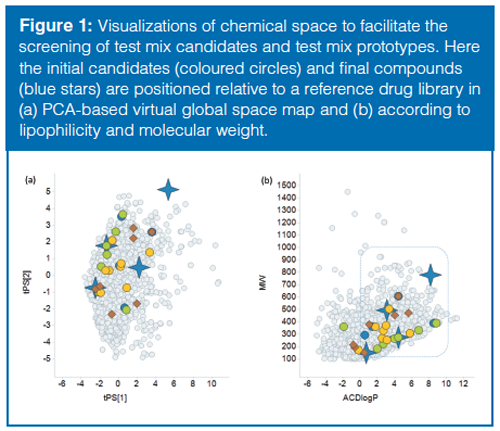
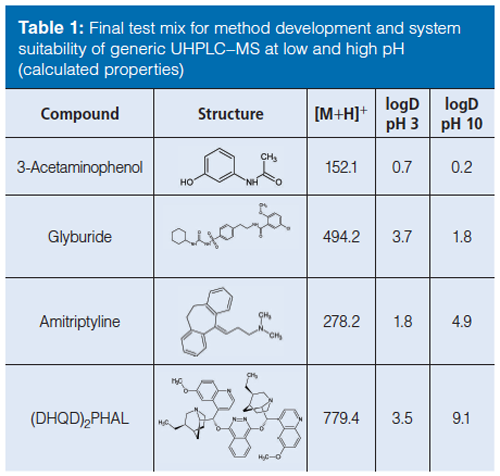
The initial test mix candidates were performance indicators found in literature for chromatographic test mixtures (9–13) and in unpublished internal protocols for chromatographic testing. To obtain an overview of the candidate’s relative location in chemical space, a virtual navigation map was created using a PCA-based global space map (Figure 1[a]). Advantages with this approach were the swift positioning of test mix candidates in the virtual map and the possibility to evaluate the coverage of combinations of candidates before performing any additional experimental work. Promising combinations of test mix candidates were thereafter combined into test mix prototypes for experimental validation. The prototype mixtures were prepared in DMSO, analyzed at both pH 3 and pH 10, and then evaluated for retention, peak shape, and UV–MS responses. After several iterations, a final test mix of compounds could be selected (Table 1). In summary, all the compounds in the test mix are visible both in UV and electrospray ionization (ESI) and resolved at both high and low pH using the described methodology. Glyburide (a weak acid) was selected primarily to monitor the performance of the detectors with good ionization in both positive and negative electrospray and good visibility in UV. Amitriptyline (lipophilic base) was selected as a test probe of chromatographic performance. Polar starting materials were represented by 3-Acetophenol and high-molecular-weight lipophilic compounds by the catalyst (DHQD)2PHAL.
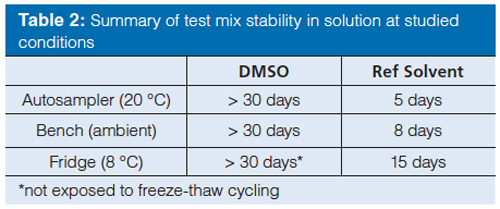
After defining the test mix compounds the next step was to investigate the stability of the compounds in solution. An experimental study was therefore performed to study the effects of sample solvents and the storage conditions. Ideally, the sample solvent should have an elution strength lower (or similar) to the weak eluent in the gradient to achieve good chromatographic performance, while at the same time the sample should be readily soluble in the solvent. An acetonitrile–water mixture (30:70 v/v) was found to provide a promising compromise of solubility and performance. As an alternative to water-based mixtures, neat DMSO has been found to be a useful sample solvent capable of dissolving a wide range of compounds without causing severe chromatographic artefacts. DMSO is known to have mild oxidizing and hygroscopic properties (14–15), however, and may compromise the stability of the test mix. The stability of the test mix compounds in DMSO and in the acetonitrile–water (30:70 v/v) mix was therefore investigated. The criteria for stability was arbitrarily set to ± 5% of the initial area (content). Interestingly, no major chemical degradation (no single impurity was above 2%) or reduction in peak area could be observed in DMSO samples stored for 30 consecutive days and protected from light (Table 2). However, as the freezing point for neat DMSO is around 19 °C, a freezeâthaw sequence is introduced when transferring the DMSO solution in and out of the refrigerator. Therefore a repeated freezeâthaw cycling was studied, showing increasingly lower peak areas with each cycle, indicating a dilution or compound precipitation because of water uptake in the DMSO (16). Freeze-thaw cycling of the test mix in DMSO solution should therefore be avoided. The stability (content) in the acetonitrile–water mix was in general terms lower, which is probably a consequence of the higher volatility of acetonitrile compared to water. Since the vials are not perfectly sealed, acetonitrile can evaporate and gradually reduce the total sample volume and consequently also alter the solvent composition with decreased solubility of the lipophilic (DHQD)2PHAL.
Test-Mix-Driven Method Development
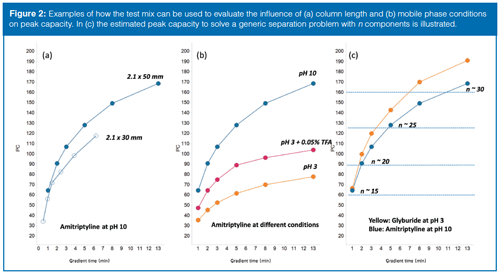
From a user perspective, there are several demands on a highâperforming walk-up system. The analysis time should be short to ensure a high sample capacity and the peak capacity (PC) should be as high as possible to separate as many peaks as possible within any given analysis time. Further, the instrument configuration and methods should be robust and give comparable results between systems. In reality, compromises are necessary and to maintain a data-driven optimization the test mix was utilized for method development with different methods and instrument setups were compared and evaluated in terms of speed, performance, and robustness. One example of how the test mix was used to steer method development can be found in the process of finding a suitable combination of column dimension, flow rate, and gradient times. Performing chromatographic separations at elevated temperatures and high flow rates are known factors to achieve high PC of small molecules (17). To mitigate performance with the risk of over-pressuring the instrument, the maximum operational pressure was limited to 80% of maximum system pressure. Consequently, the flow rates were limited to 1 mL/min for 2.1 × 50 mm column and 1.25 mL/min for 2.1 × 30 mm columns. The PC for the test mix components was thereafter monitored when varying column length, mobile phase conditions, and gradient times. For simplistic reasons, PC was here defined as the gradient time divided with peak width at 5% of peak height. When evaluating the performance obtained on 30 mm and 50 mm columns (Figure 2[a]), a gradient time of 1 min was required to elute the test mix on 50 mm columns. Although shorter analysis time is possible on the 30-mm column, the PC is dramatically reduced and so the 50-mm columns were selected for further method development. Next, the effect of gradient time on PC was studied at pH 3 and pH 10. The observed general increase in PC with longer gradient time was expected, but an unexpected observation was made when studying the separation between amitriptyline and (DHQD)2PHAL at pH 3. The two compounds are well separated with short gradients, but as the gradient time lengthens the separation of the studied compounds decreases to zero at 13 min (coeluting peaks). This observation was further investigated by repeating the experiments with an addition of trifluoroacetic acid (TFA) to the mobile phases; the pair now remained well separated up to and above 13 min, indicating a more homogeneous retention mechanism possibly because of ion-pairing with TFA. Although the separation was preserved and the peak shape was improved with the addition of TFA, the PC was not nearly as good as at pH 10 (Figure 2[b]). In the next method development step, an estimate of the required PC (and gradient time) for the general walk-up methods was made with the aim of balancing performance and capacity. To picture the complex relationship between gradient time, peak capacity, and the capability of resolving “n-components” in a hypothetical sample, the empirical relationship PC = n1.5 was adopted from (18). The solution shown in Figure 2(c) was used to obtain a general overview of how the separation power develops (resolving n components) with increasing gradient time. Assuming simple or moderately complex samples (where the number of components are <20), relatively short gradients (1.5–2 min) should provide sufficient separation power to resolve most of the hypothetical future samples. The power of MS detection should also be considered because it gives a secondary dimension capable of resolving ionizable compounds even if they not are fully separated in the chromatographic dimension. Studying the shape of the graph (Figure 2[c]) shows the benefit of providing slightly longer methods in the walk-up platform. To balance the separation power with sample capacity it was therefore decided to implement core methods with 1.5-min gradients for reaction monitoring (2-min total runtime) and 3.5 min gradients for more complex samples (total 4 min). Consequently, if more extensive method development (pH, solvents, columns) is required to resolve the components, the optimization should be done on other systems and performed by separation scientists to use the walk-up instrumentation in the most efficient manner.
Performance Monitoring of Walk-Up UHPLC–MS Systems
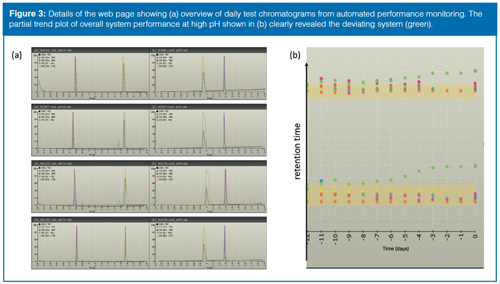
To ensure appropriate quality of the results generated on walkâup instruments, an automated daily procedure was developed where the SST mix was injected and the performance results were visualized in a company internal web page. By using this approach instruments on different floors and even in different buildings can be tested and their performance monitored at a very low cost. The strategy of presenting the most recent test chromatograms in a single visualization panel was found to be an effective way of identifying a deviating system for operators without an in-depth knowledge of chromatographic theory. Ideally, all test chromatograms, obtained with a given LC–MS method, should appear very similar and a diverging system should be easily detected when compared to another. Shortly after implementation, it became evident that the SST mix could be further simplified to a performance monitoring (PM) test mix as the major system variance (especially in retention time and general peak shape) was captured with the test probes amitriptyline and glyburide (Figure 3[a]). Complementary to the panel of daily test chromatograms, the trends for representative calculated data are visualized in a secondary panel to detect drift in performance over time. One of the first examples was the value of harmonized performance monitoring (Figure 3[b]), where the retention time(s) began to deviate for one of the systems. The erratic system was taken out of service but no obvious explanation to the drifting retention times could be identified until the UHPLC column compartment was disassembled and accumulations from a microleakage were detected. The combination of the leakage’s concealed location and the elevated temperature in the compartment made detection of the leakage difficult. The problem was, however, effectively brought to the attention of the service engineer and therefore the use of a malfunctioning walk-up instrument was avoided. The performance monitoring has also been used with significant success to validate suggested improvements and simplifications in the walk-up platform. One initiative leading to improved robustness regarding peak alignment between UV and MS signals was achieved by replacing the typical T-split between the PDA and the MS with a standardized length of fused-silica capillary. Although the mobile phase flow is now suboptimal for MS detection, the perceived value of improved robustness in peak alignment and general detection fidelity exceeds the extra efforts of cleaning the MS inlet. In addition, small changes to the operational protocols, such as preparing the mobile phases in 30-litre barrels instead of 1-L bottles, effectively reduced the variance between systems. Increasing the initial acetonitrile content in the gradients from 5% to 10% was shown to give a major improvement in system availability because sample precipitation and contamination are less prone to occur with the higher organic content.
Conclusions
A test mixture with carefully selected compounds representative for the chemical space to be analyzed has been shown to be an asset to control both the quality of data produced and to develop and improve the analytical walk-up LC–MS platform. Combined with daily performance monitoring, this has resulted in increased system availability and allowed for a change from 17 HPLC–MS systems to seven UHPLC–MS systems. These improvements have decreased the need for maintenance and service, increased robustness and efficiency of the platform, decreased the cost, and ultimately increased the value of our walk-up LC–MS platform to the business.
Acknowledgements
The authors would like to thank our colleagues at Medicinal Chemistry, AstraZeneca Gothenburg for their contributions to the development and continuous improvements of the UHPLC–MS walk-up platform and for valuable discussions. We would also like to thank Dr. Charles Elmore for valuable editorial comments and suggestions on the work.
References
- J.G. Lombardino and J.A. Lowe III, Nature Reviews Drug Discovery, 3, 853–862 (2004).
- A.M. Jordan and S.D. Roughley, Drug Discovery Today14(15–16), 731–744 (2009).
- S. Andersson, A. Armstrong, A. Björe, et al., Drug Discovery Today14(11–12), 598–604 (2009).
- J. Gao, S.S. Ceglia, M.D. Jones, et al., J. Pharm. Biomed. Anal.122, 1–8 (2016).
- T.I. Oprea and J. Gottfries, J. Comb. Chem.3, 157–166 (2001).
- S. Austin, D. Dunstan, J. Reilly, D. Wall, J. Ek, and M. McKinnon, Chromatography Today (August 2014).
- J.W. Dolan, LCGC Europe 17(6), 328–332 (2004).
- V.J. Barwick, J. Chromatogr. A849, 13–33 (1999).
- L. Tang, W.L. Fitch, M.S. Alexander, and J.W. Dolan, Anal. Chem.72, 5211–5218 (2000).
- S. Li, L. Julien, P. Tidswell, and W. Goetzinger, J. Comb. Chem. 8(6), 820–828 (2006).
- I. Mutton, B. Boughtflower, N. Taylor, and D. Brooke, J. Chromatogr. A1218, 3711–3717 (2011).
- 14 SRM 870, CoA Issue date 30 Oct 2000, National Institute of Standards and Technology (http://www.nist.gov/srm/)
- A. Marin, K. Burton, A. Rivers-Sagredo, et al., J. Liq. Chrom. and Rel. Tech.31(1), 2–22 (2007).
- D.H. Rammler and A. Zaffaroni, Ann. NY Acad. Sci.141(1), 13–23 (1967).
- W.S. MacGregor, Ann. NY Acad. Sci. 141(1), 3–12 (1967).
- B.A. Kozikowski, T.M. Burt, D.A. Tirey, et al., J. Biomol. Screen.8(2), 210–215 (2003).
- P. Peterson, A. Frank, J. Heaton, and M.R. Euerby, J. Sep. Sci.31, 2346–2357 (2008).
- U.D. Neue, J. Chromatogr. A1184, 107–130 (2008).
Tomas Leek is currently an Associate Principal Scientist at Respiratory, Inflammation, and Autoimmunity IMED Biotech Unit, AstraZeneca, developing and supporting drug discovery with MS-hyphenated UHPLC, GC, and SFC separations.
Niklas Falk joined AstraZeneca in 2000 as a senior research scientist in cheminformatics, providing IS/IT solutions to drug discovery projects. Since 2015 Niklas has been a Senior Support Engineer at TIBCO Spotfire, Sweden.
Ayda Babapour joined AstraZeneca in 2013 and worked as an analytical chemist with UHPLC–MS techniques in early research in drug discovery as well as late stage drug development. Ayda joined AkzoNobel (Kromasil) in 2016 and works with analytical and preparative chromatographic method development for drug substances as an Application Development Engineer/Chemist.
Magnus Klarqvist joined AstraZeneca in 2003 and currently holds a position as Associate Director heading the Separation Science Laboratory (SSL) within Respiratory, Inflammation, and Autoimmunity IMED Biotech Unit, AstraZeneca. Magnus received his Ph.D. in 1998 from Umeå University, Sweden, and joined the European Commission Joint Research Centre, IRMM, Geel, Belgium, as a postdoc. As assistant professor he established a research group in the Department of Environmental Chemistry, Umeå University, between 2000 and 2003. Magnus is the author or co-author of over 20 peer-reviewed articles.

New Study Investigates Optimizing Extra-Column Band Broadening in Micro-flow Capillary LC
March 12th 2025Shimadzu Corporation and Vrije Universiteit Brussel researchers recently investigated how extra-column band broadening (ECBB) can be optimized in micro-flow capillary liquid chromatography.


