Techniques for Structure Elucidation of Unknowns: Finding Substitute Active Pharmaceutical Ingredients in Counterfeit Medicines
LCGC Europe
This month's column discusses the practicalities of detecting substitutions in counterfeit pharmaceuticals. The approaches used are practical "take home" lessons readers can apply to analyse unknowns in any mixture.
A recurring topic in this column is structural characterization including the underpinnings of mass accuracy and resolution and spectral interpretation.1–3 The need to determine the exact structure, especially of an unknown, is at the core of why we employ mass spectrometers in all the variations and "flavours". Mass spectrometry (MS) has developed into a mainstream analytical technique in the pharmaceutical industry where one of its major roles is identifying and characterizing new chemical entities by elucidating the structure of unknown compounds.
Jean-Claude Wolff, a primary contributor to this discussion as a scientist with GSK (Medicines Research Centre, Stevenage, Hertfordshire, UK) has found characterizing unknowns in potential counterfeit medicines both a challenging and excellent focus for his talents.
I would not suggest that elucidating the structure of impurities is easy. My purpose is merely to show how combined mass spectrometric techniques can gather the information necessary to elucidate the structure of an unknown compound. In so doing, I suggest a pathway that leads to identifying the structure of the molecule analysed. As an example, I offer the exercise of determining the substitute, active pharmaceutical ingredients in counterfeit medicines.
Often the only information available when considering a novel chemical entity might be that the new, unknown compound of interest belongs to a particular class of compounds — in natural product research alkaloids, for instance. Additional information ("background" information) becomes available after performing structure elucidation on impurities or degradants structurally related to a pharmaceutically active compound.
The World Health Organization (WHO) defines counterfeit medicines as:
Those medicines that are deliberately and fraudulently mislabelled with respect to identity and/or source. Counterfeiting can apply to both branded and generic products. Counterfeit products may include products with the correct ingredients or with the wrong ingredients, without active ingredients, with insufficient active ingredient, or with fake packaging.4
"I focus on products with the wrong active pharmaceutical ingredient whose identity I then determine using MS techniques. My sole guidance is that a compound [to be a probable suspect] be readily available commercially and that it be cheap." These are the key elements making the compound attractive to the counterfeiters. Note, however, that "substitute actives" are not necessarily so common that they will be found in libraries. Hence, the reason for structure elucidation.
Counterfeits with an incorrect active ingredient are commonplace. A study of antibiotics and antimalarials by the German Pharma Health Fund showed about 16% of cases investigated contained incorrect ingredients.5
The MS tools available to determine incorrect pharmaceutical ingredients are numerous: you can use a series of sample introduction techniques such as direct inlet or probe, gas chromatography (GC) and liquid chromatography (LC). The choice of inlet technique depends on a sample's characteristics. Inlet technique is also linked to the ionization method you choose — electron ionization (EI), chemical ionization (CI), atmospheric pressure chemical ionization (APCI), electrospray ionization (ESI) — or the newer techniques such as desorption electrospray ionization (DESI) or direct analysis in real time (DART). All of these techniques have been reported in this column in recent years — though admittedly we treated GC techniques rather lightly, an imbalance we shall soon redress.
Structural elucidation of unknowns (in this instance substitute, active pharmaceutical ingredients) demands using MS instruments capable of tandem MS and accurate mass measurements to determine the elemental composition of an analyte. Here the choice is large, ranging from ion trap to Fourier-transform (FT) ion cyclotron resonance via quadrupole time of flight (Q-TOF). Regardless of the instrument or ionization technique used, however, you can elucidate an unknown compound's structure by using the arsenal of MS techniques available. The goal here is simply to show a possible pathway and discuss its merits.
Structure elucidation of a substitute, active pharmaceutical ingredient in an antimalarial tablet: The most effective approach for identifying and characterizing counterfeit medicines is to analyse a suspect sample using LC coupled to accurate-mass, tandem MS. This approach is more precise and quantitative than direct-inlet analysis (probe or infusion) of a sample. LC provides distinct separation of the active or substitute-active pharmaceutical ingredient from the excipients. Moreover, using LC reduces the potential for ion suppression in the ion source. Another advantage of introducing a sample via LC is the ability to compare LC–UV and LC–MS profiles of a suspect sample with a genuine one.
Wolff's preferred approach to minimize analysis time employs:
a generic, 10 minute LC-gradient separation with a conventional C18, reversed-phase column, 1.8 μm particle size. The eluents are 0.05 M ammonium acetate in water and acetonitrile. This method works for most samples analysed. Obviously, however, for particular samples, it would need changing. Even gas chromatography (GC) could be used, as GC–MS (with EI ionization) allows comparing the spectrum you obtain from a suspect sample to those of known compounds. However, a considerable number of samples are antibiotics (penicillins and cephalosporins), which are not easily analysed by GC–MS. And so, on balance, I find that the LC–MS set-up using positive-ion electrospray ionization permits me to analyse the vast majority of samples encountered.
Figure 1 shows the LC–MS chromatogram obtained when analysing a suspected counterfeit antimalarial. The correct active pharmaceutical ingredient has a nominal mass of 499, so it should give an [M+H]+ peak at 500. The major peak in the LC–MS chromatogram, however, shows an [M+H]+ at 152. That the acetonitrile adduct ion appears at m/z 193 increases the probability that m/z 152 represents the protonated molecule. The chromatogram offers no evidence for the presence of m/z 500. Indeed, it shows only one major chromatographic peak. At retention time of 2.8 min, that peak is probably the substitute, active pharmaceutical ingredient.
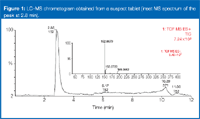
Figure 1
"I performed the analysis on a quadrupole, time-of-flight, tandem mass spectrometer (Qq-ToF) capable of accurate mass measurement. The next task was determining the elemental composition for the substitute, active ingredient — in this instance for the peak at m/z 152." Most instrument software calculates possible elemental compositions, possibly using all the elements of the periodic table. In practice, however, you would set limits on the elements you would consider. You can exclude some of them because they are rarely encountered in pharmaceutical and/or organic molecules. You can exclude others on the basis of the isotope pattern observed for the protonated molecule at m/z 152. For instance, most metals have multiple isotopes, and you would observe an isotope envelope in the mass spectrum of the substitute, active pharmaceutical. The same applies to some halogens: for example, Cl and Br, which are frequently encountered in pharmaceutical molecules. These halogens evidence a characteristic isotope pattern: for example, Br isotopes are 79 Br and 81 Br and have a ratio of about 1:1. Similarly, the isotopic ratios of chlorine and sulphur are, respectively, 35 Cl to 37 Cl = 3:1 and 32 S to 33 S to 34 S = 100:1:4.
As discussed in previous columns, how the accurate mass of an ion in a mass spectrum is measured is very important. The better the accuracy, the fewer the possible elemental compositions. Figure 2 shows (we have used this one in previous discussions in this column) the number of elemental compositions possible with a mass accuracy of between 1 ppm and 5 ppm when considering only the elements of carbon, hydrogen, nitrogen and oxygen (C, H, N, O). Obviously, the number of possibilities increases exponentially with mass.
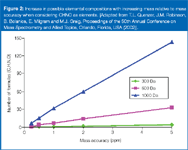
Figure 2
Setting realistic boundaries when calculating elemental compositions is crucial. If you set the limits too tightly, you can miss the correct elemental composition; setting the limits too loosely leads to the Herculean task of determining the correct elemental composition. You must therefore know your instrument's capabilities well. Employing the restrictions dictated by Figure 2, using a medium resolution typical of Q-TOF instruments (7000–17000 FHHW), a limit of 2 mDa could be sufficient if the measurement were made in conditions conducive to "optimal" operating conditions for good mass accuracy. (Note: optimal conditions would be correct ion abundance, adequate calibration of the instrument, and the use of an internal reference to perform the mass measurement.) For higher resolution instruments, such as FT, tighter limits of 0.5 mDa could be reasonable.
To illustrate, consider the example where the nominal mass of a substitute, active pharmaceutical ingredient is 151, and the protonated molecule was mass measured to 152.0679. According to Figure 2, assigning the proper identity should be a relatively easy task because the number of elemental compositions possible for mass 152 should be limited. Elements considered for the elemental composition of the unknown are C, H, N and O, as well as F and S, all of which are frequently encountered in pharmaceuticals. From a quick analysis of the isotope pattern, we know that there is no Cl or Br present. For F, the number of elements is limited to three and for S to one.
Wolff's approach is "to be conservative — that is, to be certain to avoid missing the correct elemental composition, I use a 5 mDa accuracy limit, especially because I cannot often optimize the experimental conditions for best mass measurement (that is, possibly acquiring too high ion abundance). The number of possible elemental compositions for 152.0679 setting a 5 mDa tolerance and considering C, H, N, O, F(3) and S is six. If you increase the tolerance to 10 mDa, the number of possibilities increases to eight (Table 1). Only even electron elemental compositions are considered."

Table 1: Calculated elemental compositions for m/z 152.0679 observed in counterfeit tablet.
Electrospray ionization produces, almost exclusively, either protonated ions or cations (in the latter instance elements such as sodium and potassium need be considered). For other ionization techniques, such as photoionization, it would be wise to consider both even- and odd-electron elemental compositions.
How do you pick the correct elemental composition from this list? Well, you could search for the elemental compositions in the Merck Index or Chemical Abstracts Service (CAS) to determine a correspondence to a readily available commercial compound. By doing so, you would get a hit for C8H9NO2, an elemental composition that corresponds to acetaminophen (paracetamol). However, such an approach would be extremely tedious for higher molecular-weight compounds, returning a vast number of elemental compositions and as Jean-Claude pointed out the counterfeiters do not play by any rules other than "use the cheapest most readily available substitute" so it is wise to be circumspect.
A more scientific and systematic approach consists at looking closer at the isotope pattern in the mass spectrum. This topic has been described in a recent column that focused on the work of Kind and Fiehn.3 Careful scrutiny of the isotope pattern of the ions measured lets you narrow the number of possibilities. Observing the 12 C to 13 C ratio can reveal the number of carbon atoms in an analyte. Naturally occurring carbon contains approximately 1.1% of the 13 C isotope. So an ion containing 10 carbon atoms would display a 13 C isotope peak with an abundance of 11% of the 12 C peak. Similarly, an ion containing 50 carbon atoms would display a 13 C isotope peak with an abundance of 55% of the 12 C peak. A simple ratio measurement, therefore, gives a good indication of the number of carbon atoms present, within the precision of the mass spectrometer, which is typically up to about 15% (uncertainty can be larger because of the peak-centering process).
In the instance currently in question Wolff points out "the peak at m/z 153, which represents the 13 C contribution, has an abundance of about 10% of the m/z 152 peak (the 12 C peak), suggesting about nine C atoms. However, you must allow for some uncertainty because of possible skewing of the isotope pattern, the result of chemical background noise, or the centroid data format. In the end, therefore, you would consider elemental compositions with 8–10 C atoms."
In Table 1, only one elemental composition falls within the 8–10 C atoms range: C8H10NO2, which corresponds to acetaminophen. "You can show that this is the case by plotting the elemental composition of the sample and comparing it with the theoretical isotope pattern of C8H10NO2. Moreover, the isotope pattern of the peak obtained from the sample does not evince the presence of a sulphur atom. In the latter instance, the m/z 154 would be about 4% of the abundance of m/z 152. However, for higher molecular-weight compounds, it can be more difficult to spot 34 S contribution, because the [M+H+2]+ peak also contains the contribution of two 13 C atoms."
Analysing the isotope pattern of the peak led to identifying the substitute, active pharmaceutical ingredient in this counterfeit tablet, namely acetaminophen. To confirm the identity, Wolff said, "I analyse a standard and match the MS spectrum and retention times. For more confidence, or in more challenging instances (higher molecular-weight unknowns), I would register a tandem MS spectrum and measure accurate mass to determine the elemental composition of the fragment (product) ions. Doing so is easier because, at lower mass (or m/z), fewer combinations exist. In the instance discussed so far, fragmentation of m/z 152 gives a major product ion at m/z 110. In a first instance, because I am dealing with ESI, a soft ionization technique, only even-electron elemental compositions are candidates for the product ions. This means that the fragmentation mechanism is essentially based on neutral losses (loss of a neutral molecule), the most common in ESI tandem MS. But if no satisfactory even-electron elemental composition fits the measured accurate mass, you should envisage odd-electron elemental composition. Several papers in the literature describe odd-electron product ion formation.6 In my experience, it arises frequently in electron-rich structures, in molecules that contain more than one S atom, and in molecules that potentially form very stable odd-electron (product) ions."
For m/z 110, only five possible even-electron elemental compositions occur, even with a very conservative 10 mDa mass-accuracy limit (Table 2).

Table 2: Calculated even-electron elemental compositions for product ion m/z 110.0579.
Only one of the five elemental compositions seems probable from a chemical point of view: C6H8NO. No mass spectrometrist or chemist would believe CH8N3O3 or H8N5O2 might be a prospective structure. Those have a double-bond equivalence (DBE) of –0.5, which means they are linear molecules (no ring, no double bond). The double-bond equivalence (calculated based on the valence of the individual atoms–elements in the molecule) can be a useful parameter to apply when narrowing possible elemental compositions. If a product ion, whose elemental composition is determined, has a double bond equivalence of 3.5, as in the present instance, the precursor ion has a similar or higher DBE. It can be slightly lower (1–2 units) when, through the neutral loss, a double-bond or ring structure is introduced in the product ion. Absent that, however, you could set the minimum DBE to the value found in the product ion (for an initial approach). In the instance of acetaminophen the resulting spectrum would leave only two elemental compositions for the protonated molecule m/z 152: C8H10NO2 and C7H7N3F. Having thus far limited the outcomes would leave the molecules that give the closest isotope pattern fit.
Wolff's assessment indicates, "The product ion for m/z 110, C6H8NO, bears no relation with C7H7N3F. But C6H8NO and C8H10NO2 are related via a neutral loss of C2H2O — that is, acetyl — which is a frequent neutral loss in ESI tandem mass spectrometry. The relation between product ions themselves and the precursor ion can help build the unknown molecule from product ions whose elemental composition was determined, a method commonly used to identify structurally related compounds. A known compound, like the active pharmaceutical ingredient, is taken as reference MS–MS spectrum, and the spectra from the impurities are compared to the reference to determine what modifications occurred and where they occurred. If a product ion shows a +14 mass difference when compared with the reference spectrum, that part of the molecule most probably contains an extra –CH2–."
Knowing the elemental composition of product ions can also set a minimum for certain elements in the elemental composition calculations. In the instance of acetaminophen, the m/z 110 product ion would set a minimum of one N atom and one O atom to be present in the precursor. This would actually eliminate C7H7N3F from the original list deduced above and even when discriminating based on DBE. So applying DBE and the minimum-number-of-heteroatoms (N and O) criteria would leave only one elemental composition: C8H10NO2, the correct elemental composition for protonated acetaminophen.
Looking at the parity of the product ions in the MS–MS spectrum could be useful in determining the correct elemental composition and ultimately the structure of a substitute, active pharmaceutical ingredient. Because of the nitrogen rule, an even-number protonated molecule contains an odd number of N atoms, and an odd-number protonated molecule contains no N atoms or an even number. So if in the MS–MS of an odd number protonated molecule even-number and odd-number product ions exist, it is probable that the molecule contains at least two N atoms (the hypothesis being that all product ions are because of neutral losses).
Last, but not least, you might find it useful to decrease the resolution on the mass filtering quadrupole (quadrupole 1 on a triple quadrupole instrument or Qq ToF instrument) to select the whole isotope cluster of the precursor ion and, hence, record the full isotope pattern on the product ions. Doing so obviously helps assign elemental composition to the product ions as described earlier for the precursor ion.
In the instance discussed so far, all approaches led to identifying the substitute, active pharmaceutical ingredient in the counterfeit tablets as acetaminophen, a finding confirmed by recording an MS–MS spectrum for an acetaminophen standard and working out the fragmentation pathway observed (Figure 3).
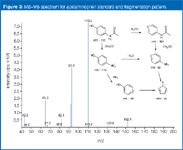
Figure 3
Structure elucidation of a substitute, active pharmaceutical ingredient in a degraded, reconstituted, injectable antibiotic: To illustrate that the methodology described so far applies to a more challenging case and molecule, consider the example of a degraded antibiotic containing a substitute active pharmaceutical ingredient. LC–MS analysis showed that the sample was not a single compound (Figure 4). Obviously the first challenge was to focus on the correct chromatographic peak to be able to determine the active or substitute active pharmaceutical ingredient in the sample. The first hypothesis is that the main chromatographic peak comes from residual of active or is the main degradant. The main chromatographic peak is a result of a compound with a nominal mass of 308, the mass-measured protonated molecule having m/z 309.1282.
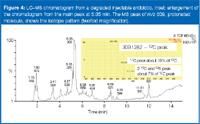
Figure 4
Considering that the molecule might contain C, H, N, O, a maximum of three F and one S and setting a limit of 5 mDa for mass accuracy, the software offers 33 possible even-electron elemental compositions. The best match, in terms of mass accuracy, is C4H18N8O7F, with a DBE of –0.5. Chemically such a molecule is extremely unlikely, if not impossible.
Analysis of the isotope cluster shows that the [M+H+1]+ peak (mainly because of 13 C contribution) represents about 18% of the [M+H]+ peak (the12 C peak). The unknown compound therefore contains about 14–18 C atoms. Moreover, the [M+H+2]+ peak has an abundance of 7% relative to the12 C peak, enough to imply that 34 S (with a relative ion abundance of about 4%) contributes to this peak. So the compound possibly contains one S atom.
Wolff observes "You can more readily obtain information on the presence of an S atom, and even general information on the composition of the isotope cluster, using higher resolution instruments (60000–100000 FHHW) such as FT or Orbitrap (Thermo Fisher)." Indeed, Figure 5 shows the MS spectrum from another compound, analysed at 60000 resolution, where you can clearly see 34 S in the [M+H+2]+ peak (shown in the figure), which is well-separated because of the simultaneous contribution from two 13 C atoms. The figure also shows that m/z 344.1227 is because of the contribution from one 34 S in the molecule, and the peak at m/z 344.1338 is because of the contribution from two 13 C atoms in the molecule. The bottom spectrum is the simulated theoretical spectrum, which shows an excellent match for the isotope ratios and mass accuracy.
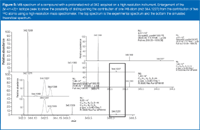
Figure 5
"The isotope cluster analysis shows 14 to 18 C atoms and one S atom for the substitute, active pharmaceutical ingredient with m/z 309. By setting the limits for the carbon atoms and forcing one S atom, the software calculation shows only three possible elemental compositions with a 5 mDa mass accuracy: C15H21N2O3S (0.9 mDa, 6.5 DBE), C17H22O2FS (–4.3 mDa, 6.5 DBE) and C16H19N2F2S (4.5 mDa, 7.5 DBE). If I were less conservative and set the mass accuracy limit at 2 mDa, I would have realized only one hit. Generally, 2 mDa-accuracy is easily achieved on high-resolution mass spectrometers when the ion abundance falls within the detector's saturation limits."
None of the three elemental compositions yielded a hit in the Merck Index, which lists all commercially available drug molecules. Consequently, the main peak in the chromatogram is most probably a degradant. Searching the chemical abstract, C15H21N2O3S (the elemental composition with the best accuracy) gave a match that corresponds to protonated benzylpenilloic acid (Figure 6), a known degradation product of penicillin antibiotics (such as penicillin G).
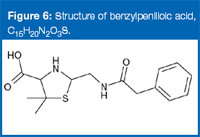
Figure 6
Figure 7 shows the LC–MS chromatograms for a degraded penicillin G standard and the counterfeit sample. The major peaks in the counterfeit sample are present in the degraded penicillin G standard. However, no residual penicillin G could be found in the counterfeit sample. The peaks at 1.9 and 3.4 min are well-known degradation products, both isomers of penicillin G: benzylpenillic acid (C16H17N2O4S) and benzylpenicillenic acid (C16H17N2O4S). From this information you validly can infer that penicillin G (Figure 8) was the substitute active pharmaceutical ingredient in the counterfeit sample, before degradation.
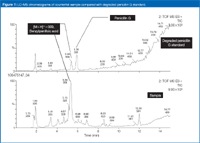
Figure 7
Structure elucidation of substitute active pharmaceutical ingredient where separation is needed besides MS: Some of the degradation compounds were isomers of penicillin G and had exactly the same accurate mass. As Wolff has demonstrated in previous work it is prudent when doing literature searches to determine an elemental composition, to be aware of potential isomers and, for that reason, use a separation technique combined with mass spectrometry to match the identified compound by means of MS or MS–MS and its retention time.7,8
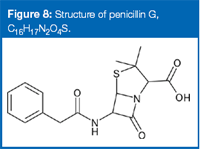
Figure 8
"In the following example I determined the elemental composition of the substitute, active pharmaceutical ingredient as C12H15N4O2S for the protonated molecule (I established the elemental composition as described in the previous examples). Searching the Merck Index for the determined elemental composition, two hits arose for the possible and probable substitute, active pharmaceutical ingredients: sulphamethazine and sulphisomidine (Figure 9). Both compounds are positional isomers.
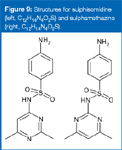
Figure 9
Using the same collision energy, I performed MS–MS on the sample and compared the spectrum obtained to those obtained from the two reference compounds, sulphamethazine and sulphisomidine (Figure 10)."
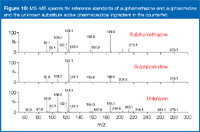
Figure 10
The three spectra are similar. The unknown has a product ion at m/z 213, which is present in the sulphamethazine reference spectrum but not in the sulphisomidine spectrum. The ion abundances ratios of the product ions in the counterfeit sample are more similar to those obtained in sulphamethazine. However, without separation and a matching retention time, it would be rather difficult to confirm with certainty the identity of the substitute active pharmaceutical ingredient in the counterfeit sample as sulphamethazine.
Adopting chromatographic conditions described in the literature for analysing sulphonamides, I easily separated sulphamethazine and sulphisomidine. Sulphisomidine eluted at 2.7 min and sulphamethazine at 5.7 min. The unknown substitute pharmaceutical ingredient in the counterfeit sample matched the retention time of sulphamethazine.
In this instance, direct inlet (probe) EI–MS could not distinguish sulphamethazine from sulphisomidine either. Their EI spectra are very similar. However, in certain situations, library matching of the EI spectra (with NIST library) can be invaluable.
Structure elucidation of substitute active pharmaceutical ingredient by GC–MS using library matching: A last case study shows the advantages of library matching EI spectra. The counterfeit medicine did contain a substitute active pharmaceutical ingredient whose elemental composition had been determined to be C16H14O3 (nominal mass: 254) by accurate mass LC–MS analysis (as described in the previous case studies). A literature search in the Merck Index gave two possible pharmaceuticals for the determined elemental composition: ketoprofen and fenbufen. Wolff, once again drawing on his experience, explains, "Rather than matching retention time and MS–MS spectra of the substitute, active pharmaceutical ingredient with ketoprofen and fenbufen standards in LC–MS, I analysed the sample by GC–MS. The EI spectrum obtained from the substitute, active pharmaceutical ingredient gave a good library match (NIST library) with ketoprofen (Figure 11)." In this instance, GC–EI–MS or even solid probe EI–MS would lead to the identification of the substitute active (unlike in the sulphamethazine/sulphisomidine instance). Performing accurate mass LC–MS would not have been necessary to determine the elemental composition of the substitute active pharmaceutical ingredient.
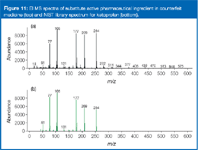
Figure 11
There are a number of ways to maximize the information obtainable from MS and MS–MS spectra. Wrapping the discussions from previous columns of the benefits and limitations of various MS designs to provide accurate mass and the limits and prospects for high resolution characterization, along with detailed experience from a practitioner we can make some concluding statements regarding performing structure elucidation on an unknown compound:
Accurate mass information benefits LC–MS with electrospray ionization and elemental composition determination — the more easily and reproducibly achieved the better Isotope distribution in the protonated molecule isotope pattern is a critical element.
The benefits of EI–MS, using library matching as an alternative approach when a compound is volatile enough to be analysed by EI–MS (mainly GC–MS) is a topic that we have not heard the last of yet.
Acknowledgments
The author would like to thank Dr Jean-Claude Wolff (GlaxoSmithKline) for the numerous discussions on this topic and others over the years — including expert opinions on wine — and for contributing the insight gained in his years of experience to this column.
"MS in Practice" editor Michael P. Balogh is principal scientist, LC–MS technology development at Waters Corp. (Milford, Massachusetts, USA); an adjunct professor and visiting scientist at Roger Williams University (Bristol, Rhode Island, USA); and a member of LCGC Europe's Editorial Advisory Board. Direct correspondence about this column to "MS in Practice", LCGC Europe, Advanstar House, Sealand Road, Chester CH1 4RN, UK or e-mail: amatheson@advanstar.com
References
1. M.P. Balogh, LCGC Eur., 17(3), 152–159 (2004).
2. M.P. Balogh, LCGC Eur., 20(1), 20–24 (2007).
3. M.P. Balogh, LCGC N. Am., 24(8), 762–769 (2006).
4. www.who.int/medicines/services/counterfeit/overview/en/
5. www.gphf.org/web/projekte/minilab/hintergrund_arzneimittelfaelschungen_chart.htm
6. C. Eckers, J-C. Wolff and J.J. Monaghan, Eur. J. Mass Spectr., 11, 73–82 (2005).
7. K.E. Arthur, J-C. Wolff and D.J. Carrier, Rapid Commun. Mass Spectrom., 18, 678–684 (2004).
8. J-C. Wolff, L.A. Thomson and C. Eckers, Rapid Commun. Mass Spectrom., 17, 215–221 (2003).

Separating Impurities from Oligonucleotides Using Supercritical Fluid Chromatography
February 21st 2025Supercritical fluid chromatography (SFC) has been optimized for the analysis of 5-, 10-, 15-, and 18-mer oligonucleotides (ONs) and evaluated for its effectiveness in separating impurities from ONs.


