Comparison of Modelled and Measured Behaviour of Octadecyl Silane (C18) Surfaces in Aqueous and Organic Media
LCGC Europe
The use of dual polarization interferometry (DPI) to measure the behaviour of alkyl-modified surfaces under different solvent regimes is described. The empirically observed and modelled behaviour of grafted long alkyl chain adlayers on a silica surface were in good agreement. The empirical data was also compared with data using analogous systems and these also matched well. This approach has the potential to gain much greater insight into the behaviour of reversed-phase (RP) columns and could help to design column surfaces that are resistant to phase collapse.
Reversed-phase (RP) chromatography is the most widely used mode in high performance liquid chromatography (HPLC). The use of columns coated with alkyl chains combined with variation of the mobile phase (in terms of solvent type, organic solvent content and pH) have provided a highly flexible platform to achieve a wide range of separations. The utility of RP chromatography can be enhanced by adding modifiers such as chiral reagents, surfactants, ion pair reagents or competing bases. The most widely used RP column is the octadecyl silane (ODS) or C18 column which provides a moderately long alkyl chain of 18 carbon atoms.
For solubility reasons, many polar compounds separate better with an aqueous mobile phase and can be retained only with a minimal concentration of organic modifier, sometimes less than 5%. Because the stationary phase in RP chromatography is usually quite hydrophobic — especially when a densely bonded, long-alkyl-chain phase is used — these oil-like phases tend to minimize their surface energy through a tendency to self-associate. The surfaces can dewet in this process, which occurs within the porous structure of the packing material. When this phenomenon occurs, the polar analytes can have trouble partitioning into — or adsorbing onto — the stationary-phase surface because of the poor wettability by water.
From a chromatographic viewpoint, the stationary phase is believed to have collapsed. Wolcott and Doland reported that when a C18 column was washed with water, the bonded phase collapsed.1 Subsequent flushing with mobile phase removed the wash solvent, but the stationary phase remained in the collapsed configuration, which caused a change in retention and selectivity. They advised that washing a reversed-phase high performance liquid chromatography (RP-HPLC) column with water should be avoided. Furthermore, if the organic solvent content of a mobile phase was too low, the stationary phase would tend to collapse onto itself in a low-energy conformation.
Others call this occurrence chain folding or stationary-phase matting. Figure 1 shows a rather simplistic view of this phenomenon.2
The alkyl chains self-associate and minimize the surface energetics. In this condition, retention times are reduced, retention reproducibility drops and tailing becomes an issue because polar eluents find it increasingly difficult to partition into the layer. In addition, once the water has been lost from this highly hydrophobic layer it is very difficult to replace it. Thus once the collapse has occurred it can be a long, slow process to regenerate the surface layer.
The behaviour of long-chain alkyl groups is also influenced by the nature of the support (silica column) surface upon which it is bonded. In the case of Type B silica (which has a relatively low acidity and a relatively homogenous distribution of silanol groups) relatively dense bonding of alkyl chains can be achieved to reduce (but not eliminate) the availability of silanol groups with the mobile phase. Although this can be beneficial by increasing the initial resistance to collapse, once collapse has occurred the surface is difficult to regenerate.
Retention loss and the onset of collapse can be controlled to some extent by the type of bonded alkyl chain, the density of the bonded alkyl groups and the porous nature of the silica used. Short alkyl chains (C3 or lower) rarely collapse, although the relatively low alkyl density tends to lead to the silanol groups dominating the surface behaviour. Diffuse alkyl bonding tends to enable rapid surface regeneration, presumably as a result of the readily available silanol groups on the silica surface.
Theoretical and practical approaches have been adopted to explain and predict the phenomenon of phase collapse.3 It is clear from these studies that once collapse has occurred significant effort is required to reverse the process. The precise nature of the interactions of alkyl chain species with mobile phases and their subsequent collapse is highly significant in the development of RP systems. For example, the available retained volume appears to reach a maximum at a chain length of C10, whilst the resistance to phase collapse is greater for longer alkyl chains (for example C27–C30). Nagae et al.4 and Bidlingmeyer et al.5 proposed that retention behaviour is controlled by the pore size of the support material. In their work it was shown that under 100% aqueous conditions, mobile phase is expelled from the pores of the packing material, which is a result of the decrease in contact angle between the stationary phase and mobile phase.
Spectroscopic studies on phase collapse have been reported by Doyle et al.6 and Henry et al.7 These studies show that changes in the solvent environment do not produce a corresponding change in alkyl conformation.
Clearly a better understanding of these systems would be extremely helpful in the development process.
We have performed a series of preliminary experiments looking at this interesting and, as yet, unresolved problem using the new analytical technique of dual polarization interferometry (DPI) which offers temporal and dimensional resolution and may offer insights into these processes.8,9 In this paper we describe our preliminary results on the comparison of the behaviour of C18 at a silica surface when challenged with water and acetonitrile and compare it with computational models of the solvation processes.
Method
Instrumentation: Measurements of the surface adlayers generated were made in real time using an Ana Light Bio200 dual polarization interferometer (Farfield Sensors Ltd, Crewe, UK). Dual polarization interferometery (DPI) is essentially an interferometer based on slab waveguides, with the reference arm buried beneath the sensing arm. Coherent light broadly illuminates the stack, traversing both waveguides, and upon exiting the structure diffracts into free space.
Because the waveguides are so close together — even within a few hundred micrometres of the end of the stack — the diffracted wavefront generates the well-known pattern of Young's interference fringes in the far-field. Changes in the optical properties of proteins on the surface of the sensing waveguide translate into variations in the interference pattern, as captured by a high-resolution camera.
The optical tolerances are so forgiving that macroscopic movements of the input coupling beam in the order of hundreds of micrometres cause no change in the interference pattern. These loose tolerances allow the stack to be inserted and removed from the optical train without alignment, an essential characteristic for a disposable measurement platform.
For a given measurement of the interference pattern, one can determine an optogeometric parameter for a layer of protein. This parameter will not, however, unambiguously resolve the size or any other structural signature of the protein: A large protein in small number density will produce the same signal as a small protein in large number density.
Resolving this ambiguity requires two simultaneous measurements of the optical properties of the protein in two orthogonal polarizations — transverse magnetic (TM) polarization and transverse electric (TE) polarization— which, because the evanescent fields have two different profiles, can be mathematically converged on a single solution for the protein size and density. Knowing size and density, one can also calculate the total mass, surface concentration, number of protein molecules, molecular footprint, and a host of other useful parameters.
Operating principles: The phase changes of interest, Δφ, involves changes to the effective refractive index (RI) of the mode in the upper (sensing) waveguide (Nr). Changes occurring at the surface do not alter the effective index of the lower (reference) mode (Nr) because the evanescent field of this mode decays rapidly in the region between the two guiding layers. The phase difference is given by:

Where k0 is the free space wave number, L is the interaction length, and ΔNs is the effective index change in the upper waveguide mode. Direct measurement of Δφ is obtained by continuously monitoring the relative phase position of the fringe pattern by performing a Fourier transformation relating intensity to position. The path length is fixed, so one can thus easily convert the experimental data to changes in effective refractive index.
A standard transfer matrix approach provides evaluation of the guided modes for the structure. This allows inclusion of an arbitrary number of layers in a model, each of which is represented by its own layer matrix. Within each layer, with propagation in the z-direction being parallel to the layers and the x-direction being perpendicular, the electromagnetic fields are proportional to:

With ω fixed at the laser frequency, a scan through the propagation constant kz determines the transverse wave vector kx for each sub-layer via:

Where ni is the RI of the ith sublayer (ky = 0). Beginning with an evanescent solution in the region above the top layer of the waveguide structure, one can enforce matching of the tangential components of E and H for the TE and TM modes at each successive interface of the structure. This information yields the values of the coefficients A and B for each layer. A successive approximation method provides the optimum RI value and the thickness (dimension) of the thin protein layer on the surface of the waveguide (see Figure 1).

Figure 1
Instrumentation: The 26 mm × 6 mm slab waveguide is housed in a dual-zone, temperature-controlled enclosure that maintains thermal stability to within 1 mK (Figure 2). The clamping system also provides a fluidic interface to the sensing surface with a dead volume of approximately 2 μL, allowing the introduction of test materials as required. A helium neon laser (λ = 632.8 nm) illuminates the end facet of the slab and a ferroelectric liquid crystal (FLC) halfwave plate switches the state of polarization of the input beam between TE and TM at typical frequencies of 50 Hz. The high tolerance to relative movement of the incident beam comes into play here — the FLC plate produces small refractive displacements during switching but the output image remains stationary throughout.

Figure 2
A 1024 × 1024-element imaging device captures the diffraction fringes and passes the output to a digital signal processor. The image device output is synchronized with the FLC drive signal and sampled. The relative phase position is updated every 2 ms using a spatial Fourier transform (FT) method. Further analysis by PC displays the data and processes it into thickness and RI values for the protein system. Millikelvin thermal control using an autonomous dual-zone control system and the opportunity for averaging yields an rms noise level of around ±0.1 mrad, equivalent to about 0.1pg/mm2 mass loading or less than 0.1 Å dimensional change.
DPI has been used to study protein structure and interactions, as well as surfactants, lipids, and many other interfacial chemistry systems. Researchers have verified the method against other physical measurements such as crystal structures or neutron methods.11,12
The dual polarization interferometer consists of a light source (helium-neon laser, emitting at a wavelength of 632.8 nm), a ferroelectric switch to select plane-polarized light, a sensor chip which comprises two optical waveguides stacked vertically, one on top of the other and an imaging device (camera). The sensor chip waveguides are constructed of silicon dioxide doped with silicon nitride to control their refractive indices and confine light between defined upper and lower boundaries (cf optical fibres). This structure is shown in Figure 2 (the polarizer has been omitted for clarity). Plane-polarized light is fed in to the end of the waveguide stack and therefore at the instant of entry, the light waves in the top and bottom waveguide must be in step (in "phase"). As the adlayer is formed on the top surface of the upper (sensing) waveguide the speed of the light within it is changed. The light in the lower waveguide experiences no such influence and therefore progresses at a constant velocity to provide an optical "reference".
Thus, when the light exits from each of the waveguides, they are no longer in phase. The output light is simply allowed to diverge as it exits from the ends of both waveguides and combine with each other at some distance (in the "far-field"). This leads to interference and the generation of a series of light and dark bands or interference fringes (cf Young's double slits experiment). The precise position of the light and dark bands depends upon the phase relationship of the light as it emerges from the two waveguides. As the adlayer is further modified on the sensor surface the speed of light through the upper waveguide also changes and hence the position of the interference fringes move. The phase changes in, say, TM are deduced from the distance of fringe movement.
A second measurement is obtained when the ferroelectric switch is actuated and a second polarization of light, in this case the TE polarization mode, at right angles to the first is excited fed into the waveguide stack. As the evanescent field profile for the second polarization is different from the first, an independent second measurement can readily be obtained (i.e., the phase change for the same adlayer structure will be different depending upon the polarization used). For either measurement, using classic optical theory, it is possible to calculate a range of the two measurements in terms of a different adlayer thicknesses and densities for the adlayer which would give the same phase response. There is, however, only one possible structure which is common for the two measurements. Using this technique adlayer measurements can be made to sub-atomic resolutions (typically to 0.01 nm) in terms of thickness in real time whilst simultaneously and without further assumption measuring the adlayer's optical density (refractive index). These measurements therefore embody a quantitative analytical technique rather than a simple "sensor" response function, providing absolute measurements that can be related directly to the structure of adlayers formed in close proximity to the sensor chip surface.
In the practical embodiment used in the experiments described below, a fluidic system comprising conventional HPLC components was used. This consisted of a reciprocating pump Knauer K 501 (Knauer, Berlin, Germany) to provide motive force, a 6-port valve Rheodyne 9725i (Rheodyne LLC, Rohnert Park, California, USA) to enable the injection of the desired materials and a diverter valve Anachem V-101T (Anachem Ltd, Luton, Bedfordshire, UK) to enable either or both (simultaneously) of the two sensitive channels on the sensor chip to be addressed. Data generated by the instrument was transferred, in real time, to a PC where the data was viewed and manipulated to provide thickness and density measurements.
The theory underpinning this instrumentation has been described in detail elsewhere.8,9
Experimental
A FB 100 sensor chip (Farfield Sensors Ltd) with a lightly nitrogen-doped silicon dioxide surface and a covalently bound amine functionalization was loaded into the dual polarization interferometer (Ana Light Bio 200) (Farfield Sensors Ltd) and the temperature of the sensor chip and measurement cell was set to 20 ± 0.002 °C. Phosphate buffer solution (PBS, pH 7.4) (Sigma-Aldrich, Gillingham, Dorset, UK) buffer tablets dissolved in HPLC-grade water (Fisher Scientific Ltd, Loughborough, Leicestershire, UK) was flowed over the chip surface at 100 μL/min. A solution of 80% ethanol absolute grade (Fisher Scientific)/20% water HPLC grade (Fisher Scientific) was injected for 2 min and followed by an injection of HPLC grade water for 2 min. This provided a phase change for a known RI change that was used to calibrate the sensor chip structure.
The flow-rate was then reduced to 50 μL/min and acetonitrile (Sigma-Aldrich, UK) was injected for 2 min 45 seconds. The phase transition from the water peak trough to the bulk solution (phosphate buffer baseline or acetonitrile injection) was used to calculibrate the bulk refractive index. Bis(sulfosuccinimidyl)suberate (BS3 ), (Perbio Science, Cramlington, Northumberland, UK), (4 mg/mL in PBS) was injected for 5 min followed by octadecylamine (ODA), (Sigma-Aldrich, UK) in 80% ethanol/20% water (5 mg/mL) for 6 min.
The surface was then rinsed twice with 80% ethanol/20% water to remove excess ODA. Finally, acetonitrile was injected for 3 min to enable the immobilized structure to be measured (according to the baseline shift) in the presence of actetonitrile (by comparison with the first acetonitrile peak) in addition to PBS (according to the baseline shift).

Figure 3
Results and Discussion
Structural analysis at the silica:water (phosphate buffer solution) interface:
Empirically measured behaviour: Figure 3 shows the raw phase data from the two polarization measurements. The regions marked were used to define the chip calibration transition, the bulk calibration transition for PBS and then subsequent "layers" for determining the effect of each injection event on the surface structure. The phase measurements at these points were then "resolved" to determine the thickness and RI and the results are summarised in Table 1.

Table 1: Layer properties measured during the preparation and washing of the ODA layer with PBS buffer solution.
Table 1 provides structure measurements at each stage during the formation of the C18 surface. All the measurements are shown referenced to the amine chip surface. Immediately after the addition of ODA, the data could not be resolved as a result of excess ODA precipitating in the PBS but this was subsequently removed after washing with ethanol to give a combined BS3 /ODA structure of 0.94 nm thick with a RI of 1.396. The same measurement after the acetonitrile injection gave a slightly thicker (1.16 nm) and a reduced RI (1.376) suggesting a relaxation effect and further removal of ODA which was not covalently coupled to the BS3 linker during the acetonitrile wash.
The overall C18 deposited is likely to be an underestimate of the material actually present. This is because the presence of a counter ion and attendant solvation sheath which would be present around the free amine groups present on the sensor surface (those which did not participate in the initial linking of the amino alkyl starting material). This effect could be measured by running a pH ramp to high pH values where the amine functions are deprotonated. However, excursions to such high pH values > pH 11) might potentially compromise the sensor's waveguide surface. An alternative not undertaken in this work would be to use a non-charged surface such as a thiol-based structure.
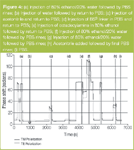
Figure 4
Modelled behaviour: It would appear that no theoretical molecular modelling work has been reported on the effect of phase collapse, perhaps for good reason. To take a simple theoretical slice of silica 3 nm × 3 nm × 3 nm and solvate it in a water periodic box increases the total number of molecules to over 5800. Performing any molecular mechanics or molecular dynamics on such a system, assuming we have the correct tools, requires a large amount of computing power.
Similarly, no theoretical molecular modelling work has been done found on how alkyl phases fold or roll up on themselves under high aqueous conditions and no theoretical molecular modelling work has been done reported on how alkyl phase collapse onto the surface of silica. Again for these calculations a large amount of computing power is required.
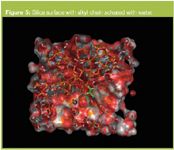
Figure 5
In this work we have taken a very simple theoretical silica surface with an alkyl bonding and modelled the alkyl chain-silica bond angle under high aqueous conditions. The simulation was performed using HyperChem (Hypercube Inc., Gainsville, Florida, USA) by placing a single chain C18 bonded onto a 3 nm × 3 nm × 3 nm silica block and minimized using a combination of molecular mechanics (Flecther-Reeves, Conjugate gradient) and Monte Carlo molecular dynamics in a 5 nm × 5 nm × 5 nm periodic box with TIP3 water has shown how the water molecules can lever the alkyl chain onto the surface of the silica.
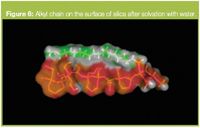
Figure 6
The C18 under this model is in the order of 0.75 nm away from the silica surface at the tip and about 0.6 nm at the base. By relaxing the bond angles around the C6,7,8 carbon atom in the C18 chain the C18 was also found to coil, under 100% aqueous conditions back on itself (Figures 6–7). In Figure 6 the distance of the C18 coil above the surface of the silica is 1.2 nm and in Figure 7 it is 0.98 nm.
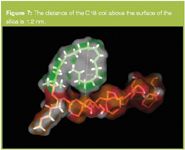
Figure 7
Structural analysis at the silica:acetonitrile interface:
Empirically measured behaviour: The raw data, shown again in Figure 3, can also be analysed to provide the final immobilized structure in acetonitrile (Table 2). The resolved thickness of 4.3 nm is significantly higher than that obtained in PBS indicating that the C18 chains extended out into the bulk solution in acetonitrile but were retracted back in the PBS.

Table 2: Layer properties measured during the washing of the ODA layer with acetonitrile.
Modelling of BS3 Bis(Sulfosuccinimidyl)suberate gives a chain length of 1.1 nm when coupled to ODA gives a combined length of 3.7 nm this compares with a thickness value of 4.3 nm obtained for both the combined BS3 and ODA chains. (Figure 8)
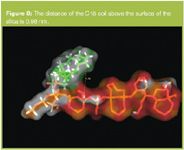
Figure 8
Ellipsometric measurements of self-assembly monolayers of C18 on gold surfaces are in good agreement with the results presented here.13 The reported RIvalues for such layers were 1.40 and the calculated area per molecule was 25 Å2 (as opposed to 31 Å2 in the current study) in which a thickness for the C18 layer was assumed to be 25 Å to calculate the refractive index. With DPI this necessary assumption has been removed because the layer thickness is determined directly.
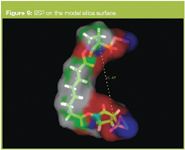
Figure 9
Conclusions
These results demonstrate that dual polarization interferometry can be used as a convenient tool for studying solvation effects on grafted adlayers. A high level of structural information has been presented and although there is some contribution from the amine linker, the thickness values obtained compare well with molecular modelling results for an analogous system.
The use of systems which more closely resemble the chemistry used to fabricate RP columns offers the potential of obtaining a much better understanding of the factors that are important in the phenomenon of phase collapse.
This study is now being extended to directly measure the effects of solutes on the reverse phase. Preliminary results show non-intuitive collapse of the adlayer which will be characterized and reported elsewhere.
Acknowledgement
The authors would like to acknowledge that this work was completed in part with the financial assistance of the Biotechnology and Biological Sciences Research Council (BBSRC) in the form of Small Business Research Initiative contract.
Peter Myers obtained his BSc in pure chemistry from the University of Salford and PhD in maths, physics and chemistry from the same university. He has a sponsored chair at the University of Liverpool and is a visiting professor at the universities of Leeds, York and Chester.
Neville J. Freeman was a cofounder of Farfield and responsible for the development of the technology. He moved to the USA in 2006 as vice president of Farfield Inc., and has established many advocates for the DPI technology in fields such as HIV and cancer research.
Louise L. Peel is an applications chemist at Farfield UK technology centre in Crewe.
Marcus J. Swann joined Farfield UK in 1999 to develop analytical applications. Prior to this, he held a range of academic research posts for more than a decade, working with a wide range of surface analytical methods and with technologies used in measurement and biosensing. He holds a PhD in physical chemistry from Bristol University.
References
1. R. E Majors, LCGC Europe, 15(11), 1009–1015 (1997).
2. T.F. Rustamov et al., J. Chromatogr. A, 913, 49–63 (2001).
3. Y.V. Kazakevich et al., J. Chromatogr. A, 913, 75–87 (2001).
4. N. Nagae, T. Enami and S. Doshi, LCGC Europe, 20, 964–972 (2002).
5. B. A. Bidlingmeyer and A. D. Broske, J. Chromatogr. Sci., 42, 100–106 (2004).
6. C. A. Doyle et al., J. Chromatogr. A, 779, 91–112 (1997).
7. M. C. Henry, L. K. Wolf and M. C. Messmer, J. Phys. Chem. B, 107, 2765–2770 (2003).
8. G.H. Cross et al., Biosensors and Bioelectronics, 19(4), 383–390 (2003).
9. G.H. Cross et al., Journal of Physics D: Applied Physics, 37(1), 74–80 (2004).
10. R. Rapola and T. Horbett, J. Colloid Interface Sci., 136, 480 (1990).
11. G. Cross et al., Biosensors and Bioelectronics, 19, 383 (2003).
12. G. Cross et al., J. Phys. D: Appl. Phys, 37, 74 (2004).
13. M. Sastry, Bull. Mater. Sci., 23(3), 159–163 (2000).

Troubleshooting Everywhere! An Assortment of Topics from Pittcon 2025
April 5th 2025In this installment of “LC Troubleshooting,” Dwight Stoll touches on highlights from Pittcon 2025 talks, as well as troubleshooting advice distilled from a lifetime of work in separation science by LCGC Award winner Christopher Pohl.


