Surfing on Mobile Phase, Part II: Impact of Mobile-Phase Composition Waves on Retention in LC
The most commonly used designs for modern liquid chromatography (LC) pumps produce mobile-phase streams with small short-term variations in mobile-phase composition. Understanding the origin of these variations, and their effects on chromatographic performance, can help us develop more robust methods, and monitoring for this aspect of pump performance is an important step in using the best troubleshooting tool—preventative maintenance.
In the previous installment of “LC Troubleshooting,” I briefly reviewed the operating principles of liquid chromatography (LC) pumps that rely on low- or high-pressure mixing approaches, described how waves of solvent composition can develop in the mobile phase, and explained how these waves can affect detector noise and drift when using UV detection. In this installment, I continue this story by discussing the impact of waves in mobile-phase composition on retention time in reversed-phase LC. As I indicated last month, readers interested in a deeper dive into these topics are encouraged to consider the two books by Kromidas (1) and Snyder and Dolan (2). Both books include chapters dedicated to discussing modern LC pump technology, and they also include details about performance specifications and descriptions of tests that can be used to evaluate pump performance. I also encourage readers to consider perusing through two “LC Troubleshooting” articles by John Dolan in 2006 (3) and 2014 (4), which describe case studies that illustrate what can happen when things go wrong in the pump. These are excellent resources for those looking to add to their LC troubleshooting knowledge.
Impact of Solvent Waves and Pump Parameters on Retention for Isocratic Separations
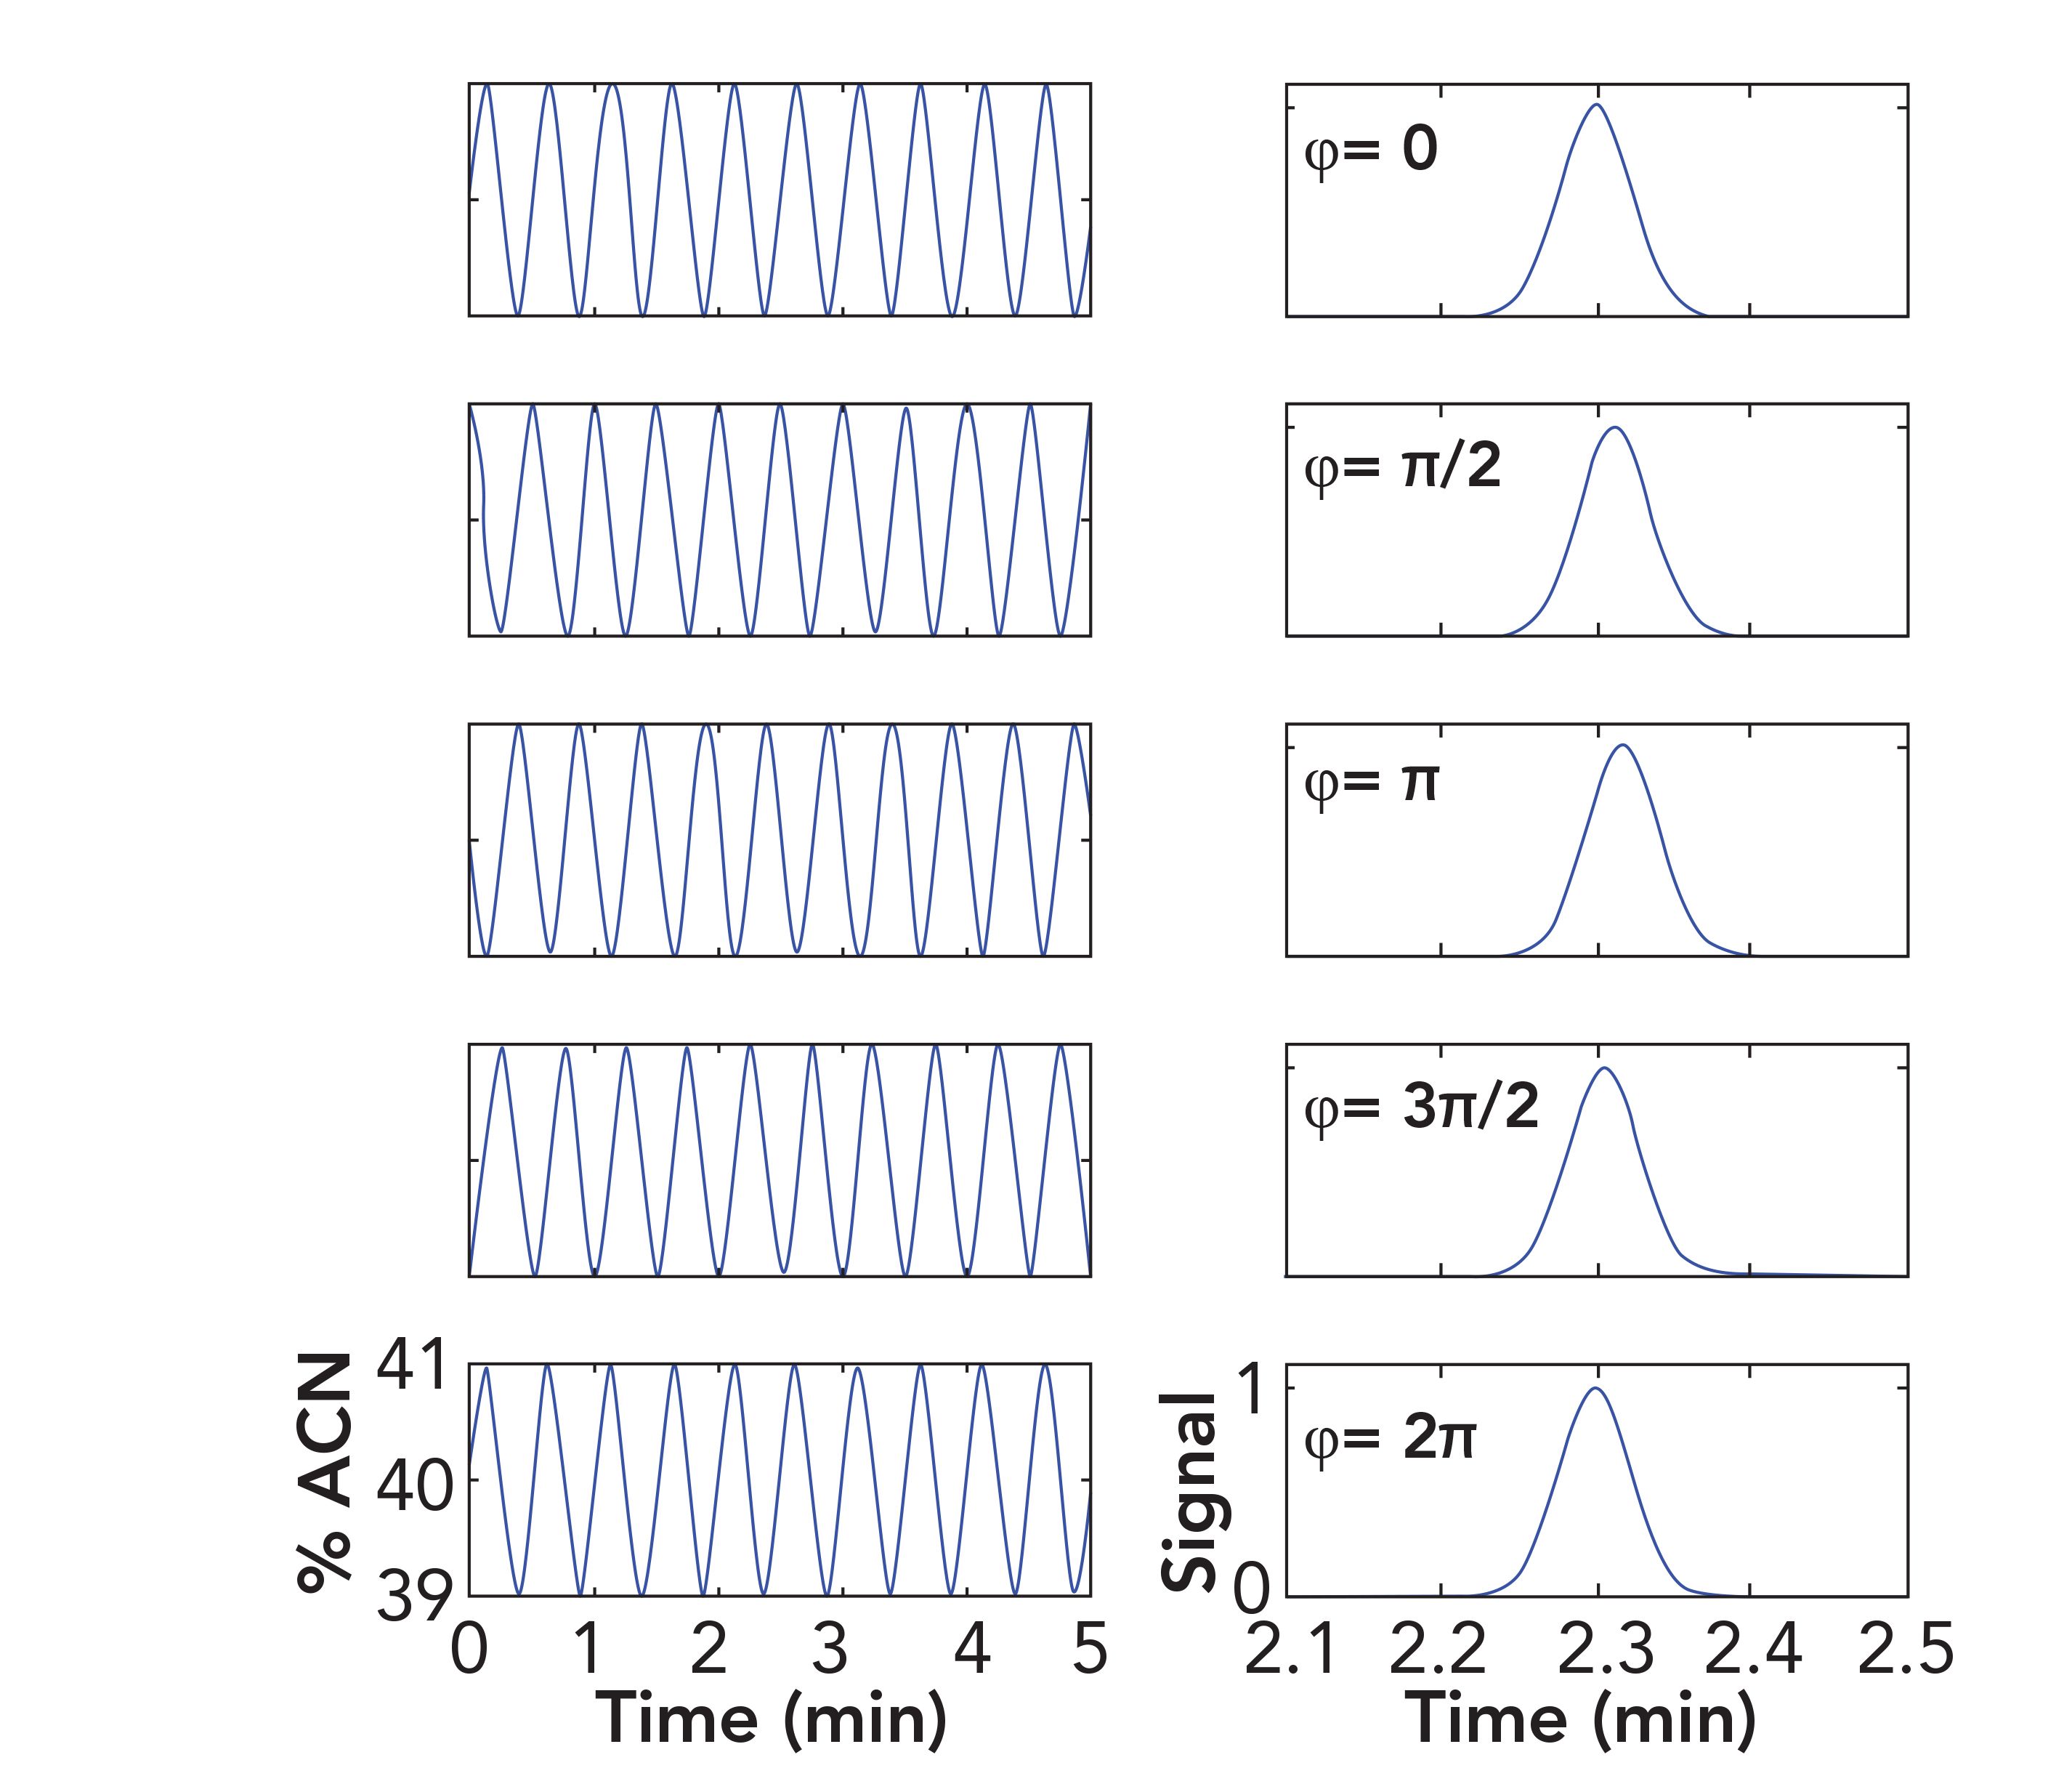
In support of the following discussion, I’ve used relatively simple simulations of analyte transport through a column to demonstrate that these solvent waves can also affect analyte retention in isocratic separations, and that parameters that can be controlled by the instrument user can strongly effect how serious, or not, the effect of the composition waves on retention is. We start with a very simple model for the waves themselves, which is a sinusoid. This is actually a reasonable representation of what happens with a low-pressure mixing pump. Simulating the wave patterns for high-pressure mixing systems require more sophisticated models. In our sinusoid, the frequency of the wave is the flow rate divided by the pump stroke volume (flow/stroke), and the amplitude of the wave is the maximum deviation of the mobile-phase composition from the set point. The family of waves shown in Figure 1 were constructed using an amplitude of 1% acetonitrile and a frequency of 200 μL/min / 100 μL (2 min-1).
FIGURE 1: Effect of mobile-phase composition waves on retention variation under isocratic conditions. Left panels show composition waves that are phase shifted relative to the point of sample injection. Right panels show the corresponding chromatograms that result in each case. Composition waves and chromatograms are simulated using the following conditions: Analyte, acetophenone (LSST parameters are 6.3 and 45 for S and kw, respectively; these were obtained using a C18 column at 40 °C); Column dead volume, 100 μL; Flow rate, 0.2 mL/min.; Pump stroke volume, 100 μL; Composition wave amplitude, 1% acetonitrile. Axis labels for each column of subfigures are given in the bottom subfigure.

The difference between the five sinusoids is that they are phase shifted relative to each other. These parameters (that is, the combination of flow rate and stroke volume) would not be optimal for this type of separation, but they are not completely unrealistic—an amplitude of 1% acetonitrile could be observed in a case where the proportioning valve in a low-pressure mixing system is not working well, or when a too-small mixer is used. One could certainly choose the combination of flow rate and stroke volume to give two strokes per minute, even though that would be a bad idea, for reasons I will explain below.
To simulate the impact of these waves on retention, we need to choose the column dimensions, and know the dependence of the retention of an analyte of interest on mobile-phase composition. For these simulations, I’ve assumed we’re working with a 50 mm x 2.1 mm i.d. reversed-phase LC column with a dead volume of 100 μL. For the retention dependence, I’ve used the linear solvent strength theory (LSST) model for reversed-phase LC separations (2), which relates the retention factor of the analyte (k) to the volume fraction of organic solvent in the mobile phase (φ, 0–1 scale):
ln k = lnkw -Sφ [1]
where the parameters S and kw are the slope of a plot of lnk vs. φ, and the extrapolated retention factor in completely aqueous mobile phase, respectively. Next, we assume that the mobile-phase composition wave travels through the column at the same velocity as the mobile phase (um), and that the velocity of the analyte through the column (ux) is um/(1+k). Given these two velocities, we can calculate where the analyte is inside the column at any given time, and the local mobile-phase composition in the immediate vicinity of the analyte. Finally, we can calculate how far the analyte will move in the next, small interval of time as a result of its velocity that is determined by its local retention factor. We advance the solute by this distance along the axis of the column, recalculate the local retention factor, and repeat the process until the total distance travelled by the analyte is equal to the column length. The time elapsed to get to this point is the retention time.
Figure 1 shows a first set of chromatograms resulting from these simulations. The phase shift of each of the sinusoids relative to the first one at the top is indicated in each row. In chromatographic terms, the significance of the phase shift is that we are simulating the case where an injection of sample is made at a different point on the wave. This will be the case in real experiments unless the LC system is designed to synchronize injections with a certain point on these waves (some systems, but not all, do this). The analyte I chose in this case is acetophenone (LSST parameters are S = 6.3 and kw = 45 for a C18 stationary phase). We see that the chromatograms obtained from the cases where the sinusoid is phase shifted yield a peak with a slightly higher retention, until we get to the point where the wave is shifted by 2π. At this point, the sample is injected at the same point on the wave as in the very first case (at the top), and the resulting retention time is exactly the same. The mean retention time for the first four chromatograms is 2.309 min, the standard deviation is 0.007 min, and the percent relative standard deviation (RSD) is 0.3%. If the amplitude of the waves is larger than 1% acetonitrile because of a poorly functioning proportioning valve (low-pressure mixing) or poorly functioning check valves (high-pressure mixing), then the retention precision could be much worse (that is, higher RSD) because of these waves. If the amplitude is smaller than 1% because the pump has a low composition ripple or because a large mixer is used, then the retention precision could be much better (lower RSD).
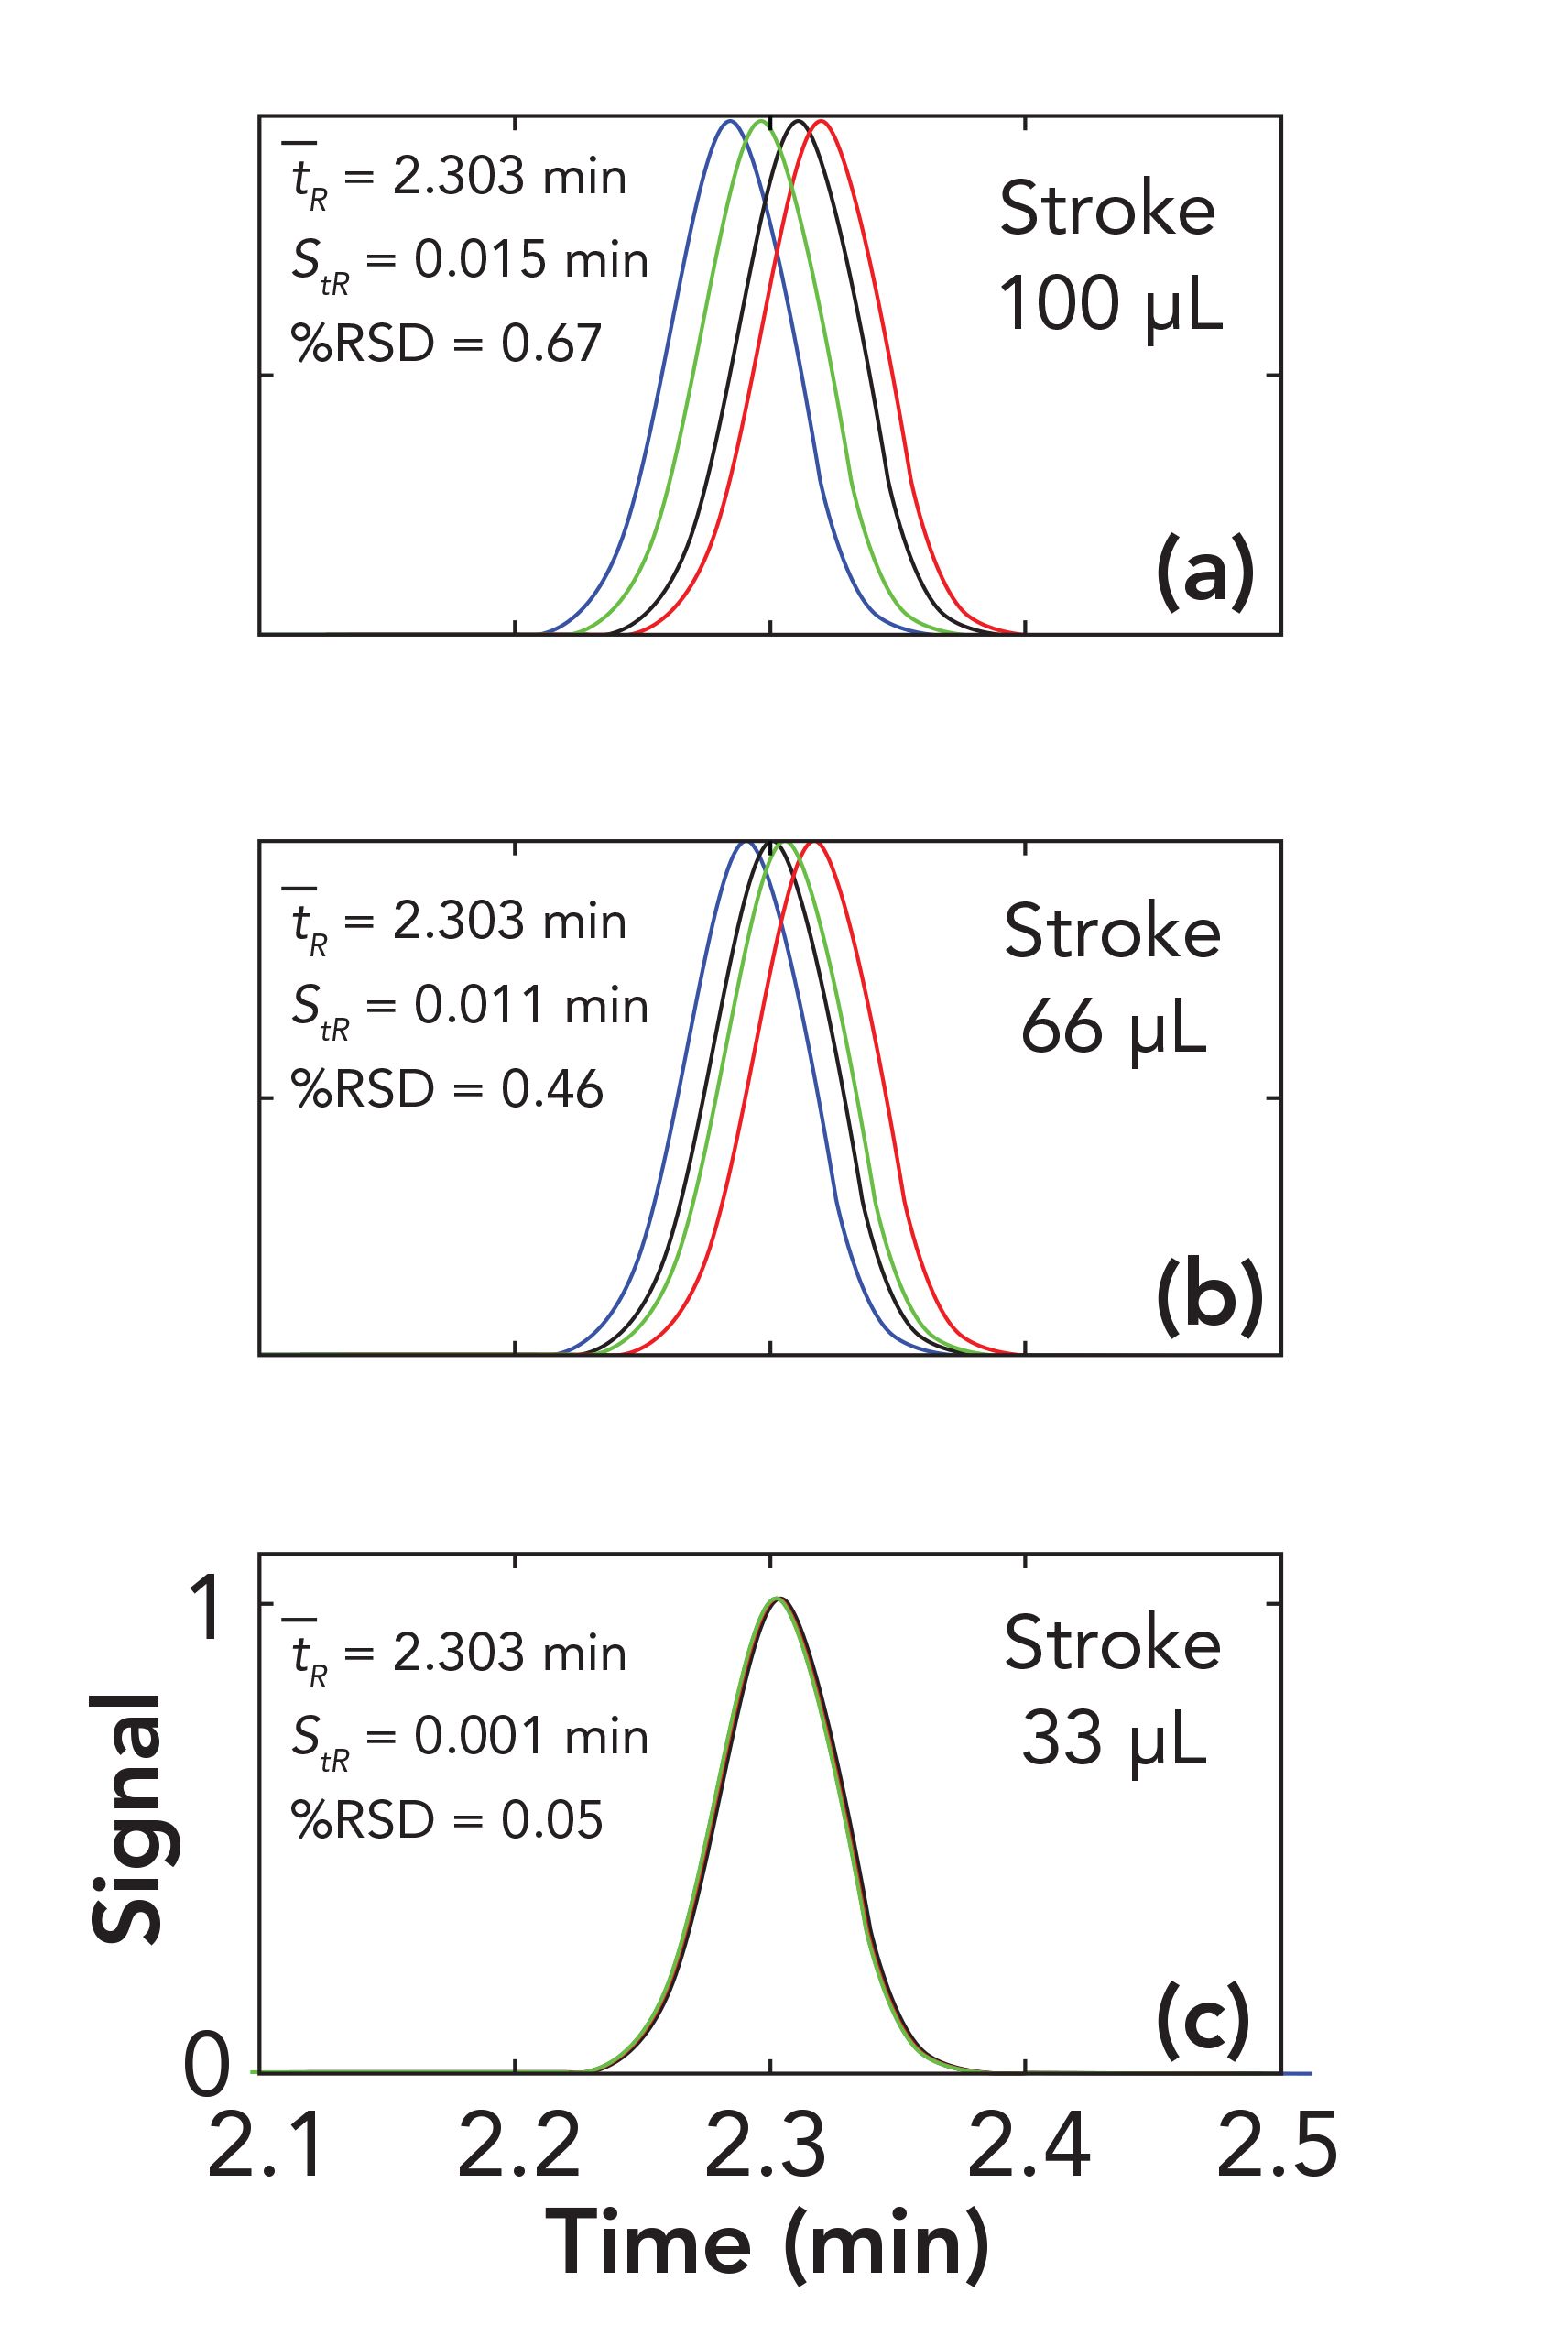
In the next set of simulations, I used the same parameters as in Figure 1, but changed the wave amplitude to 2% acetonitrile so that we can easily see the dependence of retention precision on stroke volume (more specifically, stroke frequency). Figure 2 shows overlays obtained for simulations with waves phase shifted by 0, π/2, π, or 3π/2, and stroke volumes of 100, 66, or 33 μL. One of the main conclusions of the recent paper by Gritti (5) describing the effects of solvent waves on baseline quality is that the effects of these solvent waves can be reduced dramatically by increasing the stroke frequency (by increasing flow rate, decreasing stroke volume, or both). We see the same effect here—that decreasing the stroke frequency dramatically improves the retention precision. As the stroke frequency increases, more and more of the variation in retention because of high and low acetonitrile percentage is cancelled out, which leads to the improvement in precision.
FIGURE 2: Effect of pump stroke volumes (a) 100 μL, (b) 66 μL, or (c) 33 μL on retention precision in isocratic separations. Conditions are the same as in Figure 1, except that the composition wave amplitude is 2% acetonitrile. The chromatograms in each overlay resulted from waves phase shifted by 0 (blue), π/2 (black), π (red), or 3π/2 (green). Axis labels for each subfigure are given in the bottom subfigure.

Impact of Solvent Waves and Pump Parameters on Retention for Gradient Separations
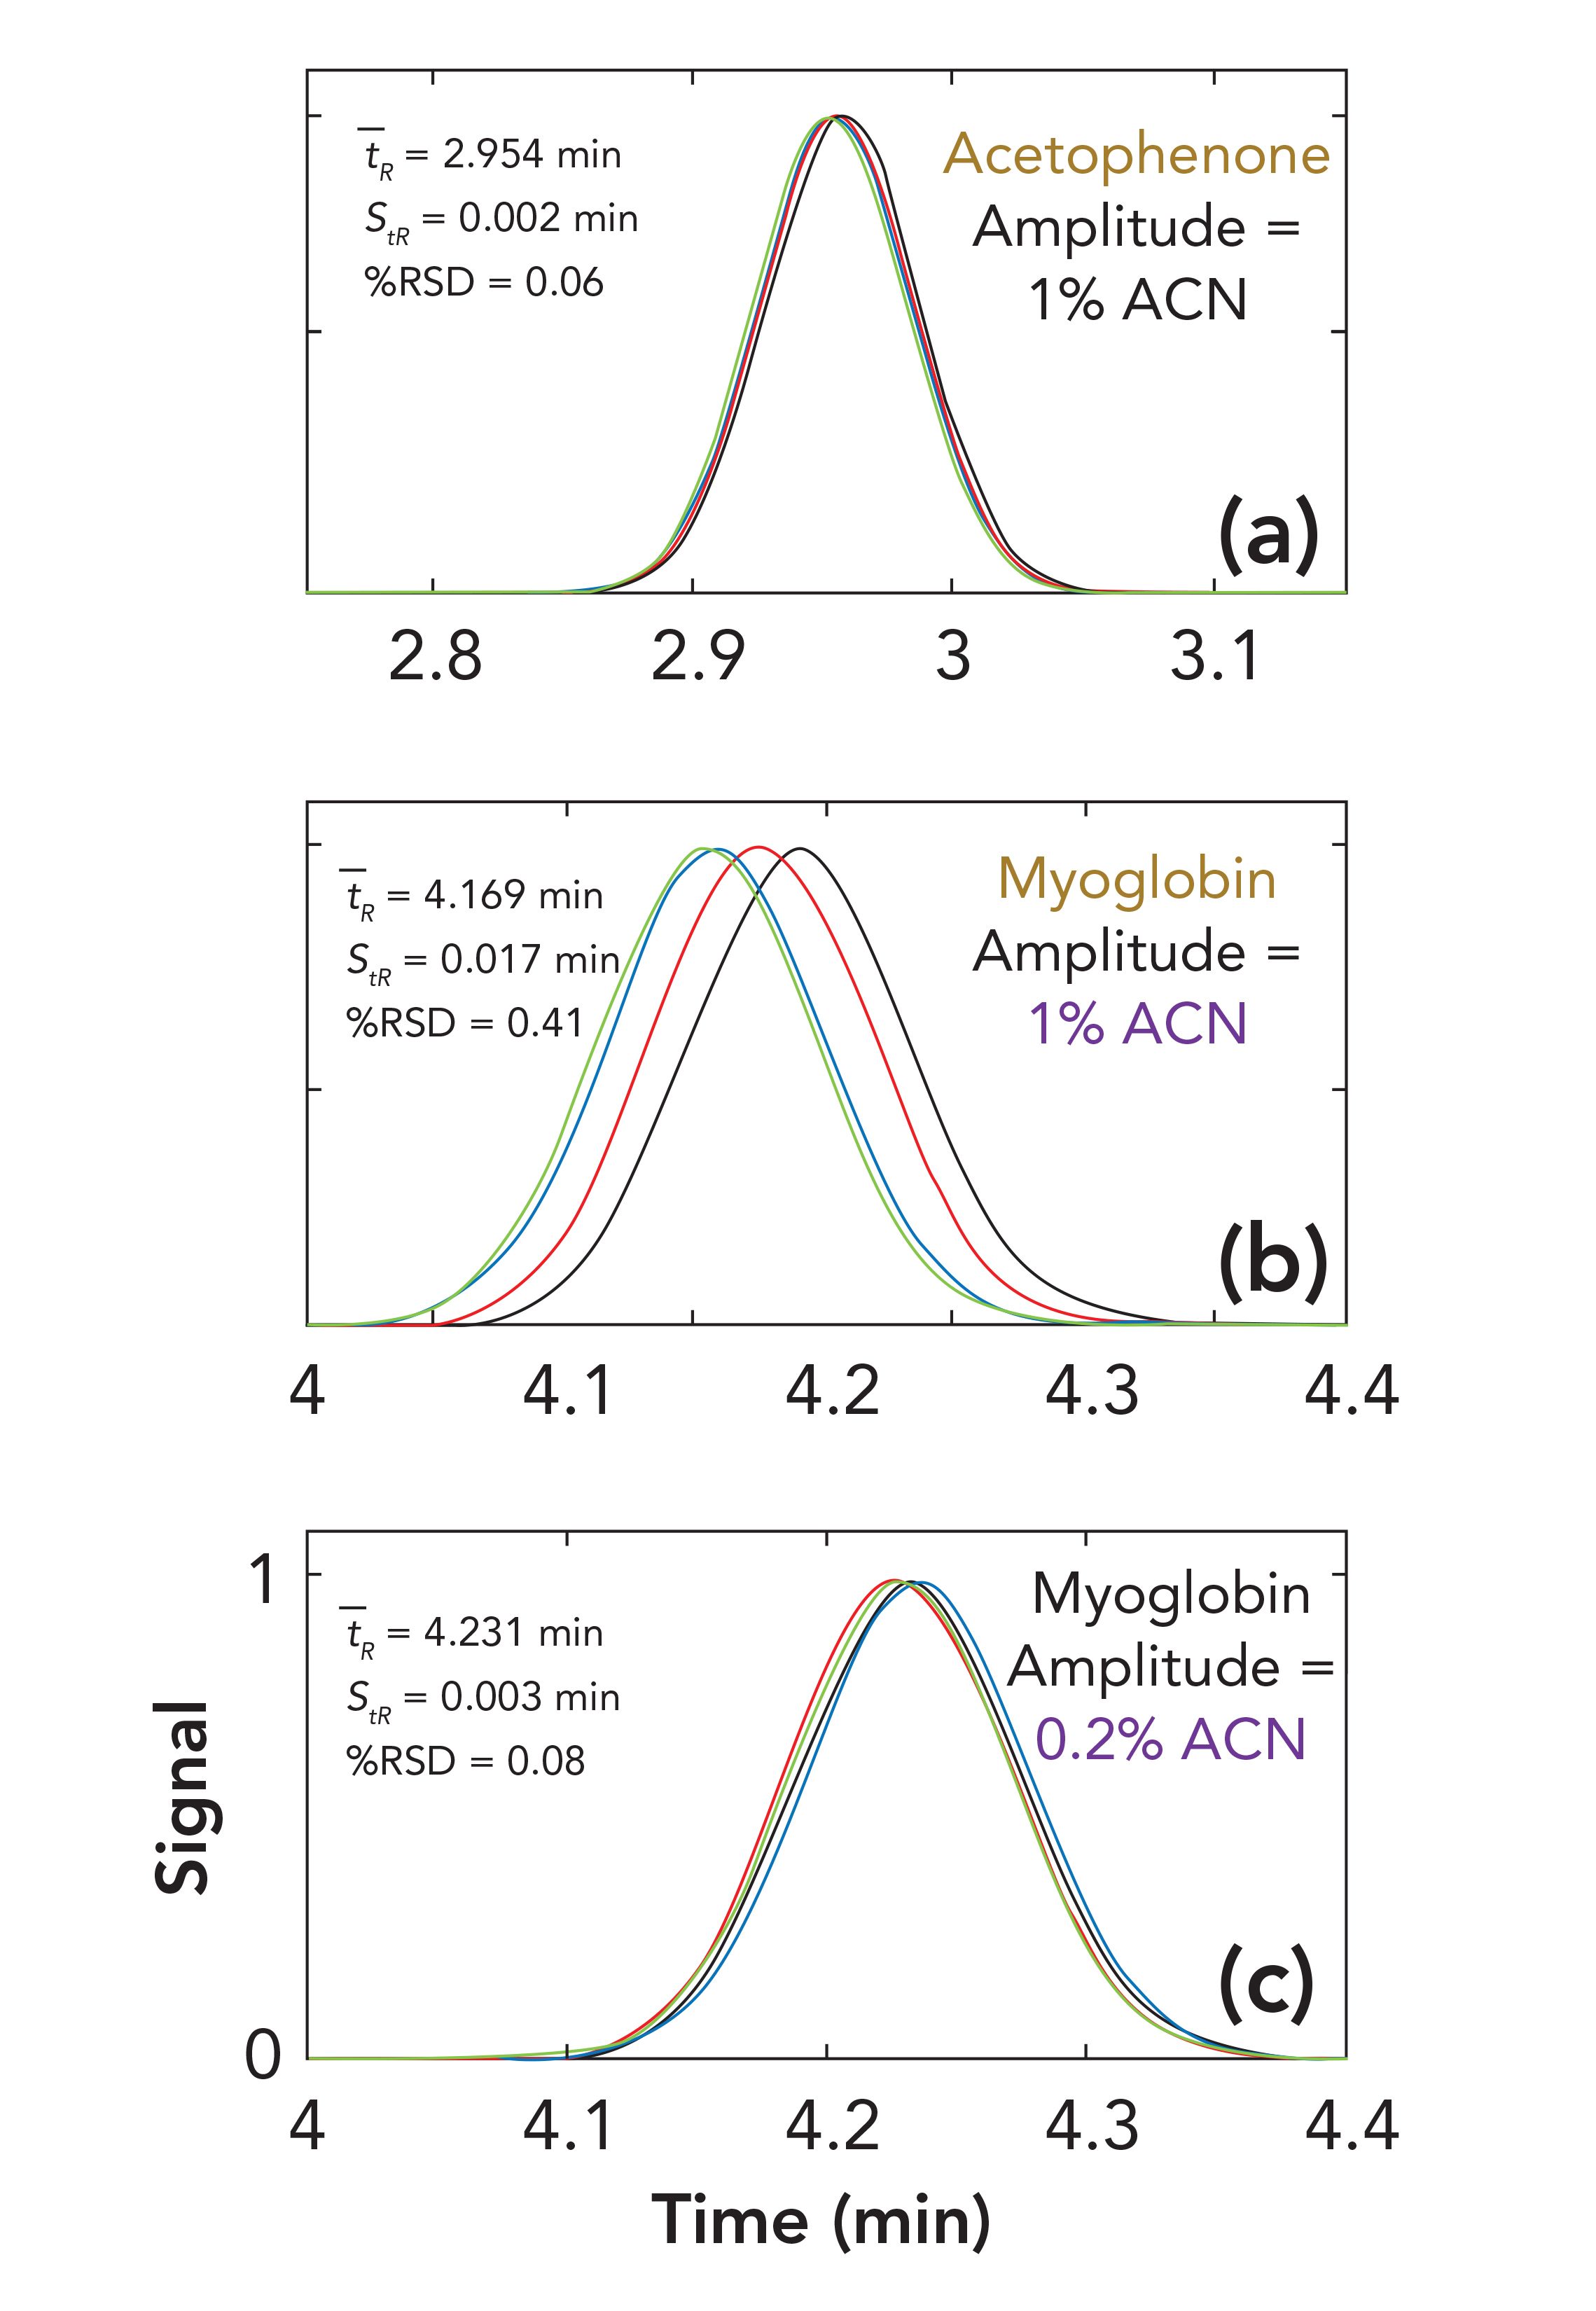
Everything discussed above concerns the effect of solvent waves on retention under isocratic conditions, but we can also examine these effects under gradient elution conditions, by superimposing the solvent wave on a linear increase of the percentage of acetonitrile over time, as in a typical gradient elution experiment. I emphasize again here that this is a pretty simplistic view of what happens inside the column, compared to more rigorous treatments of the situation (5), but this view is nevertheless useful for understanding how these waves can affect chromatographic performance. Figure 3 shows the results of simulations of gradient elution separations with waves phase shifted by 0, π/2, π, or 3π/2. In this case, I fixed the stroke volume at 50 μL, and the wave amplitude at 1% acetonitrile to start. Other conditions are given in the figure caption. The set of chromatograms in Figure 3a is for acetophenone, where we see the retention precision is quite good at 0.06 %RSD. However, it is well known that the retention of larger molecules is much more sensitive to small changes in mobile-phase composition, compared to smaller molecules. Figures 3b and 3c show simulation results for myoglobin, which is a 17 kDa protein with LSST parameters of 53 and 5.5 x 10⁷ for S and kw, respectively (6). If the wave amplitude is fixed at 1% acetonitrile as in Figure 3a, we see that the retention precision is sevenfold worse for myoglobin (0.41 %RSD) compared to acetophenone (0.06 %RSD). However, if we decrease the wave amplitude to 0.2% (see Figure 3c), the retention precision improves dramatically to 0.08 %RSD. This result illustrates the value of a pump design characterized by low mobile-phase composition ripple in demanding applications involving analytes that are very sensitive to mobile-phase composition.
FIGURE 3: Effect of analyte type and composition wave amplitude on retention precision in gradient elution separations for conditions (a) through (c). Conditions are the same as in Figure 1, except that the stroke volume is 50 μL. The gradient time in each case is 5 min: a) 30–50% ACN; b) 25–35% ACN; c) 25–35% ACN. The chromatograms in each overlay resulted from waves phase shifted by 0 (blue), π/2 (black), π (red), or 3π/2 (green). Axis labels for each subfigure are given in the bottom subfigure.

How to Avoid Solvent Waves
Avoiding mobile-phase composition waves starts with the decision about which pumping hardware to buy with your LC system. One of the advantages of a low-pressure mixing system is that it offers the flexibility of accessing four different solvents within a single LC method; these can be used as different pairs of solvents, or for making ternary (three component) or quaternary (four component) mobile phases. One of the prices paid for this capability, though, is that this design will produce composition waves, and relatively large mixers are needed to smooth out these waves, particularly for applications that require high quality detector baselines and good retention precision. Specifications for mobile-phase composition for modern pumps based on this design are typically on the order of 0.2 %RSD. On the other hand, pumps based on a high pressure mixing design tend to have tighter specifications for mobile-phase composition, even without the use of large volume mixers. These pumps also tend to be more expensive. So, one should carefully consider these tradeoffs at the point of purchasing an instrument.
Once the instrument is on the bench, one should periodically check the pump performance to see how it is doing in terms of the composition ripple. For modern pumps, there is usually a diagnostic test accessible through the instrument control software that enables automated execution of a method to measure the composition ripple, and assessment of the results (something like a “gradient composition test”). This test usually involves replacing the LC column with a restriction capillary and spiking one of the mobile-phase components with a tracer that can be detected by UV absorbance (something like acetone in water). Details on this topic are referred to previous “LC Troubleshooting” columns (3,4), as well as the books referred to earlier in this column (1,2).
Summary
In this column and last month’s “LC Troubleshooting” installment, I have reviewed the operating principles of modern LC pumps based on low- and high-pressure mixing designs, and explained how these pumps produce mobile phase streams with small short-term variations in mobile phase composition. These composition “waves” can negatively affect detector baseline quality and retention time variability. If the characteristics of the mobile phase waves and retention properties of an analyte of interest are known, it is straightforward to estimate the impact of the waves (and associated instrument parameters, such as flow rate and pump stroke volume) on retention precision. We see that choices for some parameters, such as the pump stroke frequency, can have a dramatic impact on retention precision, and thus it is important to pay attention to these details, particularly for demanding applications involving compounds that are sensitive to small changes in mobile phase composition. Finally, the composition ripple is a metric that is pretty easy for any user to evaluate; this should be done regularly so that indications of degrading pump performance can be caught early and addressed before they lead to a serious dropoff in method performance (for example, measured by retention variability that is too high).
References
(1) S. Kromidas, Ed., The HPLC Expert II: Find and Optimize the Benefits of Your HPLC/UHPLC (Wiley-VCH, Weinheim, Germany, 2017).
(2) L.R. Snyder and J.W. Dolan, High-Performance Gradient Elution: The Practical Application of the Linear-Solvent-Strength Model (John Wiley, Hoboken, New Jersey, 2007).
(3) J.J. Gilroy, and J.W. Dolan, LCGC N. Am. 24, 662–667 (2006).
(4) J. Chow and J.W. Dolan, LCGC N. Am. 30, 312–318 (2012).
(5) F. Gritti, J. Chromatog. A 1633, 461605 (2020). https://doi.org/10.1016/j.chroma.2020.461605.
(6) A. Vaast, E. Tyteca, G. Desmet, P.J. Schoenmakers, and S. Eeltink, J. Chromatog. A 1355, 149–157 (2014). https://doi.org/10.1016/j.chroma.2014.06.010.
Dwight R. Stoll is the editor of “LC Troubleshooting.” Stoll is a professor and the co-chair of chemistry at Gustavus Adolphus College in St. Peter, Minnesota. His primary research focus is on the development of 2D-LC for both targeted and untargeted analyses. He has authored or coauthored more than 75 peer-reviewed publications and four book chapters in separation science and more than 100 conference presentations. He is also a member of LCGC’s editorial advisory board. Direct correspondence to: LCGCedit@mmhgroup.com.


Polysorbate Quantification and Degradation Analysis via LC and Charged Aerosol Detection
April 9th 2025Scientists from ThermoFisher Scientific published a review article in the Journal of Chromatography A that provided an overview of HPLC analysis using charged aerosol detection can help with polysorbate quantification.
Removing Double-Stranded RNA Impurities Using Chromatography
April 8th 2025Researchers from Agency for Science, Technology and Research in Singapore recently published a review article exploring how chromatography can be used to remove double-stranded RNA impurities during mRNA therapeutics production.


