Structure-Molecular Weight Relationships of Synthetic Polymers
The Application Notebook
The physical properties and behavior of polymers depends strongly on the properties of the polymer molecules themselves
The physical properties and behavior of polymers depends strongly on the properties of the polymer molecules themselves. This in turn means that the polymer properties will also have an impact on the properties of finished products made from or containing polymers. The molecular weight and molecular weight distribution, molecular size, intrinsic viscosity, and structure all affect how the polymer material will behave. Gel permeation or size-exclusion chromatography (GPC/SEC) allows you to investigate the properties of synthetic polymers and generate a Mark-Houwink (MH) plot, a representation of the structure-molecular weight relationship generated by plotting molecular weight (MW) against intrinsic viscosity (IV).
Polystyrene (PS), polymethylmethacrylate (PMMA), polycarbonate (PC), and polyvinylchloride (PVC) were all separated using two Viscotek T6000M columns and a mobile phase of stabilized THF. An OMNISEC system with UV, RI, light scattering, and viscometer detectors was used to measure the molecular weight, intrinsic viscosity, and structure of each synthetic polymer.
Results and Discussion
Table I summarizes the calculated data for all four samples showing the absolute molecular weights calculated directly from the light scattering detector using the appropriate dn/dc for each of the polymer types. The system gives values for the measured IV and hydrodynamic radius (Rh) as well as other parameters including the average MH and log k values. From this we can clearly see the differences between the polymer types. For instance, PVC has the highest IVw value but the second lowest Mw value. However, looking at the average values for broad polymers does not always give a complete picture of their differences so it is better to look at the structure across the whole MW distribution using the MH plot.

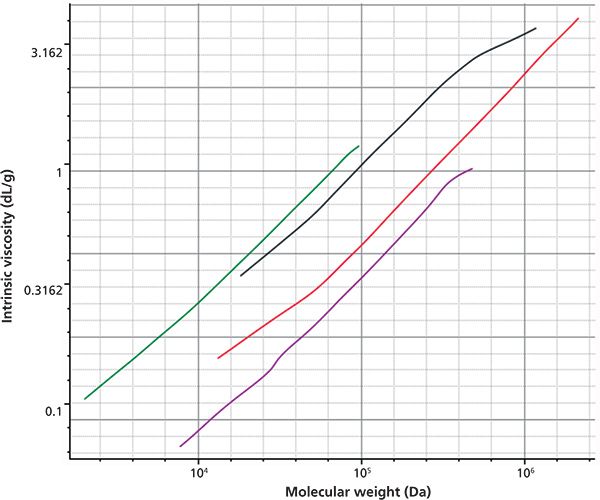
The Mark-Houwink plot of all four polymers shown in Figure 1 clearly shows the structural differences. PMMA is lowest on the plot indicating that it has the highest density in solution, with PS being slightly higher and therefore less dense than the PMMA. PVC and PC have intrinsic viscosities that are much higher than PS at any given MW, indicating more open and less dense structures.

Figure 1: Mark-Houwink overlay of all four polymer samples showing the structural differences. Polystyrene (red), PMMA (purple), polycarbonate (green), and PVC (black).
Conclusion
These four common polymers were analyzed fully and in detail using the OMNISEC GPC/SEC system. The combination of absolute MW values and IV data allows simple access to the powerful MH plot. The data this plot delivers is of utmost importance to all polymer chemists who want to understand polymer differences or trends in terms of molecular weight and structural changes independently from each other. In practice, these differences might be visualized and compared between different batches of polymer or production processes to identify samples with the most desired molecular properties such as branching level or molecular weight distribution. These, in turn, will have the desired bulk properties in their final uses.

Malvern Instruments Ltd.
Enigma Business Park, Groveland Road, Malvern, UK
Tel: +44 (0) 1684 892456 E-mail: salesinfo@malvern.com
Website: www.malvern.com


.png&w=3840&q=75)

.png&w=3840&q=75)


.png&w=3840&q=75)


.png&w=3840&q=75)


