Statistics for Analysts Who Hate Statistics, Part VI: Derringer Desirability Functions
LCGC North America
Derringer desirability functions are a great favorite of mine because they are very simple and flexible. They may be applied to a variety of problems: whenever you need to select the “best” (sample, method, operating conditions etc.) from a set. It is also a convenient way to compare apples and oranges, whenever totally unrelated features must be ranked. They were first described by Derringer and Markham1 to select polymeric materials based on varied properties.
Derringer desirability functions provide a simple way to define “the best” of anything. They are very flexible and can adapt to many situations, as the analyst is the one who decides on which criteria should matter, and how much they should weigh on the final decision.
Derringer desirability functions are a great favorite of mine because they are very simple and flexible. They may be applied to a variety of problems: Whenever you need to select the “best” (for example, sample, method, or operating conditions) from a set. It is also a convenient way to compare apples and oranges, whenever totally unrelated features must be ranked. They were first described by Derringer and Markham (1) to select polymeric materials based on varied properties.
I will start, as usual, with a simple problem from real life. Imagine a woman looking for the best partner. She registers on a website to meet a soul mate. She may define many criteria that the future elected person shall comply with: Right size to match hers (d1), salary (d2), place of residence related to hers (d3), and so on.
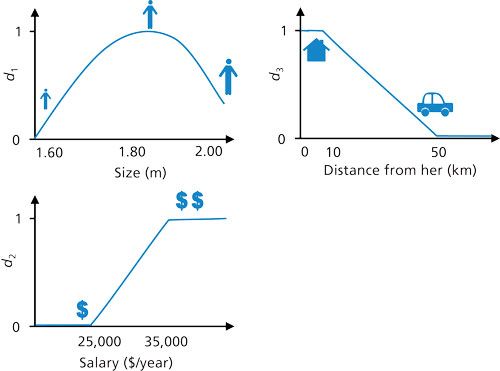
Secondly, you will define a mathematical function for each of these criteria (Figure 1). Don’t fret, this should not frighten you because they can be the simplest functions. The function can be defined as you wish. For instance, this woman does not necessarily want a very tall man, but one with a height around 1.80 m, so this is a reversed U-shaped curve (d1): A man with just the right height will have a d1 score of 1, while anyone with smaller or larger height will have an inferior score. She is also clearly excluding men she judges too short. Regarding salary, she would like to make sure the elected man has enough for her taste, and if he has more, even the better, but all salaries above her minimal demanding range receive the same score. Below her minimal requirement, they will all have a zero score for the d2 function. Finally, for the location related to hers, she would prefer to find someone living close by as she does not intend to change jobs and move to another place, but above a certain distance the d3 score is degraded. Too long of a distance is not favored with a zero score.


Figure 1: Derringer desirability functions to define the best partner to a challenging woman: d1, the right size to match hers; d2, salary; and d3, location related to hers.
When you will have defined all di functions, calculate the di values for each of the observations you are comparing (samples, methods, and so on). Check the existence of correlations between your di functions, because redundant functions should be discarded.
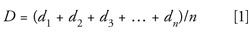
Then, for each object, you will calculate the overall Derringer function as the arithmetic mean or geometric mean of all di functions:


Alternately, you could decide that some criteria are worth more than others and “weight” them differently. For instance, to my lonely lady, salary may be the most important criterion so she may choose to multiply the impact of the d2 score.
Finally, the “best” object is the one with the largest D value. Clearly, the geometric mean is more penalizing than the arithmetic one, because any zero score on a di function will yield an overall zero D score.
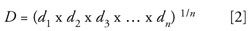
Table I presents the example of four candidates evaluated by this demanding woman. You can first see their features (size, salary, and distance from her) then the translation of these figures into di scores. Finally, the calculation of D score according to two formulas indicates which is the best suited to her. You can see that poor Tom is excluded because of his low salary, although he complied very well with her other requests. John is clearly the man of her dreams, ranking first with both calculation methods.

Let us now look at a chromatography problem. For example, you are developing a separation method for a complex sample containing an unknown number of substances. You have made several attempts at optimizing your method but need a decision criterion to choose the best one. First, you need to define the criteria that matters the most to define the “best.” The most important features could be minimal analysis time (d1), largest number of peaks observed (d2), resolution of particular couples of analytes that are most important (d3), overall or specific detector response (d4), and so on.
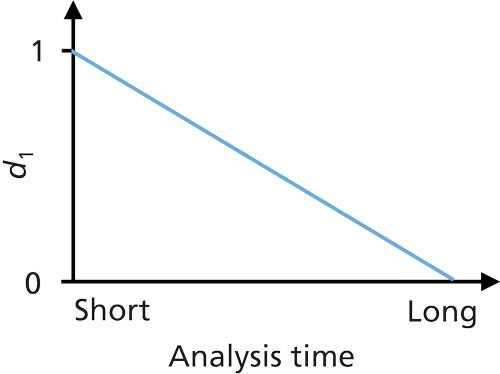
Each of these criteria may then be defined by a “function” as described above. For example, if you want a fast method, the one that provided the shortest analysis time will have a d1 function close to or equal to 1, while the method providing the longest analysis time will have a d1 function close to or equal to 0 (Figure 2). Basically, you are translating chromatographic data into significant figures (2,3).

Figure 2: Derringer desirability function to define the fastest method.
I have often found Derringer functions to be extremely useful. You may however point out that this is a very subjective way to decide on “the best,” and you would be right.
References
- G.C. Derringer and R.L. Markham, J. Appl. Polym. Sci. 30, 4609–4617 (1985).
- E. Lemasson et al., J. Chromatogr. A1408, 217–226 (2015).
- E. Van Gyseghem et al., J. Pharm. Biomed. Anal.41, 751–760 (2006).
Caroline West is an associate professor at the University of Orleans in Orleans, France. Please direct correspondence to: caroline.west@unive-orleans.fr.


How Many Repetitions Do I Need? Caught Between Sound Statistics and Chromatographic Practice
April 7th 2025In chromatographic analysis, the number of repeated measurements is often limited due to time, cost, and sample availability constraints. It is therefore not uncommon for chromatographers to do a single measurement.

Fundamentals of Benchtop GC–MS Data Analysis and Terminology
April 5th 2025In this installment, we will review the fundamental terminology and data analysis principles in benchtop GC–MS. We will compare the three modes of analysis—full scan, extracted ion chromatograms, and selected ion monitoring—and see how each is used for quantitative and quantitative analysis.

Rethinking Chromatography Workflows with AI and Machine Learning
April 1st 2025Interest in applying artificial intelligence (AI) and machine learning (ML) to chromatography is greater than ever. In this article, we discuss data-related barriers to accomplishing this goal and how rethinking chromatography data systems can overcome them.


