Simultaneous Determination of Amlodipine and Atorvastatin in Tablet Formulations and Plasma using Capillary Electrophoresis
LCGC Europe
Capillary electrophoresis (CE) with a UV photo-diode array (DAD) detector was used in a new method to detect the assay of amlodipine besylate (AML) and atorvastatin (ATO) in pharmaceutical formulations and human plasma.
Capillary electrophoresis (CE) with a UV photodiode-array detector (DAD) was used for the assay of amlodipine besylate (AML) and atorvastatin (ATO) in pharmaceutical formulations and human plasma. The limit of detection (LOD) was 0.05 mg/L and the limit of quantitation (LOQ) was below 0.1 mg/L. The validation of the method showed acceptable accuracy as well as intra- and inter-day precision in pharmaceutical formulations and human plasma. The method can be applied in pharmaceutical applications for quality control and in the clinical laboratory for therapeutic drug monitoring.
Introduction
The preparation of new combinations of drugs in pharmaceuticals for pharmacological activity development, as well as the requirements of modern industrial-scale pharmaceutical analysis, encourages researchers to develop new and efficient methods for multi-quantification with separation procedures. High performance liquid chromatography is a dominant separation technique, especially in pharmaceutical analysis. However, HPLC does not always fulfill all modern industrial-scale pharmaceutical analysis with respect to consumption of reagents, analysis time and simplicity of instrumentation. As it is a microfluidicbased technology, CE is often simpler, faster, less expensive, uses less reagent and provides better separation efficiency than HPLC. Therefore, the extensive utilization of CE will generate complementary and alternative methods (1).
Amlodipine (AML) besylate, 3-ethyl 5-methyl 2-[(2-aminoethoxy) methyl]-4-(2-chlorophenyl)6methyl1, 4dihydropyridine-3,5-dicarboxylate benzenesulphonate [Figure 1(a)], is a long-acting calcium channel blocker. It is frequently used as antihypertensive and in the treatment of angina. AML acts by relaxing the smooth muscle in the arterial wall, decreasing peripheral resistance and hence reducing blood pressure; in angina it increases blood flow to the heart muscle (2). Atorvastatin (ATO), [R-(R*,R*)]2(4fluorophenyl)-β,-dihydroxy-5-(1-methylethyl) 3-phenyl-4-[9phenylamino)carbonyl]-1H-pyrole-1-heptanoic acid [Figure 1(b)], is a member of the drug class known as statins. ATO inhibits the rate-determining enzyme that produces mevalonate. This lowers the amount of cholesterol produced, which in turn lowers the total amount of lowdensity lipoprotein (LDL) cholesterol (3).

Figure 1: Chemical structure of amlodipine besylate (AMO) and atorvastatin (ATO).
Previously, amlodipine (AML) and atorvastatin (ATO) were given individually to lower blood pressure and to lower cholesterol, respectively. Recently, they were prepared in combination. The new formulation is used to treat most types of high blood pressure (hypertension) and high blood cholesterol. The new combination tablets may provide a more integrated approach to the treatment of cardiovascular risk. Therefore, analytical methods for their separation and quantification in pharmaceutical formulations and in human plasma is desirable for quality control aplocations and therapeutic drug monitoring, respectively. A survey of the literature revealed that no assay method for the simultaneous determination of those two drugs in biological fluids is available. However, some methods were recently provided for their simultaneous determination in drug formulations (4–7). Other methods were provided for single determination, or with other drugs, of AML and ATO in drug formulations and/or biological fluids (8–10).
The present study describes the development and validation of a simple, rapid, sensitive, less expensive CE method that uses less reagent for the simultaneous determination of AML and AOT in tablet formulations and plasma. Single-step liquid-liquid extraction was used for extraction of human plasma samples, which involves protein precipitation. Many CE aspects including separation, sensitivity, rapidity and repeatability were developed.
Material and Methods
Chemicals, reagents and pharmaceuticals: Chemicals and reagents used in this work were of analytical grade and 18 MΩ deionized water was used in all experiments. Amlodipine, atorvastatin, cellulose, magnesium stearate, starch and talc were supplied from Sigma-Aldrich (St. Louis, Missouri, USA). Organic solvents including acetone, acetonitrile, ethanol and methanol were purchased from Merck (Darmstadt, Germany). Acetic acid, boric acid, phosphoric acid, sodium acetate, sodium tetraborate decahydrate, sodium dihydrogen phosphate and sodium hydroxide were also supplied from Sigma-Aldrich (St. Louis, Missouri, USA).
Amlor tablets (5 mg and 10 mg AML) and Lipitor tablets (10 and 20 ATO) were obtained from Pfizer (New York, USA) and Gödecke AG (Germany), respectively. Caduet tablets (5 mg and 10 mg AML and 10 mg and 20 mg ATO) were supplied by Novartis (Basle, Switzerland).
25 M phosphate buffer was prepared by dissolving 1.675 g of sodium phosphate dibasic heptahydrate by 200 mL of water. The pH was then adjusted by phosphoric acid and measured by a pH-meter. Once the desired pH was reached, the solution was transferred to a 250 mL volumetric flask and filled to the mark.
Instrumentation and software: A P/ACE MDQ CE system coupled with a photodiode-array detector (PDA) supplied from Beckman-Coulter (Fullerton, California, USA) was used throughout the experiments. Separation was carried out in a 50.2 cm × 50 µm internal diameter (i.d.) fused-silica capillary housed in a cartridge with a detector window 100 × 800 µm (10 cm to the detector, short way). Prior to each run, the capillary was washed at a pressure of 20 psi with 0.1 M sodium hydroxide for 1.0 min and running buffer for 2.0 mins. Samples were injected using the hydrodynamic mode at 0.5 p.s.i. for 10 s and a column temperature of 25 °C.
Control of the instrumentation, data acquisition and processing were performed by 32 Karat version 7.0 supplied by Beckman (Fullerton, California, USA).
Preparation of standard solutions: Standard stock solutions at a concentration of 50 mg mL of AML and ATO were prepared first by dissolving an appropriate amount of the standard drugs in a few drops of methanol and the volume then made up with running buffer (pH 6.5). Calibration curves were prepared by taking appropriate aliquots of standard AML and ATO stock solutions in different volumetric flask and diluted up to the mark with running buffer to obtain final concentrations of 0.1 mg/L, 0.5 mg/L, 1.0 mg/L, 5.0 mg/L, 10 mg/L, 15 mg/L, 20 mg/L and 25 mg/L. All solutions were stored at 4 °C and equilibrated to room temperature before use. The calibration curve was constructed by plotting the average peak area against concentration and the regression equation was computed.
Preparation of pharmaceutical samples: Twenty Caduet tablets were weighed accurately and finely powdered. An amount equivalent to 10 mg AML and ATO was dissolved by a few drops of methanol and then by running buffer in a 25 mL volumetric flask. The volume was made up to mark and the solution was filtered through 0.45 µm PTFE membrane filter. The filtered solution was diluted with running buffer to obtain the final concentrations and then analysed using the developed method. Other pharmaceutical samples were synthesized in our laboratories, including AML and ATO in different concentrations, with excipients (cellulose, magnesium stearate, starch and talc) usually found in tablets formulation. In addition, placebo samples were prepared including the same excipients.
Preparation of human plasma samples: Blood samples were collected from healthy drug-free volunteers. Samples were spiked with three appropriate volumes of standard solutions of both drugs to give final concentrations of 0.1 mg/L, 0.5 mg/L and 1.0 mg/L. Samples were then centrifuged at 4,600 rpm for 5 min. The drugs were extracted using liquid-liquid extraction (LLE) technique. To each tube 1.0 mL sample, 5 mL of acetonitrile was added and vigorously vortex-mixed for 1 min. Samples were centrifuged again and the organic phase was transferred to another tube and evaporated to dryness under a stream of nitrogen gas. The residue was dissolved first in 1.0 µL of methanol and then 99.0 µL of running buffer was added using micro-pipettes.
Results and Discussion
Method optimization: The optimization of the electrophoretic separation was based on the production of acceptable peak shape, resolution and separation time. Electrophoretic factors potentially affecting these responses were considered for optimization and included: separation voltage, injection time, electrolyte concentration and pH.
The effect of the separation voltage in the range of 5–30 kV was examined. In general, high voltage reduces analysis time while low voltage enhances separation. In the current study, 25 kV was adopted for further optimization as a short analysis time and better separation were achieved.
For injection time, a range of 1.0–20.0 s was examined at pressure 0.5 p.s.i. A long injection time improves signals while causing some loss in resolution and peak symmetry. An injection time of 10.0 s that obtained the best result was set.
Different concentrations of phosphate buffer in a range of 10–100 mM were examined. 25 mM was adopted as the optimum electrolyte concentration with an acceptable resolution and shorter analysis time.
To optimize the pH of the buffer electrolyte, a range of pH 2.5–9.0 was applied. A pH value of 6.5 was proved to be ideal for separation.
The findings of the optimization study are as follows: separation voltage at 25 kV, electrokinetic injection at 5 kV for 10.0 s and 25 mM phosphate at pH 6.5.
Method validation: The analytical method was validated with respect to parameters such as linearity, limit of quantitation (LOQ), limit of detection (LOD), precision, accuracy, selectivity, recovery and robustness/ruggedness.
Linearity was established by least squares linear regression analysis of the calibration curve. The constructed calibration curves were linear over the concentration range of 0.10–25 mg/L for AML (n = 7) and ATO (n = 7). Peak areas of both drugs were plotted versus their respective concentrations and linear regression analysis performed on the resultant curves. Correlation coefficients (n = 3) were found to be more than 0.999 for both drugs with relative standard deviation (%RSD) values ranging from 0.95–4.2% across the concentration ranges studied. Typically, the regression equations were y = 0.7335x – 3.7194 (R = 0.9995) for AML and y = 0.8994x – 1.0577 (R = 0.9993) for ATO.
The LOQ was determined as the lowest amount of analyte that was reproducibly quantified above the baseline noise following triplicate injections. The resultant %RSD for these studies was ≤ 2.8%. The LOQ that produced the requisite precision and accuracy was found to be 0.10 mg/L for both drugs. The LOD was determined based on signal-to-noise ratios (S/Ns), using an analytical response of three times the background noise. The LOD for both drugs were found to be 0.05 mg/L. The sensitivity of the method reached the levels of AML and ATO possibly found in human plasmas for therapeutic purposes. Good sensitivity was obtained by both the optimization of CE procedure and preconcentration performed by LLE for human plasma samples.
The intra-and inter-day variability or precision are summarized in Table 1 and were assessed by using standard solutions prepared to produce solutions of three different concentrations of each drug. AML and ATO were used in the same solution for the purposes of these studies. Repeatability or intra-day precision was investigated by injecting nine replicate samples of each of the samples of three different concentrations. Inter-day precision were assessed by injecting the same three samples over three consecutive days.
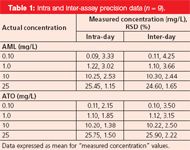
Table 1: Intra and inter-assay precision data (n = 9).
Accuracy data for the assay following the determination of each of the compounds of interest are summarized in Table 2. Accuracy was determined by interpolation of replicate (n = 5) peak area of three accuracy standards of different concentration, from a calibration curve that had been prepared as previously described. In each case, the accuracy was calculated and found to be less than 3.6% for each of the compounds.
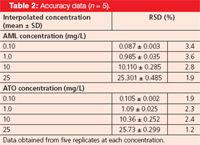
Table 2: Accuracy data (n = 5).
For recovery study, a known amount of each standard powder was added to samples of tablet powders, which was then mixed, extracted and subsequently diluted to yield a starting concentration of 10.0 mg/L of both drugs. The observed concentrations of AML and ATO were found to be 10.15 ± 0.34 mg/L (mean ± SD) and 10.25 ± 0.42 mg/L, respectively. The resultant %RSD for these studies were found to be 3.3% for AML and 4.1% for ATO with a corresponding percentage recovery value of 101.5% and 102.5%, respectively.
The ruggedness of the method was assessed by comparison of the intra- and inter-day assay results for AML and ATO that had been performed by two analysts. The %RSD values for intra- and inter-day assays of AML and ATO in the Caduet tablets performed in the same laboratory by two analysts did not exceed 4.3%, thereby indicating the ruggedness of the method. In addition, the robustness of the method was investigated under a variety of conditions, including changes in pH of the running electrolyte, electrolyte concentration and separation voltage. The degree of reproducibility of the results obtained as a result of small deliberate variations in the method parameters and by changing analytical operators has proven that the method is robust.
The validated method was applied to the determination of AML and ATO in commercially available Caduet tablets. Figure 2 illustrates typical electropherogram obtained following the assay of Caduet tablets. The result of the assays (n = 9) undertaken yielded 100.07% (%RSD = 2.44%) and 99.98% (%RSD = 2.1%) of label claim for AML and ATO, respectively. The observed concentrations of AML and ATO were found to be 5.15 ± 0.19 mg/L (mean ± SD) and 4.95 ± 0.17 mg/L, respectively. The mean retention times of AML and ATO were 2.1 min and 4.8 min with associated %RSD values of 2.25% and 2.29%, respectively. The results of the assay indicate that the method is selective for the analysis of both AML and ATO without interference from the excipients used to formulate and produce these tablets.

Figure 2: Electropherograms of 5.00 mg/L AML and ATO in tablet formulation (Caduet). Conditions: Injection: 5 kV for 10 s; Separation: 25 kV, 25 °C, 25 mM phosphate buffer adjusted to pH 6.5. Other conditions as described in Experimental section. Peak identification: (1) AML and (2) ATO.
To examine the role of LLE in matrix clean-up, a drugfree plasma sample was subjected to LLE and then to CE analysis. Typical electropherogram obtained is depicted in Figure 3(a). For comparison study, a human plasma sample spiked with a mixture of the drugs to produce a final concentration of 5.0 mg/L of both compounds was subjected to LLE and CE. The typical electropherogram is depicted in Figure 3(b). The figures show no interferences were recorded for the drug-free plasma sample, indicating good selectivity for the method.
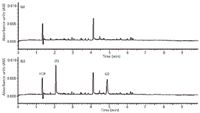
Figure 3: Electropherograms of (a) drug-free human plasma sample and (b) human plasma sample spiked with 5.0 mg/L AML and ATO under the optimized conditions: 5 kV for 10 s injection time, 25 kV voltage, 25 °C, 25 mM phosphate electrolyte concentration, pH = 6.5. Other conditions as described in Experimental section. Peak identification: (1) AML and (2) ATO.
Conclusion
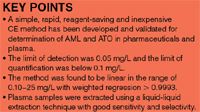
A simple, rapid, reagent-saving and inexpensive CE method has been developed and validated for the simultaneous determination of AML and ATO in pharmaceuticals and human plasma. Drugs were separated in 2.10 min and 4.75 min, respectively. The method was linear in the range of 0.10–25 mg/L with weighted regression of 0.9995 and 0.9993 for AML and ATO, respectively. The LOD was 0.05 mg/L, while the LOQ was 0.10 mg/L for both drugs. Intra- and inter-day precision for both drugs did not exceed 3.6%. Therefore, the method is suitable to be applied for routine analysis in pharmaceutical and clinical laboratories and is a complementary alternative to available methods.
Acknowledgements
The funding for this work was supplied by the Deanship of Scientific Research, King Faisal University (project # 110060). Thanks are also due to the Department of Chemistry, College of Science, King Faisal University, Saudi Arabia, where this research was conducted.
Ahmed O. Alnajjar is associate professor of pharmaceutical and analytical chemistry and vice dean of the college of clinical pharmacy, King Faisal University, Hofuf, Saudi Arabia. He specializes in pharmaceutical, environmental and forensic analytical chemistry. He received his PhD in pharmaceutical and analytical chemistry from Ohio University, USA, in 2004.
References
(1) K.D. Altria, Capillary Electrophoresis Guidebook, Humana Press, Totwa, New Jersey, Volume 52, (1996).
(2) F. Rossetti, S.D.Portu, E. Menditto, L. Scalone, S. Bustacchini, C. Cricelli and L.G. Mantovani, Pharmacol. Res., 53(3), 197–201 (2006).
(3) H.J. Panchal and B.N. Suhagia, J. AOAC Int., 93(5), 1450–1457 (2010).
(4) S.R. Patel, Indian J. Pharm. Sci., 69(1), 110–111 (2007).
(5) B. Dogan-Topal, B. Bozal, B. Tolga Demircigil, B. Uslu and S.A. Ozkan, Electroanalysis, 21(22), 2427–2439 (2009).
(6) A. Mohammadi, N. Rezanour, M. Ansari Dogaheh, F. Ghorbani Bidkorbeh, M. Hashem and R.B. Walker, J. Chromatogr. B, 846(1–2), 215–220 (2007).
(7) M.M. Hefnawy, M. Sultan and H. Al-Johar, J. Liq. Chrom. Rel. Technol., 32(20), 2923–2942 (2009).
(8) H. Farahani, P. Norouzi, A. Beheshti, H.R. Sobhi, R. Dinarvand and M.R. Ganjali,Talanta, 80(2), 1001–1006 (2009).
(9) A.A. Kadav and D.N. Vora, J. Pharm. Biomed. Anal., 48(1), 120–126 (2008).
(10) A.O. Alnajjar, J. AOAC Int., 94(2), 498–502 (2011).

Separating Impurities from Oligonucleotides Using Supercritical Fluid Chromatography
February 21st 2025Supercritical fluid chromatography (SFC) has been optimized for the analysis of 5-, 10-, 15-, and 18-mer oligonucleotides (ONs) and evaluated for its effectiveness in separating impurities from ONs.


