Significant Improvements in Pesticide Residue Analysis in Food Using the QuEChERS Method
LCGC North America
The analysis of pesticide residues in food samples from the state of Connecticut's regulatory monitoring program are compared to USDA and US FDA results.
The quick, easy, cheap, effective, rugged, and safe (QuEChERS) sample preparation procedure combined with both gas chromatography–mass spectrometry (GC–MS) and liquid chromatography–mass spectrometry (LC–MS) was adopted in our laboratory for the analysis of pesticide residues in food samples as part of the state of Connecticut's regulatory monitoring program. In 2006, data from a QuEChERS-based sample preparation procedure were compared to data from our previous analytical method. In this article, these results are further compared to those of the U.S. Food and Drug Administration's pesticide residue monitoring program and the U.S. Department of Agriculture's pesticide data program.
Since its inception in 1963, the pesticide residue program in the Department of Analytical Chemistry at The Connecticut Agricultural Experiment Station (CAES) has made major advancements in the analyses of pesticide residues present in food — primarily but not exclusively produce. In 1992, the method of Pylypiw (1) was used in our laboratory to replace our older methods (2) for the extraction of organochlorine and organophosphorous pesticides from food samples. At the time, residues were analyzed by gas chromatography (GC) with element-selective detection. Beginning in 1993, mass spectrometry (MS) was introduced for the confirmation of violative residues. By 1999, all samples were subjected to MS analysis for the presence of pesticide residues (3). In 2006, following the acquisition of a ion trap liquid chromatography–mass spectrometry (LC–MS) system, a direct comparison was made between the Pylypiw method and the then newly published quick, easy, cheap, effective, rugged, and safe (QuEChERS) method (4). In 2011, an orbital trap LC–MS system (Thermo Scientific Exactive Orbitrap) was added to our program and is currently used for the exact-mass confirmation of violative pesticide residues.

In 2006, we compared the Pylypiw method (1), which offers petroleum ether extracts that are amenable to GC analysis, with an adaptation of the recently introduced QuEChERS method (4), which offers acetonitrile or toluene extracts that are amenable to both GC–MS and LC–MS. Approximately 181 samples obtained for analyses in the Connecticut program were tested using a paired sample blind study protocol (vide infra). The extracts from the Pylypiw method were analyzed by GC–MS and GC with micro electron-capture detection (ECD), and the QuEChERS extracts were analyzed by GC–MS and LC–MS as outlined in Figure 1.
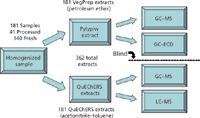
Figure 1: Flowchart of 2006 sample extract and analysis.
The Connecticut program is similar to the larger United States (US) Food and Drug Administration (FDA) program in that it tests a wide variety of samples available to the consumer in the market place. The samples tested in these two surveys can be comprised of nearly any type of food offered for sale to the consumer. On an average annual basis from 1990 to 2010 the Connecticut program tested 37 different commodity types of fresh food and 14 different commodity types of processed food. These two programs contrast to the US Department of Agriculture (USDA) pesticide data program (PDP) which, on average, targets 12 fresh and four processed samples per year. Owing to the fact that the results obtained from the Connecticut and FDA programs are derived from nontargeted sources (5), as opposed to those in the PDP (6), the results obtained through the Connecticut program are thought to be more representative of those in the larger FDA program.
From 1990 through 2005, the results obtained from the Connecticut program closely matched those obtained in the larger FDA pesticide residue monitoring program (Figure 2). During this timeframe, the FDA program analyzed 167,215 samples (5); the Connecticut program separately analyzed 4871 food samples (3). The Connecticut program analyzed only about 3% (2.91%) of the total samples in the FDA program. It is noteworthy that there is not a significant difference in the proportions of pesticide residue–free samples, 63.3% reported by Connecticut and 64.2% reported by FDA (5) (Figure 2), over the 16-year timeframe (1990–2005) when the data are compared using a z-test (P = 0.230; z = 1.200). The average violation rate over the same period was similar, 1.5% for the Connecticut program and 2.8% (5) for the FDA program, but statistically different (P = <0.001; z = 5.114). These results imply that the sampling design in Connecticut closely parallels the larger program of the FDA, that the analytical methodology used in the two surveys was comparable over the timeframe 1990–2005, and that the smaller Connecticut subsample is representative of the larger with respect to samples containing pesticide residues.
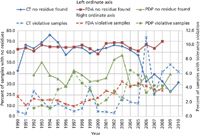
Figure 2: Comparison of the Connecticut, FDA, and PDP monitoring programs for pesticide residues in food.
From the inception of the USDA PDP study in 1992 and through 2005, the results obtained from the Connecticut program contrasted sharply to those obtained in the PDP study by as much as 38% (Figure 2). During this timeframe the PDP targeted 112,395 samples (6), and the Connecticut program tested 4150 samples. When compared, the percentages of pesticide residue–free samples over the inclusive 14-year timeframe (1992–2005), 62.7% reported by Connecticut and 38.8% reported by the PDP, was not similar nor was it statistically significant (P = <0.001; z =34.117). The average violation rate reported, 3.5% by the PDP (6) and 1.7% by Connecticut, was likewise statistically dissimilar (P = <0.001; z = 6.208). These results suggested that the sampling designs of the two programs were dissimilar and that the analytical methodology used in the two studies was likely dissimilar.
Experimental
Sample Collection
All of the fresh and processed fruit and vegetable samples examined in this work were collected by inspectors from the Connecticut Department of Consumer Protection (DCP). The samples consisted of fruits and vegetables grown in Connecticut, other states, or foreign countries and were collected at different Connecticut farms, producers, retailers, and wholesale outlets located within the state. The samples collected were brought to our laboratory in New Haven by the DCP inspectors for pesticide-residue testing. In all cases, these samples were collected without prior knowledge of any pesticide application.
Sample Homogenization
In most cases, each sample was prepared in its natural state as received, unwashed and unpeeled, but in all cases samples were processed according to the Pesticide Analytical Manual (7). Whole food samples were homogenized before extraction using a food chopper or a commercial blender equipped with an explosion-proof motor. Liquid and powdery samples were mixed thoroughly before subsampling for extraction. In all cases, a portion of each sample (approximately 500 g) was retained and frozen in plastic bags until analysis and reporting of the results were completed.
Sample Extraction
Pylypiw Method
The method described by Pylypiw (1) was used with minor modifications. A 50-g subsample of homogenized material was weighed into a blender jar (1 L) and blended with 50 mL of isopropyl alcohol and 100 mL of petroleum ether for approximately 5 min. After the mixture settled, it was filtered through a plug of glass wool into a 500-mL separatory funnel to remove insoluble particulates. Interfering coextracted compounds and the isopropyl alcohol were removed from the petroleum ether extract by sequential washing with water (3 × 200 mL). Saturated sodium sulfate solution (50 mL) was added to the first and the final wash to enhance partitioning and phase separation. After the final wash, the organic extract was collected in 40-mL glass vials containing anhydrous sodium sulfate (approximately 10 g) as a drying agent. After 2 h, a portion of the sample extract was transferred to a chromatography vial and stored at room temperature until analysis. It should be noted that this extraction method results in a twofold dilution factor of the original sample.
QuEChERS Method
The QuEChERS method described by Anastassiades and colleagues (4) was modified for this work. For the 990 samples tested in this work, a 15-g subsample of homogenized material was weighed into a 50-mL disposable polypropylene centrifuge tube. The tube was then amended with [U-ring]-13C6-Alachlor internal standard (600 ng; prepared from material purchased from Cambridge Isotope Laboratories), anhydrous magnesium sulfate (6 g), anhydrous sodium acetate (1.5 g), and acetonitrile (15 mL) and the mixture was shaken on a Burrell Model 75 Wrist Action shaker (Burrell Scientific) for approximately 1 h. The tube was centrifuged using a Centra GP6 centrifuge (Thermo IEC) at 3000 rpm (2087g) for 10 min at approximately 25 °C to separate the acetonitrile from the aqueous phase and solids. Acetonitrile (10 mL) was decanted into a 15-mL polypropylene Falcon centrifuge tube (Corning) containing anhydrous magnesium sulfate (1.5 g); primary and secondary amine (PSA) bonded silica (0.5 g) and toluene (2.0 mL). The mixture was shaken by hand for approximately 5 min and centrifuged at 3000 rpm (2087g) for 10 min at 25 °C. Then 6 mL of the extract was added to a concentrator tube and blown down to just under 1 mL (but not to dryness) under a stream of nitrogen at 50 °C. The concentrated material was reconstituted to a final volume of 1.0 mL with toluene. It should be noted that this extraction method results in a fivefold concentration of the original sample.
Whereas QuEChERS normally requires the use of acidified acetonitrile when sodium acetate is used for salting out (4,8,9), it was intentionally not used in this modification. The exclusion of acid provides better PSA cleanup yet may lead to lower recoveries of a few base sensitive pesticides (10). To minimize potential lower recoveries, extracts are stabilized by reconstitution in toluene following their concentration. Excluding the acid during the extraction eliminates the need for its neutralization before concentrating the extract. Failure to neutralize the added acid would expose the extracts to a concentrated acid environment following the concentration step used in the present protocol and lead to rapid GC column degradation.
Instrumental Analysis
Pylypiw Extracts
From 1990 to 1999, 3547 extracts were analyzed by GC as described by Pylypiw (1). Beginning in 1994, violative samples were confirmed by MS using a model 5890 GC system equipped with an HP-7673 autoinjector and an HP 5972A MSD system (all from Hewlett-Packard Co.). Injections (2–4 μL) were made onto a 30 m × 0.53 mm, 0.5-μm df SPB-5 fused-silica capillary column (Sigma-Aldrich). From 1999 to 2006, samples prepared by the Pylypiw method were analyzed using a model 6890 plus GC equipped with dual 7683 series injectors, and a 7683 autosampler (collectively known as an automatic liquid sampler [ALS]), a model G2397A μECD system in the rear position, and a model 5973 MSD system in the front position (all from Agilent Technologies). A programmable temperature vaporization (PTV) was installed on the front inlet and a Merlin MicroSeal system (Merlin Instrument Co.) on the rear inlet; dual 30 m × 250 μm, 0.25-μm df Supelco MDN-12 fused-silica capillary columns (Sigma-Aldrich) were used. Injections (2 μL) were made simultaneously onto both columns. All data were collected and analyzed using MSD Productivity Chemstation software version B.02.00 (Agilent Technologies).
QuEChERS Extracts
Samples prepared by the QuEChERS method were analyzed by GC–MS and LC–MS. For the GC analysis, a model 6890N GC system equipped with a 7683 series ALS autosampler and a model 5975 MSD system were used (all from Agilent Technologies). The inlet used a Merlin MicroSeal system with injections made onto a 30 m × 250 μm, 0.25-μm df J&W Scientific DB-5MS+DG column (Agilent Technologies). Data were collected and analyzed using MSD Chemstation software version D.02.00.275 (Agilent Technologies). The LC–MS analyses were made using a model 1100 LC system and a 150 mm × 2.1 mm, 5-μm dp Zorbax SB-C18 column (Agilent Technologies) with eluent flowing to a Thermo Electron Finnigan LTQ ion-trap MS system through 2009. In 2010, the model 1100 LC system was replaced with a model 1200 Rapid Resolution LC system and a 50 mm × 4.6 mm, 1.8-μm dp Zorbax XDB-C18 column (both from Agilent Technologies). Data were collected and analyzed using Xcalibur software version 2.0 (Thermo Scientific). Beginning in 2010, confirmatory data for violative samples were obtained using a model 1200 LC system and a 150 mm × 2.1 mm, 5-μm dp Zorbax SB-C18 column (both from Agilent Technologies) with eluent flowing to a Exactive Orbitrap MS system (Thermo Scientific). Data analysis was performed using ToxID version 2.1.2 and Xcalibur Qual Browser version 2.1.0.1140 (both from Thermo Scientific).
2006 Blind Study Design
All samples were collected and homogenized as described above. Subsamples of the homogenate were extracted and analyzed concurrently by both the Pylypiw and QuEChERS protocols as outlined in Figure 1 by different laboratory personnel. The results of the analyses performed were maintained in separate databases by the laboratory personnel responsible for performing the individual analysis. At the end of the one-year study, the data obtained were reconciled into a single database for statistical analysis.
Reproducibility of Results
All samples examined in this work were individually homogenized, extracted, and analyzed by GC and LC once. Inter- and intralaboratory studies over a wide range of pesticides, pesticide concentrations, and matrices and its validation as an Association of Analytical Communities (AOAC) method (4,8,9) have demonstrated that a single, homogenized extract is sufficient to obtain accurate quantitation of pesticide residue concentrations. Anastassiades and coworkers (8) have developed a database of more than 150,000 recovery figures on over 650 different pesticide residues. All violative samples were re-extracted, analyzed, and quantified in duplicate using portions of the original sample retained from the homogenization step. One of these duplicate samples was spiked with the pesticides in question at a concentration slightly above the originally determined value. Quantitative values of the pesticides in these extracts were compared to the concentration found in the original analysis. Beginning in 2010, exact MS data were also obtained on those residues found to be violative.
Results and Discussion
In 2006, a comparison was made for 181 samples of fresh (140, 77.3%) and processed (41, 22.7%) samples between the Pylypiw and QuEChERS extraction methods. The 181 homogenized samples were each divided, extracted, and analyzed as depicted in Figure 1. There were a total of 362 extracts analyzed. It needs to be noted that because of the extraction protocols used, the Pylypiw extracts were 10 times more dilute than the QuEChERS extracts (vide supra).
Of the 181 samples analyzed by the Pylypiw protocol, 98 (54.2%) of the samples contained no detectable pesticide residues, 79 (43.6%) contained non-violative residues (0.001–12.00 ppm), and 4 (2.2%) contained violative residues (0.014–0.900 ppm). A total of 133 individual pesticide residues were found on the 83 samples containing pesticide residues.
By contrast, when the same 181 samples were extracted by the QuEChERS method and the extracts were analyzed by GC–MS and LC–MS, 73 (40.3%) of the samples were found to contain no detectable pesticide residues (see Figure 2). The remaining 108 samples contained 181 different individual pesticide residues; 89 samples (49.2%) contained nonviolative residues (0.001–3.90 ppm) and 20 (11%) contained violative residues (0.002–0.752 ppm). Of these 181 residues, 42 were detected by GC alone, 70 were detected by LC alone, and 69 residues were found by both instrumental methods of analysis.
The dramatic decrease in the number of samples found to be pesticide residue free when using the QuEChERS approach in place of the Pylypiw protocol (40.3% vs. 54.2%) represents a major advancement (13.9%) for our laboratory in the analysis of pesticide residues in food. In 2006, more violative residues (21 total; 11.6%) were found than in any other year in our survey. The Pylypiw method found only one violation not found by the QuEChERS approach, whereas the QuEChERS method found 17 residues not found by the Pylypiw method. It should be noted that the number of 2006 violations was slightly skewed owing to nine findings of atrazine. A more thorough discussion about the atrazine residues found has been presented by Krol (11). Ultimately, it was found that many of the residues were the result of plant uptake when atrazine was applied in a previous growing season. If the atrazine violations are omitted from consideration, there would have only been 12 violations (6.6%) reported in 2006; and the violation rate from the QuEChERS method would have been nearly halved to 6.1% from the 11% reported above.
In 2006, it is clear that the Connecticut Pylypiw results did not exactly match those of the FDA study. Both studies however indicated that the majority of samples tested, 98 (54.2%) and 3699 (67.1%) respectively, were free from pesticide residues. The poor correlation is likely because of a yearly fluctuation in the proportions of residues present in the samples analyzed over the course of this one year study. These yearly fluctuations have been present since 1990. The results of the QuEChERS protocol in 2006 (Figure 2) indicate that the majority of the food purchased for consumption contain pesticide residues; in fact 59.7% of the sampled food offered for sale in Connecticut contains at least one pesticide residue. The results obtained in 2006 more closely mimic those reported in the PDP.
By way of comparison, in 2006 the FDA reported (5) that it tested 5512 samples and found that 3699 (67.1%) of the samples contained no detectable pesticide residues; 1578 (28.6%) contained nonviolative residues; 235 (4.3%) contained violative residues. The USDA PDP (6) tested 9818 samples and found that 3717 (37.9%) of the samples contained no detectable residues; 5767 (58.7%) contained nonviolative residues; 334 (3.4%) contained violative residues.
To confirm the findings of our blind study and to address potential yearly fluctuations in the data, we continued forward with our work extracting all samples through the QuEChERS protocol and analyzing the extract by both LC–MS and GC–MS. We also continued with an indirect annual comparison of our findings to those of the FDA pesticide monitoring program and the PDP. Because of the fact that the LC–MS library used in the QuEChERS screening needed to be established, the numbers of different analytes detected has continually increased through the course of the study.
As can be seen in Figure 2, beginning in 2006, the FDA and Connecticut surveys dramatically diverge, and the results of the Connecticut survey more closely matches those of the PDP. On average, over the three years during 2006–2008, the QuEChERS protocol in the Connecticut survey found that 36.3% of the samples contained no residues, compared to 66.9% reported by the FDA. During this same timeframe the Connecticut violation rate was 6.9% as compared to the 3.9% reported by the FDA.
A z-test comparison was made between the Connecticut data obtained by the QuEChERS protocol (776 samples) and the PDP data (40,726 samples) between 2006 and 2009. The proportions of pesticide residue-free groups in the two studies were found to be statistically significant (P = 0.783; z = 0.275).
The FDA program (12) currently uses multiresidue methods (MRMs) and single-residue methods (SRMs) as described in the Pesticide Analytical Manual (7) to determine the approximately 400 pesticides with Environmental Protection Agency (EPA) tolerances (12,13). Alternatively, the PDP laboratories have modified their protocols to take advantage of more-recent technological advancements for the identification and quantification of pesticide residues (6).
The 2006 Connecticut study has provided convincing evidence that the use of the QuEChERS sample preparation procedure combined with the complementary analyses of the extracts by both GC–MS and LC–MS is preferred for determining pesticide residues in food. There are three key factors responsible for this finding. First, the ability of the QuEChERS method to extract greater and broader numbers of pesticide active ingredients with adequate recoveries as documented by Anastassiades (4) and others (8) has increased the number of analytes routinely tested for in our laboratory. From 1990 to 2005, we reported on 18 different active ingredients, on average. Owing partly to the addition of active ingredients to our spectral libraries, since 2006 we reported on an average of 52 different active ingredients.
Second, the QuEChERS extracts are amenable to both LC and GC analysis providing complementary coverage of pesticide residues which cannot be determined by one instrumental method or the other. In addition, because of the greater sensitivity provided by LC–MS, it is not surprising to observe that the number of residues seen by LC rapidly outpaced those seen by GC. Third, the fact that the final stage of the QuEChERS protocol allows for a concentration step (in our work by a factor of 5) leads to greater overall method sensitivity. This has led to the overall detection of more pesticide residues at lower levels in the samples analyzed (Figure 3). Taken together, these factors have led to a more accurate picture of the occurrence of pesticide residues in the Connecticut food supply.
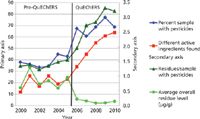
Figure 3: Impact of QuEChERS on the numbers and levels of detected pesticide residues found in Connecticut food samples.
Conclusions
The vast majority of the fruits and vegetables we consume, with the exception of organically grown produce, have been treated with pesticides during the course of their production. If the pesticides used during the production of this food have been used in accordance with the approved use of the pesticide product, the levels resulting on the food will be below the EPA tolerance (13). In the past, because of the sensitivity and selectivity of the instruments used at the CAES and in other pesticide residue monitoring programs at both the Federal and state level, many of the residues have gone undetected. By changing the extraction and analysis methodologies used in our work, the results obtained in the Connecticut studies which once showed statistical similarities to FDA data, now show those similarities to data generated by the USDA in their PDP studies. Because of the increased sensitivity of our instrumentation and to the QuEChERS sample preparation approach, our program is detecting greater numbers of pesticides at lower levels. The results of this work allow the consumer to gain a better understanding of the prevalence and levels of pesticide residues in the food they consume.
Acknowledgments
We would like to thank the Food Division of the Department of Consumer Protection for providing samples for this study. We would especially like to thank Ellen Sloan for her tireless devotion and dedication to collecting the vast majority of the samples included in this work.
References
(1) H.M. Pylypiw, Jr., J. AOAC Int. 76, 1369–1373 (1993).
(2) H.M. Pylypiw and L. Hankin, Bulletin 900 (Connecticut Agricultural Experiment Station, New Haven, Connecticut, 2006), p. 2 and references cited therein.
(3) W.J. Krol, T. Arsenault, and M.J.I. Mattina, Bulletin 1006 (Connecticut Agricultural Experiment Station, New Haven, Connecticut, 2006), pp. 1–12.
(4) M. Anastassiades, S.J. Lehotay, D. Stajnbaher, and F.J. Schenck, J. AOAC Int. 86, 412–431 (2003).
(5) Food and Drug Administration, Residue Monitoring Reports 1993–2008, http://www.fda.gov/Food/FoodborneIllnessContaminants/Pesticides/UCM2006797.htm.
(6) United States Department of Agriculture Pesticide Data Program, Databases and Annual Summaries 1992–2009, http://www.ams.usda.gov/AMSv1.0/ams.fetchTemplateData.do?template=TemplateG&topNav=&leftNav=ScienceandLaboratories&page=PDPDownloadData/Reports&description=Download+PDP+Data/Reports&acct=pestcddataprg
(7) Pesticide Analytical Manual Volume I (3rd Ed., 1994 and subsequent revisions), available from FDAs website at http://www.fda.gov/food/foodscienceresearch/laboratorymethods/ucm2006955.htm, and Volume II (1971 and subsequent revisions), available from National Technical Information Service, Springfield, Virginia. Food and Drug Administration, Washington, DC.
(8) M. Anastassiades et al., DataPool of the EU Reference Laboratories for Residues of Pesticides, http://www.eurl-pesticides-datapool.eu/.
(9) Official Methods of Analysis of AOAC International (2011) 18th Ed., online, Official Method 2007.01. http://www.eoma.aoac.org/
(10) F.J. Schenck and J.W. Wong, "Two Modified QuEChERS Methods for the Multiresidue Determination of Pesticides in Produce Samples" presented at the 45th Annual Florida Pesticide Residue Workshop, St. Pete Beach, Florida, 2008, http://flworkshop.com/09documents/2009-Presentations/08_Schenck.pdf
(11) W.J. Krol, B.D. Eitzer, T. Arsenault, and M.J.I. Mattina, Bulletin 1012 (Connecticut Agricultural Experiment Station, New Haven, Connecticut, 2007), pp. 1–13.
(12) ibid. 5, Pesticide Monitoring Program FY 2008, Analytical Methods, http://www.fda.gov/Food/FoodborneIllnessContaminants/Pesticides/ucm228867.htm#Analytical_Methods_and_Pesticide_Coverage.
(13) e-CFR (Electronic Code of Federal Regulations) (2011) Title 40, 24, Part 180. http://ecfr.gpoaccess.gov/cgi/t/text/text-idx?&c=ecfr&tpl=/ecfrbrowse/Title40/40tab_02.tpl.
Walter J. Krol, Brian D. Eitzer, Terri Arsenault, Mary Jane Incorvia Mattina, and Jason C. White are with the Department of Analytical Chemistry at the Connecticut Agricultural Experiment Station in New Haven, Connecticut. Direct correspondence to: Walter.krol@ct.gov

Analytical Challenges in Measuring Migration from Food Contact Materials
November 2nd 2015Food contact materials contain low molecular weight additives and processing aids which can migrate into foods leading to trace levels of contamination. Food safety is ensured through regulations, comprising compositional controls and migration limits, which present a significant analytical challenge to the food industry to ensure compliance and demonstrate due diligence. Of the various analytical approaches, LC-MS/MS has proved to be an essential tool in monitoring migration of target compounds into foods, and more sophisticated approaches such as LC-high resolution MS (Orbitrap) are being increasingly used for untargeted analysis to monitor non-intentionally added substances. This podcast will provide an overview to this area, illustrated with various applications showing current approaches being employed.


