Self-Calibration of Mass Spectral Line-Shapes for Improving the Formula Identification of Unknown Compounds
Special Issues
Mass spectrometry has become a fundamental tool for compound identification or confirmation by virtue of its ability to obtain elemental composition determination (formula identification) by accurate mass measurements. The speed, sensitivity, and ease of interfacing the technique with gas chromatography and liquid chromatography make it the technique of choice for many applications. However, accurate mass measurements must be made with care, and sometimes they can require careful calibration procedures and validation methods. In addition to accurate mass measurements, the isotope abundance distribution also provides information unique to a given chemical formula. However, the mass spectral accuracy required for accurate isotope modeling has not been easy to obtain previously. More recent approaches (1–3) that calibrate the spectral line-shape show promise in obtaining the necessary level of spectral accuracy but still require careful calibration methods with the use of known standards. This article..
Accurate mass measurements have been used for the formula identification of unknown compounds since the advent of high-resolution mass spectrometers. This simple but elegant method of formula identification relies on the fact that each unique formula has a unique accurate mass (4–6). Depending upon the inherent mass accuracy for a given instrument, all formulas falling within the instrument's mass error range need to be considered as viable candidates. For example, the formula search on an instrument capable of obtaining a mass accuracy of 1 ppm results in a list of 34 formula candidates for an unknown compound at 500 Da containing the elements C, H, N, O, S, and Cl. The formula candidates can be pared down by imposing chemical constraints, such as limiting the possible elements in the formula search, the minimum and maximum number of atoms for each element, the electron state, and any other complementary knowledge of the unknown sample. Indeed, it is well known that mass accuracy alone generally is not enough to obtain a unique formula (3), even on the highest resolution instruments.
Isotope ratio measurements also have long been used to assist in reducing the number of formula candidates for accurate mass measurements (7). Like accurate mass, every unique formula has a unique isotope distribution. For an isotopic abundance distribution accuracy (spectral accuracy) of 98%, 95% of the formula candidates can be eliminated at 3 ppm mass accuracy, providing the performance of a hypothetical system capable of 0.1 ppm mass accuracy (6). If the isotopic abundance distribution error, or spectral accuracy, could be improved to better then 99%, this could improve substantially the ability to uniquely identify the formula even on systems with very modest mass accuracy. In general, such high spectral accuracy is difficult to obtain, primarily because of the instrument-specific distortions in the measured instrument line-shape, which make accurate isotope pattern matching inherently inaccurate.
Recent work employing a novel approach to mass spectral calibration also provides calibration of the instrument line-shape to a known analytical function, dramatically improving both the mass accuracy and the spectral accuracy (2), even for unit resolution quadrupole systems. The method requires that one or more calibration ions that are relatively close in mass (for example, 50 Da) be measured within a short time period (a couple of hours to days, depending upon the specific instrumentation) for best results. The same approach applied to high-resolution mass spectrometry (MS) shows only an incremental improvement in mass accuracy (8), which is probably limited by the fundamental performance limits of the instruments and the calibration procedure used. Any further improvements in formula identification for a given mass accuracy might be gained from methods that improve the instrument line-shape calibration. Improvement of the instrument line-shape calibration has been shown to make formula identification on unit resolution systems possible (3) and should further benefit high-resolution systems as well.
Instrument Calibration
While it has been shown that including line-shape calibration for high-resolution systems can improve formula identification (8), frequent recalibration with known standards is still required for optimum performance. This is due to the short- and long-term stability inherent in all mass spectrometers. A number of different calibration approaches are used, all of which have advantages and disadvantages. One approach involves using dual spray ion sources that continually introduce a calibration standard to allow for constant recalibration. One drawback of dual spray, beyond the increased cost and complexity of the hardware, is that either the measurement duty cycle time of the instrument is reduced if the calibration standard is introduced periodically, or the unknown mass spectrum might be contaminated if it is introduced simultaneously. Another drawback is that the calibrant is not always optimum for the ion of interest. For best performance, the calibrant or "lock mass" should be as close in mass as possible to the analyte ion. This is not always convenient or even possible when many analytes of varying masses are to be measured.
More conventional methods of introducing calibration standards include frequently running separate calibration standards or incorporating standards into the sample. The first method requires additional measurements and cleaning cycles in between the introduction of the calibration standards. The time between calibration and analyte measurement can be many minutes or even hours, a significant time lapse with, for example, time-of-flight (TOF) MS systems. For best performance, it is always desirable to run the calibration standard as close in time to the sample run as possible. The introduction of an internal standard into the sample is another approach. This approach can suffer from problems of ion suppression, decreasing the analyte signal or interference of the calibration with the analyte ion and possibly introducing additional chemical noise. In liquid chromatography (LC)–MS runs, the standard also can complicate the chromatography. Even when it does not, the time between the calibration measurement and the analyte measurement can be substantial for some MS systems, depending upon the separation time between the chromatogram peaks. This also adds an additional and sometimes tedious step to the sample preparation.
Line-Shape Self-Calibration
In previously described work (1–3), a novel method is described for mass spectral calibration for both mass accuracy and spectral accuracy by virtue of calibrating the instrument-measured line-shape to a defined analytical function. In this approach, a theoretical spectrum of the calibration ion is generated using a defined line-shape function (Gaussian or other symmetric function) whose full width at half maximum (FWHM) is similar to but different from that of the measured ion. A calibration function is derived to transform the actual measured mass spectrum into the theoretically generated mass spectrum with the defined line-shape function. The calibration function represents a correction for both the mass position and the instrument line-shape and is independent of the actual calibration ion used. Applying the calibration function to the unknown analyte ion corrects both the mass position and the line-shape. Once corrected to a known line-shape function, the analyte's isotope pattern can be compared accurately with any formula candidates by computing the theoretical spectrum of each candidate using the same line-shape function that was defined in the calibration. The formula candidates generally are derived from a conventional accurate mass formula search.
The self-calibration approach becomes feasible when the monoisotopic peak of the analyte is resolved fully from its other isotope peaks (M+1, M+2, and so forth). The monoisotopic peak is isotopically pure (that is, it contains no isobars and only one isotope form of each ion, and as such is a fully resolved pure representation of the instrument line-shape). This allows a calibration function to be generated as described previously, except only the monoisotopic peak is used for calibration, circumventing the need to know what the actual ion formula is. Once the calibration function is calculated, it can then be applied across all of the isotope peaks of the analyte ion. Because we are generating the calibration function without a known standard, it has no effect on improving the mass accuracy and is solely a correction of the instrument line-shape. However, once the ion is calibrated to a known line-shape, highly quantitative and very accurate comparisons between isotope distributions can be used to improve the discrimination of formula candidates derived by mass accuracy alone. The comparison results in the interpretable statistic of the root mean square error (rmse), which can be converted to percent spectral accuracy as (1 - rmse)/S X 100, where S is the level of measured ion signal. Figure 1 illustrates the process of self-calibration, and Figure 2a illustrates what a typical analyte ion looks like before and after calibration. Figure 2b compares the self-calibrated mass spectrum with the theoretically generated spectrum for the correct ion, illustrating the typically high spectral accuracy match of greater than 99.5%, using TOF data from a Waters LCT Classic mass spectrometer (Milford, Massachusetts).
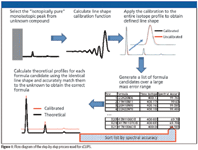
Figure 1
Results
Spectra were collected from four different types of medium- to high-resolution instruments, including an LTQ ion-trap system running in high-resolution zoom scan mode (Thermo Fisher Scientific, Waltham, Massachusetts), a Quantum Ultra triple quadrupole system (Thermo Fisher Scientific) running in high resolution, a micrOTOF TOF system (Bruker, Billerica, Massachusetts), and an Orbitrap hybrid linear ion-trap system (Thermo Fisher Scientific).
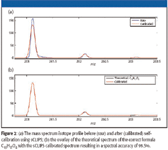
Figure 2
A variety of small-molecule pharmaceuticals ranging in mass from 152 to 734 Da were run on each instrument by LC–MS or infusion. All data were acquired in positive ionization mode as profile spectra. All instruments were run at a high enough resolution such that the isotope peaks for a given ion were baseline resolved.
The data acquired from the runs were read directly into MassWorks software (Cerno Bioscience, Danbury, Connecticut) for calibration, postprocessing, and analysis. For each ion of interest, the self-calibration and formula identification procedure outlined in Figure 1 was applied and the spectral accuracy was calculated. A predetermined mass accuracy window, based upon the accurate mass capability of each instrument, was used to perform an elemental composition search to obtain a list of candidate formulas for input into the spectral accuracy calculation.
The results for four different instruments, as summarized in Tables I–IV, for self-calibration isotope profile search (sCLIPS), prove to be a powerful metric to enhance formula identification by MS. Even for instruments of moderate mass accuracy, provided that the monoisotopic peak is resolved, excellent formula identification results were obtained. Of all the measurements made, the spectral accuracy ranked the correct compound as the number one correct match 17 out of 20 times, and the correct answer resided in the top five for all of the cases.
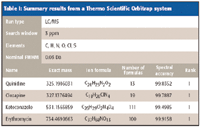
Table I: Summary results from a Thermo Scientific Orbitrap system
For comparison with traditional mass accuracy-only approaches, for ketoconazole to be uniquely identified using the elements C, H, N, O, Cl, and S in an elemental composition search would require a mass accuracy of better than 200 ppb. Even at a mass accuracy of 1 ppm, over 40 formula candidates must be evaluated for this compound. sCLIPS identified it as the number one hit from 111 candidates at 3 ppm mass accuracy.
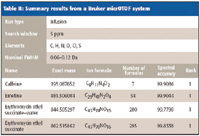
Table II: Summary results from a Bruker micrOTOF system
In addition, the self-calibration approach requires no additional instrumental or chemical calibrants because the analyte ion is the calibrant for itself (hence, the term self-calibration). Another factor in considering why the approach of self-calibration works so well is some general guidelines for calibration; the closer in mass the calibrant is to the analyte and the closer in time the calibrant is to the analyte, the better the calibration should be. With self-calibration, because the monoisotopic peak is used, all the peaks are within a few daltons and the time between the calibration peak and the remaining isotope peaks is measured in mere milliseconds or even less. Hence, the self-calibration for line-shape is nearly ideal.
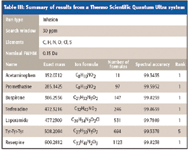
Table III: Summary of results from a Thermo Scientific Quantum Ultra system
The extreme example is with ion-trap instruments. The mass accuracy for this sample run in zoom scan mode was about ± 100 ppm because no special calibration for mass accuracy was applied. To be safe, the formula search mass window should be even wider; in this case, ± 200 ppm was used. Typically, this will return from about 135 formula candidates for the low mass range (252 Da) to over 5600 formula candidates at 508 Da for the search criteria used. Yet, in all cases, the correct formula is within the top five matches as sorted by spectral accuracy. This is equivalent to a mass accuracy of a few ppm. It is interesting to note that the formula candidates as ranked by spectral accuracy show a similarity in their formula composition, particularly the number of carbons, which is not the case with mass accuracy. Indeed, the spectral profiles provide strong evidence of the formula composition.
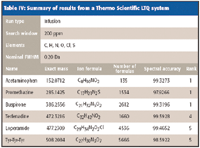
Table IV: Summary of results from a Thermo Scientific LTQ system
In many cases the spectral accuracy is above 99.5% and as high as 99.9%. These are remarkable levels of spectral accuracy. Even when the spectral accuracy is degraded, usually due to the presence of system noise or chemical interference, the rankings typically still perform well. This is likely because while noise and interferences degrade the absolute spectral accuracy, the relative spectral accuracy is still preserved among the formula candidates evaluated by sCLIPS.
Conclusion
Even at high mass accuracy (1 ppm), the number of formula candidates can be extensive. Spectral accuracy can be used as an independent metric, a metric as important as, if not more important than, mass accuracy, to identify formula candidates correctly with no need for additional calibration by virtue of the sCLIPS calibration approach. Isotope patterns are unique for every formula and can relax the need for careful instrument calibration to ensure accurate formula identification. Finally, even instruments not previously capable of performing with high mass accuracy, such as ion-trap instruments, can now be used to obtain accurate formula identification without the need for any additional calibration or standards.
Don Kuehl is Vice President, Marketing and Product Development, Cerno Bioscience, Danbury, Connecticut.
References
(1) Y. Wang, Methods for operating mass spectrometry (MS) instrument systems, United States Patent 6,983,213, January 3, 2006.
(2) M. Gu, Y. Wang, X. Zhao, and Z. Gu, Rapid Commun. Mass Spectrom . 20, 764–770 (2006).
(3) D. Kuehl and Y. Wang, Current Trends in Mass Spectrometry, supplement to Spectroscopy, 10–16, April 2007.
(4) K.F. Blom, Anal. Chem. 73, 715 (2001).
(5) A. Tyler et al., Anal. Chem. 68, 3561 (1996).
(6) T. Kind, BMC Bioinformatics 7, 234 (2006) (www.biomedcentral.com/1471-2105/7/234).
(7) L.M. Hill, LCGC Eur. 19(4) (2006).
(8) R.J. Strife et al., "Identification of 'Unknowns' – Structural Clues From Advanced Isotope Peak Modeling of MS and Orthogonal MS/MS Data," Proc. 55th ASMS Conf.; Indianapolis, Indiana (2007).

High pH and Temperature with HALO® ELEVATE C18, 1.5 mm ID Column
December 11th 2024Over the course of 5000 injections, the HALO®Elevate C18 1.5 mm ID column demonstrates stability and robustness in the stationary phase and the column hardware, with no significant changes to the retention time, peak shape, and back pressure.


