Review and Optimization of Linearity and Precision in Quantitative HPLC–ELSD with Chemometrics
LCGC North America
HPLC with ELSD continues to grow in popularity as a "quasi- universal" detector. Improvements in ELSD instrument design, including low temperature evaporation, have recently been commercialized...
High performance liquid chromatography (HPLC) with evaporative light scattering detection (ELSD) continues to grow in popularity as a "quasi-universal" detector as shown in Table I (1–88 please see the complete table in the online version of this article at chromatographyonline.findpharma.com/lcgc/issue/issueDetail.jsp?id=15886). Improvements in ELSD instrument design, including low-temperature evaporation, have been commercialized recently (40). Potential improvements that are currently patent applications (39,41,52) or laboratory experiments (33), including condensation nucleation light-scattering prototypes (42), along with techniques such as volatile mobile phase additives (9,28,32) and higher molecular weight perfluorinated ion-pairing reagents (25,61–68), can further enhance the sensitivity of ELSD. Two overviews of ELSD have been published in LCGC (59,60) in 2003 and 2004, and an excellent review (38) of 20 years of progress in ELSD up to mid-2005 has been published. A more recent review, which includes a graph of the increase in ELSD publications versus time, also has been published (97), so our review of selected publications covering quantitative HPLC–ELSD begins in late 2004.

HPLC–ELSD is a simple, robust technique. It is especially useful for analytes without significant chromophores, or with mobile phases that have UV chromophores (43,51,79). It also has been used as a surrogate mass spectrometry (MS) detector during method development, albeit with lower sensitivity. It is a mass flow sensitive detection method — it responds to larger amounts (quantities) of analytes, and it gives a larger relative response the larger the amount or mass of the analyte passing through the detector — rather than a concentration detection method, as is UV detection. Quantitative HPLC–ELSD has been used recently to study analytes from dried leeches (44), fungi (13), and medicinal plants (7,14–16,18,22,26,27,29,45,48,49,88–92), human intestinal (28) and bronchoalveolar (2) fluids and human breast milk (72), as well as blood (12,57), bile acids (24), underivatized amino acids (44,62), sugars (46,75), lipids (4,9,12,19,24,28,50,55,56,72,76,79), foods (3,4,50,55–56,76,79–87), antibiotics (17,25,54,63–68), pharmaceutical excipients (9,11,20,21,47,58,70), surfactants (73), detergents (74), nutritional supplements (19,30,61), polymers (6,69), and many "traditional" pharmaceutical compounds (1,53,57,77). However, it has been unsuccessful with some combinatorial chemical libraries (5,8,36) to date. As a vote of confidence in quantitative ELSD, in 2006, NIST (30) published two cross-validated quantitative HPLC methods (LC–MS and HPLC–ELSD with isocratic elution) for the analysis of its Standard Reference Material 3280, Biotin. Although the LC–MS method was far superior in terms of quantitative sensitivity (LOD, LOQ), both methods produced similar quantitative results. NIST concluded that either method alone could be used potentially as a reference method for the quantification of biotin in multivitamin tablets.
Instrumental Advances and Sample and Method Considerations
Response factor and gradients: An appealing characteristic of HPLC–ELSD is that, unlike UV detection (especially at low wavelengths) with gradient elution, the baseline might not drift. Table I shows that the majority of recent publications employed gradient elution for HPLC–ELSD. However, the response factor for the analyte is not constant across the gradient in ELSD. This is a fact that might not be known by the majority of researchers who have published on quantitative HPLC–ELSD using gradient elution. However, recent publications (5,8,41,71) have emphasized this limitation and some have attempted to correct for this behavior with additional calibration curves through the entire range of mobile phase composition (for example, 0–100% A). During a gradient, the response factor for a constant amount of analyte can vary as much as 10 times in magnitude (71).

Table I
Increasing the organic content of the mobile phase increases the transport efficiency of the nebulizer, allowing a greater number of particles to reach the detection chamber, and also influences the particle size distribution of the droplets. Furthermore, different amounts of material can be delivered either as a more concentrated solution or as a greater volume of the same solution, so ELSD area ratio is predicted to (and does) change with injection volume (66). Therefore, strictly relevant calibration is required to enable quantitative use of ELSD. Single calibrant detection schemes require that all analytes have similar response coefficients to those of the reference compound. Unless the analyst can calibrate raw peak area ratios by knowing the response coefficients of each compound, and not just a single calibrant, then significant errors in quantification will occur (8). Pfizer (41) has an assigned patent application on "a method and data processing apparatus" to calibrate ELSD and correct the data for variations in the solvent concentration during gradient elution. This limitation is not unique to ELSD, but also has been documented to occur with charged aerosol detection (34), and one can speculate that it might occur in other techniques using aerosol formation, including electrospray ionization (ESI) in MS, although the authors are not aware of publications documenting this effect in ESI–MS.

Table II
Particle size and signal: There is some question about whether the diameters of the particles that reach the optical system of the newest ELSD instruments are approximately equal to the wavelength of the incident light, resulting in predominantly Mie scattering (33), or whether the particles are somewhat larger, resulting in reflection–refraction scattering, or a mixture of both mechanisms. While the instruments can be designed to optimize the amount of light that is reflected–refracted, that mechanism might not dominate in all applications.

Table III
To some extent, if there are mixed mechanisms of scattering, this contributes to nonlinear calibration plots as the percent composition of such mechanisms changes with concentration. The intensity of the scattered light is proportional to the size of the solute particles. Because the concentration of the analyte is changing over the duration of the peak, the particle size that is proportional to the concentration will change over the course of the peak. Not only does the response change with the concentration of the sample injected, it also changes within the peak. This is more pronounced with broad peaks > 3 s. The size of the particles depends upon the initial size and analyte concentration in the droplets formed by the nebulizer (43). However, the droplet size distribution from the nebulizer is transformed further by selective focusing of the larger drops to waste and the transfer function of the evaporator, but the extent of these two effects will vary between detector designs and is minimal compared with the initial droplet size and concentration in the droplet.

Table IV
Larsen (52) disclosed an invention for a "focused droplet nebulizer," an improvement over conventional nebulizers that produce variable sizes of droplets with an expanding trajectory (divergent spray). Droplets that are too small to carry sufficient analyte do not contribute to the detection signal, and a percentage of properly sized droplets with analyte are lost in the divergent spray that exits via the outlet drain. The droplet distribution strongly depends upon three factors: mobile phase composition, mobile phase flow rate, and carrier gas flow rate. This dependence is highly interactive, which makes the spray hard to control and causes the droplets to change in size and number randomly with time.

Table V
Larsen's invention uses an electronically controlled piezo membrane micropump with a check-valve system to produce uniform droplets of a predetermined size, selected within an "optimum" ELSD range of 10–100 μm with a very narrow size distribution (5% standard deviation). The droplet size is independent of droplet production rate and is not strongly dependent upon liquid composition. Furthermore, there is little spray divergence in the droplet path (1–2 degrees standard deviation). and operation can be independent of the flow rate of the carrier gas. However, it appears that HPLC columns using typical flow rates of 1 mL/min would need a flow splitter to lower the liquid flow rate into the nebulizer. Alternatively, the new sub-2-μm, 50 mm × 2.1 mm. HPLC columns can be used with conventional HPLC equipment with mobile phase flow rates of 200–300 μL/ min. These columns produce excellent chromatographic separations with short run times, and could be connected directly to this nebulizer, thus, improving sensitivity.
Peak shape and nonlinear response: The particle size is influenced by several other factors, including solute concentration along the peak profile. In fact, the use of a high gradient slope can be an advantage, resulting in sharp peaks and, thus, contributing to increased sensitivity (11). Peak broadening and asymmetry result in a decrease of ELSD response factor (17,25,66). Zhang and colleagues (51) used enantiomeric mixtures and chiral column isocratic separations with UV and ELSD quantitation of peak areas to demonstrate the variation that occurs with peak broadening, and the "peak shaving" effect of ELSD versus UV. This can be responsible for disproportionate peak areas of two enantiomers resolved from a racemic mixture when measured by ELSD, but not by UV: "When two peaks, even with equal true peak areas, are shaped differently, they are shaved differently in ELSD and the larger the peak interval, the greater the disparity in peak shape for a given pair of compounds" (51). The expanding use of sub-2-μm particle size columns, with their sharper peaks, also can improve sensitivity, assuming that the rest of the ELSD pneumatics and fluidics do not result in band broadening. Nebulizers also must be tuned for specific flow rates and evaporation chambers are likewise tuned for flow.
Dolan (94) has reiterated recently that reduction of the column length or the column diameter will improve the limit of detection (LOD). For example, reduction from a 4.6-mm i.d. column to a 2.1-mm i.d. column theoretically means a fivefold reduction in peak width and, thus, a fivefold increase in peak height. A twofold reduction in column length theoretically would result in a 1.4-fold gain in LOD, assuming the extracolumn dispersion is small. Likewise, reduction in retention time will help reduce the LOD because the peaks typically are narrower at shorter retention times. Reducing the column volume requires a proportional reduction in solvent flow rate to maintain linear velocity through the column. It is this reduction in solvent volume that improves the sensitivity of ELSD along with narrow peak widths that limit peak shaving. Most ELSD instruments today are designed to operate at both 1 mL/min and 0.2 mL/min without the need for modification to overcome additional dispersion effects. Dispersion effects become important at microliter flow rates. None of the researchers in Table I used columns packed with sub-2-μm particles, and the majority used 4.6-mm i.d. columns.
As a starting point, typically we use sub-2-μm particle size columns (50 mm × 2.1 mm) on conventional HPLC equipment with a column oven at 30–40 °C and a water–acetonitrile mobile phase at flow rates of 0.2–0.4 mL/min for all new method development. The backpressure under these conditions typically is less than 4200 psi, and we use 0.0025-in. i.d. tubing of the shortest practical length from the injector to the column and from the column to the ELSD system, usually bypassing the UV detector. These conditions usually transfer well to LC–ESI-MS. The UV detector manufacturers have modified their flow cells to reduce the volume by a factor of four, thus minimizing band broadening of these very narrow peaks. Typically, most ELSD instrument manufacturers still have tubing dimensions with internal diameters from inlet to nozzle of 0.007 in. and a length of 7.5 in., or an internal diameter of 0.005 in. and a length of 10 in. This means up to an eightfold increase in cross-sectional area of the tubing and significant band broadening, resulting in loss of resolution and sensitivity and contributing to nonlinearity due to peak widening, as discussed previously. Substitution of 0.0025-in. i.d. tubing internally for the existing larger diameter tubing would require recalibration of the instruments by the manufacturers (or introduction of new models) because this would affect the nebulization process, the evaporation chamber process, and would require tuning of the entire ELSD system. However, dispersion effects within the evaporator tube should be minimal if the tube is short and laminar flow is present. Additionally, higher sampling rates and faster filtering will be required as the efficiency of the separations is improved. However, this straightforward improvement would be of particular benefit to the ELSD method.
Light intensity: Larger particles scatter more light, and longer residence times of the particles in the light beam (affected by the gas flow rate) enhance scattering. The intensity of the light has a significant effect on the sensitivity. Gaudin and colleagues (33) reported a 16-fold increase in the LOD of ceramide when they replaced the tungsten bulb with a xenon arc lamp. Lane and colleagues (8) reported a 3–10-fold improvement in sensitivity with a blue LED (3–5 mW) light source at 480 nm for a wide range of compounds compared with a tungsten lamp. Larsen and colleagues (39) have designed a prototype high-sensitivity light-scattering detector utilizing a polarized laser and improved optical detection, which gave a 224-fold increase in sensitivity for hydrocortisone.
Mathews and colleagues (71) compared three detectors, using crystal violet as the analyte. One, which uses a red laser light source, produced a very elevated response. Another, which uses a blue light source, produced a greatly suppressed response. A third, which uses a white light source, produced a normal response. They proposed that because of the intense violet color of this compound, the red light source (670 nm) causes the molecule to fluoresce, boosting the ELSD signal. The blue light (480 nm) is absorbed selectively and not scattered, and the white light source produces a normal signal
Melting point and volatility of analyte: If particle size matters, the nature of the particle — color, refractive index, solid, crystalline, amorphous or liquid — also is important. Recently, more attention has been focused on the ELSD temperature settings (that is, nebulizer and evaporator) and the melting point (and in rare cases, the molar heat of vaporization) of the analytes (31). New ELSD instrument models offer subambient operation from 40 °C down to 10 °C. However, Table I illustrates several analytes with (unreported) melting points close to or below the evaporator temperature selected for analysis, but these studies generally were performed with older ELSD instruments that did not have the subambient capabilities that reduce background noise and facilitate lower evaporator operating temperatures. Cooling of the nebulizer occurs as a result of aerosol formation, and active cooling ensures that the nebulizer stabilizes quickly. Loss of semivolatile analytes is highly problematic because the vapor pressure of solids rarely is included in the reference literature unless the compound is known to sublime. Subambient evaporation temperatures can be set to evaporate water at 15–20 °C, which reduces the degradation of thermally sensitive compounds. Note that cooling the nebulizer is not subambient ELSD and only aids in controlling the amount of vapor reaching the optical chamber. It does not aid in increasing the detector's sensitivity to semivolatile compounds. The most productive approach is to tune the evaporation temperature to the lowest value that minimizes background scattering. Lane and colleagues (8) clearly demonstrated the important effect on accuracy and variability that the "estimated (calculated) boiling point" of the analyte can have on ELSD. Melting point also can be used as a marker for estimated boiling point in some cases (8,9,31). However, there are analytes with different physicochemical properties (that is, volatility) that can lead to unexpected results in ELSD when these properties are not considered carefully before developing the method. For example, Fries and colleagues (5) used a structurally similar compound, 7-hydroxycoumarin (unreported melting point [mp] 230 °C [dec] sublimes) as a standard to quantitate 7-ethoxycoumarin (unreported mp 88–90 °C) with an evaporator temperature of 40 °C, a nebulizer temperature of 35 °C, and a gas flow of 0.8 L/min. They found "insufficient sensitivity" and an "inconsistent inter-analyte" response. Lane and colleagues (8) found response factors of unknown impurities can differ significantly from those of each other and of the target compound. At low levels of analyte, impurities present at 1% m/m (mass to mass) might only contribute 0.2% of total area if measured by an uncalibrated area % ELSD method.
Pennanec and colleagues (35) used a low-temperature ELSD technique to compare sensitivity in detecting caffeine (mp 234–236 °C, sublimes) at 30 °C evaporator temperature versus 50 °C and found a 10-fold increase in peak height. They also found that the sensitivity of the detector improved by greater than a factor of 10 for urea (mp 133–135 °C, thermosensitive) at 25 °C versus 39 °C. Solutes in solid state scatter light more efficiently than in the liquid state. Therefore, the response decreases when the temperature of the evaporator (that is, drift tube) increases, and solutes have varying responses depending upon their melting point or molar heat of vaporization (31). As long as the temperature is not too high, the analyte remains as particles. The size of the particles depends upon the initial size and concentration in the droplets (43). An increase in temperature (at or above mp) results in the formation of liquid particles, and a solute can vaporize partially, leading to a decrease of particle size (32).
Mobile phase additives: Nevertheless, many analytes are liquids at ambient temperature, and general methods to enhance the sensitivity of ELSD have included volatile additives to the mobile phase. Deschamps and colleagues (32) used triethylamine (TEA) and formic acid together in equimolar amounts in the mobile phase (0.1 % v/v) and obtained response enhancement independent of peak geometry modification. If the solute is capable of noncovalent interactions with TEA–formic ion pairs, some TEA–formic association complexes still could be present inside the droplet, thus increasing its mass and ELSD response. These types of adducts are well known in LC–MS. However, these adducts are highly dependent upon solutes, and similar compounds can exhibit very different response enhancement (32). Karlsson and colleagues (75) replaced ammonium acetate with ammonium formate in the mobile phase because of a slightly higher response to monosaccharides with ELSD when using the same detector settings. Galanakis and colleagues (25) noted that an increase in the molecular mass of an ion pairing reagent led to an increase in response factor, possibly due to the inclusion of anions in the particles, resulting in an increase in the particle mass. In the analysis of amikacin, they found that nonafluoropentanoic acid gave a 3–4-fold increase in peak area versus trifluoroacetic acid (that is, increased sensitivity).
Chemometrics
Double logarithmic calibration: Except for limited concentration ranges in some applications (47,48,72), a nonlinear response generally is observed in ELSD as a consequence of the analyte concentration influencing the average particle size. Low amounts of compounds in the detector give responses that are much lower than expected. Also, the onset and the tail of a peak are recorded too low compared to the top; that is, peaks look sharper (shaved) and separation efficiency is artificially higher. Chromatograms are distorted in a complex manner (69). The area of the chromatographic peak (A) correlates with the analyte mass (m) according to
A = amb
where a and b are coefficients dependent upon the ELSD instrument and settings, and the mobile phase. Coefficient b can vary between 0.9 and 2 (38), and except for cases in which b = 1 (where a linear curve can be constructed), double logarithmic coordinates are necessary to obtain a linear calibration curve, or a second- or third-order polynomial to fit the data for calibration curves. Clarot (68) points out that such mathematical transformation is allowed by the ICH validation description, and NIST strongly recommends it in its SRM application (30). However, Koupparis' group (61) notes that the logarithmic nature of the calibration curve requires a relatively high number of standards to construct, and others (70) have noted that using a second-order polynomial fit (while giving a somewhat better correlation coefficient than double logarithm plots) presented tedious data processing for quantitation.
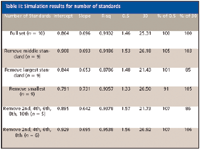
Table II: Simulation results for number of standards
Number and location of standards required: The number of standards used to calculate the standard curve varies between five and 10 when reported. There is a tradeoff between obtaining better accuracy and precision with the costs involved in additional standards preparation. Using simulation analysis, an optimal number of standards can be obtained using the double logarithmic function. Assuming x-values with a range from 0.1 to 51.2 (using serial dilution) to create the 10 standard values, a double logarithmic model is fit to generate random values of y that should lead to a linear curve. Table II gives the slope and intercept of the model including R2 when using n = 3 for each standard level. The last four columns are the backfits of two "controls" within the range of the standard curve and the percent difference from the full set of standards. It is not clear if there is a statistical difference between internal and external standards, as many of the references did not report the source of standards, but the expectation is that both sets of standards will be colinear.
From Table II it becomes evident that the number of standards is less important than the location of those standards. Removal of either the lowest standard or the highest standard is detrimental to the curve. The cost/benefit would seem to be no less than six standards well spaced across the dynamic range of the assay. Adding additional samples does not improve the fit. Figure 1 shows the full calibration curve (n = 10) with error bars on the triplicate readings.
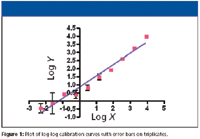
Figure 1
Of 58 references reviewed in Table I, 32 used gradient elution while 26 used isocratic. Though one might expect a higher variation in gradient elution versus the isocratic elution, based upon the data presented in the references, the isocratic elution showed higher imprecision and a slightly worse R2 when compared to the gradient elution. Additionally, between analytes and pooling across the references, the isocratic elution is much more variable. The range of R2 from the linear models for isocratic is 0.85–1.0 while the range for the gradient is 0.98–1.0. These differences were not statistically different. It is clear that many factors such as analyte and reportable range affect these results. The differences in R2 values could be a function of poor model fits or influential observations in the calibration curve.
Precision analysis: Variance components or decomposition of variance is a statistical method to partition the different sources of variation into their respective components. A book by Box, Hunter, and Hunter (95) is an excellent source for additional information on how to calculate variance components. It is important to remember that variances can be added or averaged, but not the standard deviations. Variance components allow you to calculate intra-assay and interassay precision. For a well designed experiment, reproducibility and repeatability of the method is assessed independently. For example, several publications (20,23,25) report the percent relative standard deviation (%RSD) incorrectly because many of the effects are confounded and the reported value is an overstatement of the true precision of the method. The purpose of our precision analysis is not to show that ELSD is better than other techniques, but rather to state that many of the claims of precision for ELSD are calculated incorrectly.
Slope and intercept: The slope and intercept of a log-log transformed linear model are critical parameters for predicted concentration based upon an observed response. The slope or rate of change is the change in the y variable for a 1-unit increase in the x variable. A steep slope is indicative of a highly sensitive method because a small increase in the x variable would have a large change in the y variable. For example, the slope for cholic acid (23) is 1.2479, while the slope of the cholic acid from another reference (26) is 0.8648. Table III shows the difference in sensitivity between these two methods. For a 500-unit change in the concentration, the larger slope gives more than a 44% larger response.

Table III: Effect of slope difference on sensitivity
The intercept can be interpreted as the limit of detection (LOD) if we assume that zero is part of the range of the assay. The intercept is the value of y, when x is equal to zero. If the range does not include zero, it is prudent to fit the standard curve as a no-intercept model, especially if the intercept is not statistically different than zero.
Why not use a log-log? Order magnitude of x values: Some authors prefer not to use a log-log transformation to fit the standard curve (77). Using simple linear regression without a transformation makes sense when the order of magnitude of the x values is less than 1 log scale. Additionally, if the assay range only includes the linear portion of the assay, the log-log transformation might not be necessary. A simple lack of fit test would confirm if the linear model without the transformation is ideal.
It has been noted (98) that the correlation between the response index measured from the slope of the curve and the log of the response is a linear function. Based upon the intrinsic relationship between the analyte response and analyte concentration, a transformation can be used in lieu of a log-log transformation. This relationship helps in the quantification when standards do not exist for an analyte or mixtures of analytes.
Detection limit and quantitation limits: The detection limit of an individual analytical procedure is the lowest amount of analyte in a sample that can be detected but not necessarily quantitated as an exact value. The quantitation limit of an individual analytical procedure is the lowest amount of analyte in a sample that can be determined quantitatively with suitable precision and accuracy. The quantitation limit is a parameter of quantitative assays for low levels of compounds in sample matrices, and is used particularly for the determination of impurities or degradation products (96). The ICH guideline gives several suggested methods for assessing LOD and LOQ. The most liberal approach is the visual evaluation that is reserved usually for noninstrumental methods but also can be used with instrumental methods. The detection limit is determined by the analysis of samples with known concentrations of analyte and by establishing the minimum level at which the analyte can be detected reliably. The signal-to-noise ratio (S/N) usually can be used with analytical procedures that exhibit baseline noise such as ELSD. Determination of S/N is performed by comparing measured signals from samples with known low concentrations of analyte with those of blank samples and establishing the minimum concentration at which the analyte can be detected reliably. Signal-to-noise ratios of 3:1 and 10:1 generally are considered acceptable for estimating the detection limit and quantitification limit, respectively. The meaning of a 3:1 or 10:1 ratio means that the signal needs to be, respectively, at least three times or 10 times larger than the signal of the background sample. The method based upon the standard deviation of the response and the slope is perhaps the least understood regularly used approach. The slope is estimated from the calibration curve, while the standard deviation can be on the calibration curve or based upon the standard deviation of a blank. It is clear that estimating the standard deviation from the calibration curve (sometimes called the root mean squared error) makes sense because the slope estimate comes from the same curve. The root mean squared error is an estimate of the variation in the calibration curve and is used in the estimation in the standard error of the slope estimate. Using the standard deviation of a blank sample combined with the slope of a calibration curve is disjointed. Choosing to estimate the standard deviation of a blank would not be different than doing the analysis of signal to noise (S/N), as the standard deviation of a blank also would be an estimate of the noise in the method. A good rule of thumb is to use S/N when you have either samples or standards close to the blank, and use the standard deviation of the response and slope for those methods in which the expected values are not close to the noise of the system. Regardless of the method chosen, the same approach should be utilized with both the LOD and LOQ.
Several different analysis methods have been proposed to determine LOD and LOQ including percent recovery, minimum difference from baseline, and analysis of variance. Currently, there are differences in opinion regarding the appropriateness of using analysis of variance for showing a difference between baseline and a spiked sample. The goal is not to find statistically significant differences that have no practical value, but to find statistical differences that have meaningful implications on assay performance. One proposed method that combines both the statistical rigor of analysis of variance and the appropriateness of meaningful differences from baseline is the use of equivocal tests.
Conclusion
The recent trend in the majority of publications reviewed for this article demonstrates a better understanding of the limitations and possibilities of using HPLC–ELSD for quantitation of analytes lacking chromophores, and significant improvements in ELSD instrumentation. One should use the best practices of this technique in designing quantitative analytical methods, which include prior knowledge of the analyte volatitilty and melting point, proper selection of isocratic or gradient elution with analyte-specific standards and correction factors across the gradient where appropriate, and correct statistical methods to properly analyze the data collected, keeping in mind the logarithmic nature of the technique.
References
(1) M.K. Manoj Babu, J. Pharm. Biomed. Anal. 34(2), 315–324 (2004).
(2) C. Paschen and M. Griese, J. Chromatogr., B 814(2), 325–330 (2005).
(3) K. Decroos, J.-P. Vincken, L. Heng, R. Bakker, H. Gruppen, and W. Verstraete, J. Chromatogr., A 1072(2), 185–193 (2005).
(4) C.F. Torres, L. Vazquez, F.J. Senorans, and G. Reglero, J. Chromatogr., A 1078(1–2), 28–34 (2005).
(5) H.E. Fries, C.A. Evans, and K.W. Ward, J. Chromatogr., B 819(2), 339–344 (2005).
(6) X. Jiang, A. van der Horst, V. Lima, and P.J. Schoenmakers, J. Chromatogr., A 1076(1–2), 51–61 (2005).
(7) X. Chai, S. Li, and P. Li, J. Chromatogr., A 1070(1–2), 43–48 (2005).
(8) S. Lane, B. Boughtflower, I. Mutton, C. Paterson, D. Farrant, N. Taylor, Z. Blaxill, C. Carmody, and P. Borman, Anal. Chem. 77(14), 4354–4365 (2005).
(9) L. Rabinovich-Guilatt, C. Dubernet, K. Gaudin, G. Lambert, P. Couvreur, and P. Chaminade, Eur. J. Pharm. Biopharm., 61(1–2), 69–76 (2005).
(10) R. Lucena, S. Cardenas, M. Gallego, and M. Valcarcel, J. Chromatogr., A 1081(2), 127–131 (2005).
(11) M. Agueros, M.A. Campanero, and J.M. Irache, J. Pharm Biomed. Anal. 39(3–4), 495–502 (2005).
(12) S. Aradottir, and B.L. Olsson, BMC Biochem. 6(18), (2005).
(13) L. Xu and L. Du, J. Microbiol. Methods 64(3), 398–405 (2006).
(14) H. Zhou and C. Liu, J. Chromatogr., A 835(1–2), 119–122 (2006).
(15) J. Zhao, S.P. Li, F.Q. Yang, P. Li, and Y.T. Wang, J. Chromatogr., A 1108(2), 188–194 (2006).
(16) A. Muller, M. Ganzera, and H. Stuppner, J. Chromatogr., A 1112(1–2), 218–223 (2006).
(17) J. Wang, X. Hu, Y. Tu, and K. Ni, J. Chromatogr., B 834(1–2), 178–182 (2006).
(18) J. Deng, F. Shen, and D. Chen, J. Chromatogr., A 1116(1–2), 83–88 (2006).
(19) V.D.P. Nair, I. Kanfer, and J. Hoogmartens, J. Pharm. Biomed. Anal. 41(3), 731–737 (2006).
(20) R. Forget and S. Spagnoli, J. Pharm. Biomed. Anal. 41(3), 1051–1055 (2006).
(21) L.M. Nair, J. Konkel, M. Thomas, and M. Koberda, J. Pharm. Biomed. Anal. 41(3), 725–730 (2006).
(22) M.-J. Dubber and I. Kanfer, J. Pharm. Biomed. Anal. 41(1), 135–140 (2006).
(23) S. Yan, W. Zhang, R. Liu, and Y. Zhan, Chem. Pharm. Bull. 54(7), 1058–1062 (2006).
(24) G. Kakiyama, A. Hosoda, T. Iida, Y. Fujimoto, T. Goto, N. Mano, J. Goto, and T. Nambara, J. Chromatogr., A 1125(1), 112–116 (2006).
(25) E.G. Galanakis, N.C. Megoulas, P. Solich, and M.A. Koupparis, J. Pharm. Biomed. Anal. 40(5), 1114–1120 (2006).
(26) S. Yan, G. Luo, Y. Wang, and Y. Cheng, J. Pharm. Biomed. Anal. 40(4), 889–895 (2006).
(27) Y.W. Ha, Y. Na, J. Seo, S. Kim, R.J. Linhardt, and Y.S. Kim, J. Chromatogr., A 1135(1), 27–35 (2006).
(28) E. Persson, L. Lofgren, G. Hansson, B. Abrahamsson, H. Lennernas, and R. Nilsson, J. Lipid Res. 48, 242–251 (2007).
(29) C.A. Peng, J.F.S. Ferreira, and A.J. Wood, J. Chromatogr., A 1133(1–2), 254–258 (2006).
(30) B.C. Nelson, K.E. Sharpless, and L.C. Sandler, J. Agric. Food Chem. 54, 8710–8716 (2006).
(31) G.K. Webster, J.S. Jensen, and A.R. Diaz, J. Chrom. Sci. 42, 484–490 (2004).
(32) F.S. Deschamps, A. Baillet, and P. Chaminade, Analyst 127, 35–41 (2002).
(33) K. Gaudiin, A. Baillet, and P. Chaminade, Anal. Bioanal. Chem. 384, 1302–1307 (2006).
(34) T. Gorecki, F. Lynen, R. Szucs, and P. Sandra, Anal. Chem. 78(9), 3186–3192 (2006).
(35) R. Pennanec and P. Froehlich, American Laboratory August 2005, 13–19.
(36) B. Yan, J. Zhao, K. Leopold, B. Zhang, and G. Jiang, Anal. Chem. 79(2), 718–726 (2007).
(37) M.J. Felton, Anal. Chem. Vol, issue TK, 631A–634A (2002).
(38) N.C. Megoulas and M.A. Koupparis, Critical Rev. Anal. Chem. 35, 301–316 (2005).
(39) D.W. Larsen and Z. Xu, US Patent Application # 20050179904, (2005).
(40) S.J. O'Donohue, N.J. Wrench, and P.E. Claes, US Patent Application # 20060238744, (2006).
(41) A.G. Wright, US Patent Application # 20030066803, (2003).
(42) J.A. Koropchak, S. Sadain, X. Yang, L. Magnusson, M. Heybroek, M. Anisimov, and S.L. Kaufman, Anal. Chem. News & Features June 1, 386A–394A (1999).
(43) C. Henry, Anal. Chem. News & Features Sept. 1, 561A–563A (1997).
(44) D. Yan, G. Li, X. Xiao, X. Dong, and Z. Li, J. Chromatogr., A 1138(1–2), 301–304 (2007).
(45) L. Qi, Q.Yu, P. Li, S. Li, Y. Wang, L. Sheng, and L.Yi, J. Chromatogr., A 1134(1–2), 162–169 (2006).
(46) R. Slimestad and I.M. Vagen, J. Chromatogr., A 1118(2), 281–284 (2006).
(47) D.S. Risley, W.Q. Yang, and J.A. Peterson, J. Sep. Sci. 29, 256–264 (2006).
(48) J. Wan, P. Li, S. Li, Y. Wang, T.T. Dong, and K.W. Tsim, J. Sep. Sci. 29, 2190–2196 (2006).
(49) L. Qi, P. Li, S. Li, L. Sheng, R. Li, Y. Song, and H. Li, J. Sep. Sci. 29, 2211–2220 (2006).
(50) E. Bravi, G. Perretti, and L. Montanari, J. Chromatogr., A 1134(1–2), 210–214 (2006).
(51) T. Zhang, D. Nguyen, and P. Franco, J. Sep. Sci. 29, 1517–1524 (2006).
(52) D.W. Larsen and Z. Xu, US Patent Application # 20070023037 (2007).
(53) Z. Xie, Y. Jiang, and D. Zhang, J. Chromatogr. A 1104(1–2), 173–178 (2006).
(54) A.K. Sari, N.C. Megoulas, and M.A. Koupparis, Anal. Chim. Acta 573–574, 250–257 (2006).
(55) S.C. Cunha, J.S. Amaral, J.O. Fernandes, and M.B.P.P. Oliveira, J. Agric. Food Chem. 54, 3351–3356 (2006).
(56) Y. Zhang, Y. Yang, Q. Ren, and H. Jiang, J. Liquid Chromatogr. Rel. Tech. 28, 1333–1343 (2005).
(57) M. Malm and Y. Berqvist, J. Chromatogr., B 847(1–2), 98–104 (2007).
(58) J. Rashan, Jr. and R. Chen, J. Pharm. Biomed. Anal. 44(1), 23–28 (2007).
(59) C.S. Young and J.W. Dolan, LCGC 21(2), 120–128 (2003).
(60) C.S. Young and J.W. Dolan, LCGC 22(3), 244–250 (2004).
(61) Z. Spacil, J. Folbrova, N. Megoulas, P. Solich, and M. Koupparis, Anal. Chim. Acta 583(2), 239–245 (2007).
(62) K.N. Petritis, R. Chaimbault, C. Elfakir, and M. Dreux, J. Chromatogr., A 833, 147–155 (1999).
(63) I. Clarot, P. Chaimbault, F. Hasdenteufel, P. Netter, and A. Nicolas, J. Chromatogr. 1031(1–2), 281–287 (2004).
(64) N.C. Megoulas and M.A. Koupparis, J. Pharm. Biomed. Anal. 36(1), 73–79 (2004).
(65) N.C. Megoulas and M.A. Koupparis, Anal. Chim. Acta 547(1), 64–72 (2005).
(66) J. Wang, D. Wang, H. He, and K. Ni, J. Chrom. Sci. 44, 529–534 (2006).
(67) A.K. Sarri, N.C. Megoulas, and M.A. Koupparis, J. Chromatogr., A 1122(1–2), 275–278 (2006).
(68) I. Claort, A. Regazzeti, N. Auzeil, F. Laadani, M. Citton, P. Netter, and A. Nicolas, J. Chromatogr., A 1087(1–2), 236–244 (2005).
(69) M. Bierdermann and K. Grob, J. Sep. Sci. 29, 114–122 (2006).
(70) L. Zhu, R.A. Seburg, and E.W. Tsai, J. Pharm. Biomed. Anal. 40(5), 1089–1096 (2006).
(71) B.T. Mathews, P. D. Higginson, R. Lyons, J.C. Mitchell, N.W. Sach, M.J. Snowden, M.R. Taylor, and A.G. Wright, Chromatographia 60(11–12), 625–633 (2004).
(72) M. Romeu-Nadal, S. Morera-Pons, A.J. Castellote, and M.C. Lopez-Sabater, J. Chromatogr., A 1114(1), 132–137 (2006).
(73) H.S. Park, H.R. Ryu, and C.K. Rhee, Talanta 70(3), 481–484 (2006).
(74) L. Zanna and J.F. Haeuw, J. Chromatogr., B 846(1–2), 368–373 (2007).
(75) G. Karlsson, S. Winge, and H. Sandberg, J. Chromatogr., A 1092(2), 246–249 (2005).
(76) C. Orellana-Coca, D. Aldercreutz, M.M. Andersson, B. Mattiassason, and R. Hatti-Kaul, Chem. Phys. Lipids 135(2), 189–199 (2005).
(77) A. Lemke and G. Kayser, Pharmazie 61(5), 406–408 (2006).
(78) Y. Jiang and J. Xie, Chromatographia 62(5–6), 257–261 (2005).
(79) S.C. Cunha, and M.B.P.P. Oliveira, Food Chem. 95(3), 518–524 (2006).
(80) A. Avalli and G. Contarini, J. Chromatogr., A 1071(1–2), 185–190 (2005).
(81) L. Wang, T. Wang, and W.R. Fehr, J. Agric. Food Chem. 54, 7422–7428 (2006).
(82) K. Nakagawa, T. Umeda, O. Higuchi, T. Tsuzuki, T. Suzuki, and T. Miyazawa, J. Agric. Food Chem. 54, 2479–2483 (2006).
(83) R.G. Cameron and K. Grohmann, J. Liquid Chromatogr. Rel. Tech. 28, 559–570 (2005).
(84) A. Wasik, J. McCourt, and M. Buchgraber, J. Chromatogr., A 1157, 187–196 (2007).
(85) L. Wang, T. Wang, and W.R. Fehr, J. Agric. Food Chem. 54, 7812–7816 (2006).
(86) J.S. Amaral, S.C. Cunha, M.R. Alves, J.A. Pereira, R.M. Seabra, and B.P.P. Oliveira, J. Agric. Food Chem. 52, 7964–7969 (2004).
(87) J. Lin, S. Liu, S. Chen, H. Chen, and D. Yang, J. Agric. Food Chem. 54, 9948–9954 (2006).
(88) H. Wang, J. Gao, D. Zhu, and B. Yu, J. Pharm. Biomed. Anal. (IN PRESS)
(89) T. Cui, J. Li, H. Kayahara, L. Ma, L. Wu, and K. Nakamura, J. Agric. Food Chem. 54, 4574–4581 (2006).
(90) J. Yin, G. Yang, S. Wang, and Y. Chen, Talanta 70(1), 208–212 (2006).
(91) C. Liu, J. Han, Y. Duan, X. Huang, and H. Wang, Sep. Purif. Technol. (2006).
(92) S. Feng, F. Hu, and J. Zhao, J. Chrom. Sci. 43, 522–525 (2005).
(93) S. Yan, Y. Wu, R. Liu, and W. Zhang, Chem. Pharm. Bull. 55(1), 128–132 (2007).
(94) J.W. Dolan, LCGC 25(2), 142–152 (2007).
(95) G. Box, W. Hunter, and S. Hunter, Statistics for Experimenters (Wiley & Sons, New York, 1978).
(96) Validation of Analytical Procedures: Text and Methodology Q2(R1), November (2005).
(97) R. Lucena, S. Cardenas, and M. Valcareel, Anal. Bioanal. Chem. 388, 1663-1672 (2007).
(98) S. Heron, M. Maloumbi, M. Dreux, E. Verette, and A. Tehapla, J. Chromatogr., A 1161, 152-156 (2007).

New Study Reviews Chromatography Methods for Flavonoid Analysis
April 21st 2025Flavonoids are widely used metabolites that carry out various functions in different industries, such as food and cosmetics. Detecting, separating, and quantifying them in fruit species can be a complicated process.
Extracting Estrogenic Hormones Using Rotating Disk and Modified Clays
April 14th 2025University of Caldas and University of Chile researchers extracted estrogenic hormones from wastewater samples using rotating disk sorption extraction. After extraction, the concentrated analytes were measured using liquid chromatography coupled with photodiode array detection (HPLC-PDA).

.png&w=3840&q=75)

.png&w=3840&q=75)


.png&w=3840&q=75)


.png&w=3840&q=75)


