Reversed-Phase Liquid Chromatography for the Analysis of Therapeutic Proteins and Recombinant Monoclonal Antibodies.
LCGC Asia Pacific
Two promising wide-pore stationary phases were recently introduced for the fast and high resolution separations of large biomoleculaes: the recently launched widepore 3.6?m superficially porous particle and the hybrid-type sub 2-?m fully porous particle. This article focuses on the achievable throughout and resolution for the characterization of biomolecules.
Some promising reversed-phase widepore stationary phases (organic monolithic, fully porous and coreshell type) were recently introduced for the fast and high resolution separations of large biomolecules. It was demonstrated that kinetic performance, retention capability, selectivity for closely related proteins and loading capacity, as well as recoveries, were satisfactory with recent core-shell and sub-2 μm fully porous materials. This article focuses on the achievable throughput and resolution for the characterization of biomolecules. As shown, fast separation of a therapeutic protein (~19 kDa) and some of its degradants (related proteins) was achieved in less than 1.5 min with a 50-mm column length while a peak capacity of more than 150 was obtained in about 15 min using two columns of 150 mm coupled in series. Similar results were also attained with intact therapeutic monoclonal antibodies (mAbs) of ~150 kDa and their fragments by varying the column length and gradient time. However, the recovery of intact mAbs was found to be unacceptable in reversed-phase liquid chromatography (RPLC) except when using elevated mobile phase temperature (80–90 °C).
The importance of therapeutic proteins and monoclonal antibodies is growing in the pharmaceutical field and expectations are high for this new class of compounds (1,2). Indeed, it has been established that such large biomolecules could present some significant benefits for the patient such as high efficacy, specificity, wide therapeutic range and limited side effects.
All biopharmaceuticals are inherently variable as they are produced from living organisms. This variability exists within batches, from batch to batch, and when production processes are improved or changed between manufacturers. The variability of biopharmaceuticals is greater than that typically observed for conventional pharmaceuticals and applies to originator reference products as well as biosimilars. There is consequently a need to develop analytical tools that are able to characterize such complex molecules (3,4). The analytical step is quite difficult and is based on the combination of various analytical strategies to determine identity, impurity content, heterogeneity and activity before release. Even if capillary electrophoresis and biophysical techniques (for example, circular dichroism, light scattering and fluorescence spectrophotometry) are considered as reference methods, liquid chromatography (LC) is also widely applied in analytical laboratories (5,6). Today, the analyst has the choice between (i) historical techniques, such as size-exclusion chromatography (SEC) and ionexchange chromatography (IEC) that provide suitable selectivity for charge variants and aggregates, respectively, and (ii) reversed-phase liquid chromatography (RPLC) that produces lower selectivity between closely related proteins but compensated by the sharpness of the peak because of the fast kinetic interactions in RPLC. In addition, RPLC is more directly compatible with electrospray ionization mass spectrometry (ESI–MS) detection than SEC or IEC (7).
Recently, some noteworthy improvements were brought to conventional RPLC columns to improve the performance achieved with large proteins. This includes the commercialization of various types of widepore phases such as organic monoliths with macropore sizes of 1–5 μm, core-shell particles of 2.7–5 μm and fully porous sub-2 μm UHPLC columns, which have been described in the literature. (8). In this article, two recent technologies of widepore RPLC columns were evaluated and compared for the fast and high resolution analysis of therapeutic proteins and mAbs (9,10).
Experimental
Chemicals, reagents and columns: Acetonitrile and methanol (gradient grade) were purchased from SigmaAldrich (Buchs, Switzerland). Water was obtained with a Milli-Q Purification system from Millipore (Bedford, Massachusetts, USA). Recombinant human granulocytecolony stimulating factor (G-CSF or filgrastim, MW~18.8 kDa) was obtained from Amgen (Zug, Switzerland). IgG monoclonal antibodies including rituximab (mabThera) and bevacizumab (avastin) were purchased from Roche (Roche Pharma, Basel, Switzerland). For fragmenting the monoclonal antibody, dithiothreitol (DTT) and papain (from Carica papaya) were obtained from Sigma-Aldrich (Buchs, Switzerland). Trifluoroacetic acid (TFA), 30% hydrogenperoxide and methionine were purchased from Sigma-Aldrich (Buchs, Switzerland).
Acquity BEH300 C18 and C4 columns with a particle size of 1.7 μm (50 × 2.1 mm and 150 × 2.1 mm, 1.7 μm, 300 Å) were purchased from Waters (Milford, Massachusetts, USA). Aeris Widepore (WP) C18 columns packed with 3.6 μm core-shell particles (150 × 2.1 mm, 3.6 μm) were supplied by Phenomenex Inc. (Torrance, California, USA). The Acquity BEH300 columns are packed with 1.7 μm fully porous particles with an average pore size of ~300 A (11,12), while the Aeris WP is based on core-shell technology and its particles consist of a ~3.2 μm solid inner core surrounded by a ~0.2 μm porous layer (total particle size of 3.6 μm).
In this study, two columns of 150 × 2.1 mm BEH300 were coupled in series to generate a 30-cm long column, while the 45-cm column length was prepared by coupling two columns of 150 × 2.1 mm BEH300 and one Aeris WP 150 × 2.1 mm columns in series (this was due to pressure considerations).
Instrumentation: All measurements were performed using an Acquity UPLC (Waters) system equipped with a binary solvent delivery pump, an autosampler and UV detector and/or fluorescence detector (FL). The Acquity system includes a 5 μL sample loop, a 0.5-μL UV flow-cell and a 2 μL FL flow-cell. The loop is directly connected to the injection switching valve (no needle seat capillary). The connection tube between the injector and column inlet was 0.13 mm i.d. and 250 mm long (passive preheating included), and the capillary located between the column and detector was 0.10 mm i.d. and 150 mm long. Data acquisition and instrument control was performed by Empower Pro 2 Software (Waters, Milford, Massachusetts, USA).
Scanning electron microscopy (SEM) was performed using a JEOL JSM 5500LV instrument (Budapest, Hungary).
Procedure and preparation of samples: For the gradient separation of related proteins and mAbs fragments, the mobile phase "A" consisted of 0.1% TFA in water, while the mobile phase "B" was 0.1% TFA in acetonitrile. The chromatographic conditions were optimized by a systematic variation of the gradient span and steepness, and of the column temperature and flow rate.
The intact mAbs were injected (0.5 μL) without dilution directly from the concentrated commercial solutions (10 mg/mL rituximab and 25 mg/mL bevacizumab).
The intact filgrastim was directly injected as purchased (Neupogen concentrated solution 0.3 mg/mL). Reduced and oxidized protein samples were prepared. The intramolecular disulphide bonds of filgrastim were reduced by adding a small amount of dithiotreitol (DTT) to its solution and incubating at 30 ºC for 60 min. The oxidation was performed by adding 2% (v/v) hydrogen peroxide (30%) to the protein solution. After a 3 h incubation time (at 30 °C), the oxidation was stopped by adding 0.5 mg methionine to the solution.
The IgG monoclonal antibodies possess intramolecular disulphide bonds which were also reduced with DTT. Experimentally, 0.05 mg of DTT was added to 100 μL mAb concentrated solution followed by an incubation at 30 ºC for 60 min. The proteins were completely converted to the light chain and heavy chain components of the antibodies.
Papain is a thiol protease that cleaves IgG antibodies at the heavy chain hinge region into three fragments, one fraction crystallizable (Fc) and two identical fraction antigen-binding (Fab) fragments. The digestion of rituximab and bevacizumab was initiated by the addition of papain (diluted to 100 μg/mL with water) to give a final protein:enzyme ratio of 100:1 (m/m%). The final digestion volume was 200 μL and was directly injected with the chromatographic system using low volume insert vials. The digestion was carried out at 40 °C for 3 h.
Scanning electron microscopic (SEM) images and Image-J (image-processing software) were used to show the roughness and sphericity of the particles and to determine the particle size distribution (PSD) of the different materials.
Results and Discussion
Analysis of therapeutic proteins: When dealing with therapeutic proteins, the RPLC approach is usually employed to determine the amount of impurities as well as degradants (for example, oxidized, deamidated or reduced forms) within the sample. In practice, it generally means that proteins that have very similar molecular weights and nearly identical structures (conformations) must be separated. The difference in molecular structure is relatively low; therefore, similar retention behaviours of the different forms are expected with RP phases. Selectivity is often very poor in RPLC, thus there is a need to work with experimental conditions that provide elevated kinetic performance. In this context, the last generation of RPLC columns packed with core-shell or sub-2 μm fully porous particles should be used preferentially, and elevated temperature could be a key tool because it improves the mass transfer process of large analytes as well as the secondary ionic interactions kinetics.
Preliminary evaluation of recent widepore RPLC column technology: In a recent series of papers (9,10), the performance and possibilities of both widepore coreshell and fully porous sub-2 μm particles columns were investigated in terms of kinetic performance, selectivity, retention behaviour and loading capacity for intact proteins with molecular weight comprised between 5.8 and 66.4 kDa.
In the first instance, these materials were characterized by their physical and physico-chemical properties (for example, PSD, pore volume, surface coverage, silanol activity, ligand densitiy, loadability and retention capability) (10). Figure 1 shows a SEM representation of the widepore core-shell and fully porous sub-2 μm particles and illustrates the porous layer of ~0.2 μm at the surface of the core-shell particle. The particle sizes were precisely determined as 3.6 μm (particle size distribution dp90/10 = 1.11) for the widepore core-shell material and 2.0 μm (particle size distribution dp90/10 = 1.44), instead of the 1.7 μm announced by the provider, for the fully porous sub-2 μm particles. Superficially porous particles generally displaying a very narrow PSD can lead to unprecedented low minimal reduced plate heights. It is, however, unclear whether these findings can be directly related as there are other factors that might influence the packing quality. Superficially porous particles have a higher density and some of them are rougher than fully porous particles. This might also have had an influence on the achieved packing quality and homogeneity. Two strategies were applied to evaluate the kinetic performance of these stationary phases in the gradient mode. The first one consists of calculating the peak capacities for various gradient times and for two constant flow rates. The second one maintains a similar gradient steepness for all flow rates and provides gradient kinetic plot representations based on a method proposed by Broeckhoven et al. (13). These experiments showed that both stationary phase technologies provide excellent performance with small and large proteins. In addition, these phases significantly outperform some medium pore-size materials or other reference HPLC phases of 300 A pore size. This is one of the main reasons why these two recent stationary phase technologies were selected for the characterization of therapeutic proteins and mAbs in this study.
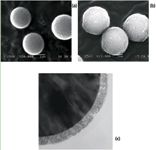
Figure 1: Scanning electron microscope (SEM) images of (a) BEH300 C18, (b) Aeris WP C18 and (c) a cut Aeris WP C18 particle.
In addition, these two phases provide a very similar retention capability and a reasonable loading capacity for proteins because of the low porous volume on the silica-based widepore core-shell material (around 30% of the total particle volume). This provides a rather limited specific area and is probably compensated by a significant contribution of secondary (ion-exchange and H-bonding) mechanisms, compared to the hybrid type fully porous sub-2 μm material (10).
Application to the fast and high resolution analysis of therapeutic proteins: Figure 2 illustrates the analysis of native filgrastim (~18.8 kDa) and its related proteins (that is, oxidized and reduced forms). This type of experiment is useful in the biopharmaceutical field, to evaluate the stability and purity of therapeutic protein samples. As shown in Figure 2(a), the baseline resolution of these different compounds can be obtained in less than 1.4 min using a 50-mm column length, at a reasonable flow rate. The peak capacity was also acceptable and this application demonstrates that high throughput analysis can be carried out even with large biomolecules. On the other hand, because of the sample complexity and the need to also separate some protein isoforms or variants, it is also mandatory to achieve high resolution separations. The separation was therefore performed with a 300mm column length at a flow rate of only 0.25mL/min. Compared with the experiment illustrated in Figure 2(a), the column length was extended by 6-fold and flow rate reduced by 2×, to provide reasonable back pressure. Then, to maintain the same gradient steepness between Figure 2(a) and 2(b), the gradient time was 12× longer. The resolving power was drastically improved with this new configuration and peak capacity was increased above 150 for an analysis time of less than 15 min. It was also possible to observe a few additional peaks of weak intensity, eluted closely to the peaks of proteins that should correspond to protein isoforms.
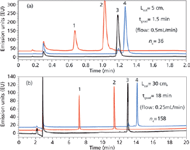
Figure 2: Fast and high-resolution separation of filgrastim related proteins. Column: Acquity BEH300 C18 2.1 mm, 1.7 μm (above: 50 mm long and below: 150 mm + 150 mm = 300 mm). Mobile phase A: 0.1% TFA in water, mobile phase B: 0.1% TFA in acetonitrile. Gradient: 47â62% B, Temperature: 80 °C, Fluorescence detection: 280â350 nm. Injected volume: 1 μL. Peaks: 1,2: oxidized filgrastim, 3: filgrastim, 4: reduced filgrastim.
Analysis of therapeutic mAbs: There are different ways of characterizing therapeutic monoclonal antibodies using RPLC. The dominant method is to completely digest these large glycoproteins of ~150 kDa, using an enzyme such as trypsin (peptide mapping approach or bottom up). The analysis is then carried out on peptides of limited size (0.5–3 kDa), but the chromatogram remains complex (because of its size, the mAb is digested into a significant number of peptides) and the digestion protocol is long and tedious. An alternative approach has been developed in the last few years and involves performing limited proteolysis (LP approach). mAb is digested with enzymes such as papain to obtain large fragments of ~50 kDa (Fc and Fab). Alternatively, pepsin, lys-C or Fabricator [a modified cysteine protease (14)] can also be employed as enzymes to obtain different fragments. Finally, the mAb can be analysed under its intact form, to determine the impurity content of the produced mAb and under its reduced form to obtain two heavy chain fragments of ~50 kDa and two light chain fragments of ~25 kDa and determine the integrity of mAb under denaturing conditions.
Adsorption of mAbs under RPLC conditions: One major issue when dealing with mAb analysis by RPLC is the adsorption phenomena. Indeed, we have recently demonstrated that adsorption of mAbs onto the stationary phase was significantly higher compared to proteins of equivalent size (15). In addition, the adsorption rate was particularly relevant with intact mAbs of 150 kDa. It decreases significantly with mAbs fragments of 50–100 kDa and becomes almost negligible with small fragments of only 25 kDa. Our previous findings also showed that the adsorption phenomenon was mostly due to secondary interactions and only to a limited extent to the pure hydrophobic interaction mechanism that occurs in RPLC. For this reason, there is no significant difference in recovery between a C4 and a C18 bonding, while there are some important differences depending on the silica matrix technology (hybrid or bare silica). To decrease the amount of secondary ionic interactions and improve recoveries of mAbs, it is necessary to increase mobile phase temperature up to 80–90 °C.
This behaviour is illustrated in Figure 3 which shows some chromatograms of intact bevacizumab [Figure 3(a)] and reduced bevacizumab [Figure 3(b)] at various mobile phase temperatures between 40 and 80 °C (the maximum temperature that the column can withstand). As shown, the adsorption was obvious with the intact mAb and no peak was observed for temperatures below 50 °C, while the recovery was acceptable at 70–80 °C. In the case of heavy and light chains of 50 and 25 kDa, respectively, the adsorption was less pronounced and this was particularly true with the light chain [first eluted peak in Figure 3(b)]. Even if elevated mobile phase temperature is a good solution to overcome adsorption, this parameter should be used with caution as it could practically denaturate large biomolecules. Thus, a compromise has to be found between temperature and residence time. According to our previous study (15), an analysis time of less than 15 min and temperature in the range 70–90 °C was a good compromise between recovery and stability of columns and analytes.

Figure 3: Representative chromatograms on the recovery of the intact, light and heavy chain of Bevacizumab. Column: BEH300 C4 (150 mm à 2.1 mm). Mobile phase A: 0.1% TFA in water, mobile phase B: 0.1% TFA in acetonitrile. Gradient: from 31% to 40% B in 6 min, flow rate: 0.3 mL/min. Temperature: from 40 ºC up to 80 ºC, injected volume: 0.5 μL, Fluorescence detection: 280â360 nm. Peak 1: light chain, peak 2: heavy chain.
Application to the fast and high resolution analysis of therapeutic mAbs: Despite the size of therapeutic mAbs and adsorption phenomena that could occur, it is possible to analyse intact mAbs and obtain sharp peaks using recent widepore stationary phases. Figure 4 demonstrates the possibility to perform some ultra-fast separations of mAbs and shows the analysis of intact and papain-digested commercial solution of bevacizumab. For this purpose, a column of 50-mm length was employed and gradient time was reduced down to only 1.6 min. Under these conditions, the peak shape remains acceptable for the intact mAb and it was also possible to separate the Fc and Fab fragments [Figure 4(b)]. However, the resolving power in these conditions was too low to adequately analyse a mAb sample.
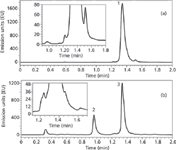
Figure 4: Fast separation of some variants of intact Bevacizumab and the Fc and Fab fragments (from papain digested sample). Column: Acquity BEH300 C4 50 mm à 2.1 mm, 1.7 μm. Mobile phase A: 0.1% TFA in water, mobile phase B: 0.1% TFA in acetonitrile. Gradient: 31â38% B in 1.6 min, flow rate: 0.5 mL/min. Temperature: 80 °C, Fluorescence detection: 280â360 nm. Injected volume: 1 μL. Peaks: 1: intact Bevacizumab, 2: Fc of Bevacizumab, 3: Fab of Bevacizumab.
In this context, longer columns and gradient times should be used when dealing with therapeutic mAb samples. Figure 5 shows the analysis of intact rituximab using various column lengths and gradient times at a temperature of 80 °C. In Figure 5(a), a C18 column of 150 mm was selected. The gradient span was limited (31–39% ACN — this is always the case in mAbs analysis), the analysis time remained as short as ~5 min. In this case, the peak capacity was quite low (nC of 55) but it is possible to significantly increase the performance by extending column length to 300 or 450 mm. With the 450-mm column length configuration, the analysis time was still acceptable, around 15 min, but peak capacity was 2-fold higher compared with the experiments on the 150mm column length. As shown in Figure 5(c), various charge variants can be separated around the peak of rituximab, but the resolution was still not sufficient to adequately characterize the commercial rituximab sample.
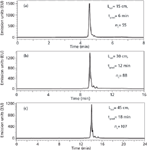
Figure 5: RP-HPLC separation of intact Rituximab variants. Columns: Acquity BEH300 C18 150 mm à 2.1 mm, 1.7 μm and Aeris WP C18 150 mm à 2.1 mm. Mobile phase A: 0.1% TFA in water, mobile phase B: 0.1% TFA in acetonitrile. 3.6 μm. Gradient: 31â39% B, flow: 0.35 mL/min. Temperature: 80 °C, Fluorescence detection: 280â360 nm. Injected volume: 1 μL.
To better visualize the heterogeneity in the peptide chains of the rituximab sample and to determine the amount of isoforms, mAb was reduced with DTT and the produced fragments (light and heavy chains) were analysed using various column configurations. The results are presented in Figure 6. Compared with Figure 5, the peak capacity values were improved by about 20%, probably because the size of the heavy and light chains was more reasonable (~25–50 kDa) than that of intact rituximab (~150 kDa), leading to better kinetic performance. The chromatograms of Figure 6 show two major peaks which corresponds to the light chain fragment eluted first as a sharp peak, and the heavy chain fragment eluted later as a more heterogeneous peak with slightly resolved isoforms. Again, the resolving power of a 150-mm column length packed with 1.7 μm was limited (nC of 68). On the other hand, when extending the column length to 450 mm and adjusting gradient time to maintain an equivalent gradient steepness [Figure 6(c)], the quality of the separation was significantly improved (nC of 124).
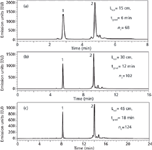
Figure 6: RP-HPLC separation of the light chain and the heavy chain variants of Rituximab. Columns: Acquity BEH300 C18 150 mm à 2.1 mm, 1.7 μm and Aeris WP C18 150 mm à 2.1 mm, 3.6 μm. Mobile phase A: 0.1% TFA in water, mobile phase B: 0.1% TFA in acetonitrile. Gradient: 31-39 %B, flow: 0.35 mL/min. Temperature: 80°C, Fluorescence detection: 280â360 nm. Injected volume: 1 μL. Peaks: 1: light chain, 2: heavy chain.
Conclusion
As demonstrated in this article, despite the large molecular mass of recombinant biomolecules, it is possible to attain sharp peaks in RPLC, thanks to the recent advances in column technology, such as the introduction of widepore fully porous sub-2 μm and widepore core-shell particles.
Depending on the goal of the method, ultra-fast (less than 2 min for a 50-mm column length) or high resolution analysis (peak capacity higher than 100 for a column of 300–450 mm) were demonstrated with these two columns for therapeutic proteins as well as recombinant mAbs. Except for the quality of the chromatographic columns, it is clear that mobile phase temperature is a key parameter for improving kinetic performance as well as limiting adsorption phenomena with mAbs. As a rule of thumb, a temperature of 70–90 °C is always useful but should be used only in combination with reasonable analysis times (up to 20 min) to avoid thermal degradation of proteins.
Acknowledgements
The authors wish to thank Dr Tivadar Farkas (Phenomenex Inc.) for providing the Aeris Widepore columns and Róbert Berky and Prof Jenö Fekete (Budapest University of Technology and Economics, Department of Inorganic and Analytical Chemistry) for the SEM measurements.
Davy Guillarme holds a PhD degree in analytical chemistry from the University of Lyon, France. Since 2004, he is a lecturer in the laboratory of pharmaceutical analytical chemistry of the University of Geneva in Switzerland, under the direction of Prof Jean-Luc Veuthey. Guillarme is co-author of more than 60 scientific papers related to pharmaceutical analysis. His expertise includes liquid chromatography, UHPLC, HILIC, LC–MS, analysis of proteins and mAbs and more recently supercritical fluid chromatography.
Szabolcs Fekete gained his PhD in analytical chemistry from the group of Prof Jeno Fekete at the Budapest University of Technology, Hungary. He has worked for over 10 years in the pharmaceutical industry in the analytical R&D field. He currently works at the University of Geneva in Switzerland under the supervision of Prof Jean-Luc Veuthey and Dr Davy Guillarme. Fekete is co-author of 30 scientific papers on liquid chromatography and pharmaceutical analysis. His main interests lay in column technology, mass transfer processes, method development, pharmaceutical and protein analysis.
References
(1) B. Leader, Q.J. Baca and D.E. Golan, Nature Rev. Drug Discov. 7, 21–39 (2008).
(2) P.A. Scolnik, mAbs 1(2), 179–184 (2009).
(3) A. Staub, D. Guillarme, J. Schappler, J.L. Veuthey and S. Rudaz, J. Pharm. Biomed. Anal. 55, 810–822 (2011).
(4) Guideline on bioanalytical method validation EMEA/CHMP/EWP/192217/2009, http://www.ema.europa.eu/docs/en_GB/document_library/Scientific_guideline/2011/08/WC500109686.pdf, consulted in March 2012
(5) S. Eeltink, B. Wouters, G. Desmet, M. Ursem, D. Blinco, G.D. Kemp and A. Treumann, J. Chromatogr. A 1218, 5504–5511 (2011).
(6) M. Swartz and I.S. Krull, LCGC North America 25(8), 718–724 (2007).
(7) A. Staub, D. Zurlino, S. Rudaz, J.L. Veuthey and D. Guillarme, J. Chromatogr. A 1218, 8903–8914 (2011).
(8) S. Fekete, J.L. Veuthey and D. Guillarme, J. Pharm. Biomed. Anal. 69, 9–27 (2012).
(9) S. Fekete, R. Berky, J. Fekete, J.L. Veuthey and D. Guillarme, J. Chromatogr. A 1236, 177–188 (2012).
(10) S. Fekete, R. Berky, J. Fekete, J.L. Veuthey and D. Guillarme, J. Chromatogr. A 1252, 90–103 (2012).
(11) I.S. Krull, A. Rathore and T.E. Wheat, LCGC North America 29(9), 838–848 (2011).
(12) I.S. Krull, A. Rathore and T.E. Wheat, LCGC North America 29(12), 1052–1062 (2011).
(13) K. Broeckhoven, D. Cabooter, F. lynen, P. Sandra and G. Desmet, J. Chromatogr. A 1217, 2787–2795 (2010).
(14)http://genovis.com/genovis/Products/Antibody-fragmentation/FabRICATOR1, consulted in April 2012.
(15) S. Fekete, S. Rudaz, J.L. Veuthey and D. Guillarme, J. Sep. Sci., DOI: 10.1002/jssc.201200297 (2012).
Extracting Estrogenic Hormones Using Rotating Disk and Modified Clays
April 14th 2025University of Caldas and University of Chile researchers extracted estrogenic hormones from wastewater samples using rotating disk sorption extraction. After extraction, the concentrated analytes were measured using liquid chromatography coupled with photodiode array detection (HPLC-PDA).
Polysorbate Quantification and Degradation Analysis via LC and Charged Aerosol Detection
April 9th 2025Scientists from ThermoFisher Scientific published a review article in the Journal of Chromatography A that provided an overview of HPLC analysis using charged aerosol detection can help with polysorbate quantification.
Removing Double-Stranded RNA Impurities Using Chromatography
April 8th 2025Researchers from Agency for Science, Technology and Research in Singapore recently published a review article exploring how chromatography can be used to remove double-stranded RNA impurities during mRNA therapeutics production.


