Capillary Electrophoresis-Mass Spectometry for the Analysis of Biopharmaceuticals
LCGC Asia Pacific
An overview of the important and versatile role that capillary electrophoresis coupled to mass spectrometry plays in the biopharmaceutical analysis.
Developments in the fields of protein chemistry and pharmaceutical biotechnology have increased the demand for suitable analytical techniques for the characterization of intact proteins. Capillary electrophoresis (CE) coupled to mass spectrometry (MS) has proven to be a powerful tool for this purpose because it combines high separation efficiency with mass selectivity. This article provides an overview of CE–MS method development work in our laboratory, for biopharmaceutical analysis applying noncovalent capillary coatings to prevent protein adsorption. Technological aspects with respect to the use of CE–MS interfaces and types of noncovalent capillary coatings applied are treated. Furthermore, some typical examples are highlighted to demonstrate the versatility of CE–MS for the analysis of biopharmaceuticals. These include the analysis of recombinant human growth hormone, recombinant human interferon-β-1a, recombinant human erythropoietin and protein–drug conjugates. We concluded that there is strong potential for CE–MS systems using noncovalent coated capillaries for purity and stability analysis of biopharmaceuticals.
Biopharmaceuticals have an increasingly important position in drug development and production (1). As for any drug designed for human use, biopharmaceuticals have to meet stringent quality requirements to ensure efficacy and safety. However, because of their macromolecular nature, the full characterization of biopharmaceuticals in terms of identity, content, purity, stability, conformation and function poses a great challenge (2,3). Moreover, multistep biotechnological production processes may show variability, introducing product diversity and different isoforms that can affect activity. With the appearance of biosimilars that are supposed to be copies of the innovator product (3), the demand for an effective quality assessment of therapeutic proteins has increased even further.

Next to techniques such as liquid chromatography (LC) and gel electrophoresis, capillary electrophoresis (CE) is a proven powerful separation technique for biotechnology-derived proteins (4). CE analyses can be performed under mild conditions without the need for organic solvents or very high salt concentrations. This allows the study of proteins without causing conformational changes or protein degradation during analysis. In CE, separations are based on differences in the charge-to-size ratio of the analytes. Therefore, subtle differences among proteins, such as those caused by post-translational modifications like glycosylation, deamidation, or phosphorylation, can be differentiated with CE. Mass spectrometry (MS) has developed into one of the most popular and useful detection techniques in separation science. MS is well suited for protein analysis because of its sensitivity and selectivity. Furthermore, MS detection with high mass accuracy and resolution, such as provided by time-of-flight (TOF) instruments, can considerably enhance the utility of CE by providing information about the identity of the separated compounds. Therefore, coupling CE to MS creates a powerful analytical tool for the characterization of intact proteins (5,6).
Despite its potential, the application of CE–MS for the analysis of biopharmaceuticals has been relatively limited. CE–MS methods that distinguish natural human growth hormone (hGH) from recombinant hGH (7) and reveal degradation products in hGH after heat exposure and prolonged storage (8,9) were introduced. Furthermore, the usefulness of CE–MS for the intact glycoform analysis of erythropoietin has been demonstrated (for example, references 10–12 and the references therein). During the last few years, our group has been working on the development of CE–MS methodologies for the characterization of intact proteins and biopharmaceuticals in particular. In this paper some representative data is provided showing the strength of the combination of CE with high-resolution TOF-MS for the characterization of protein drugs.
Technological Aspects
CE–MS Coupling: Electrospray ionization (ESI) is the main ionization technique used for the CE–MS analysis of proteins. ESI produces multiple charged protein ions in the gas phase. As a result, a so-called protein charge envelope comprising ions with mass-to-charge ratios of typically 500–3000 are obtained. Protein molecular masses can be determined by deconvolution of the ESI mass spectrum. Interfacing CE with MS via an ESI source is generally performed with a so-called sheathliquid interface (Figure 1). In the sheath-liquid interface, the CE capillary is surrounded by a second capillary in a coaxial arrangement. A sheath liquid is led through this second capillary, which merges with the CE effluent at the capillary outlet. A typical sheath liquid contains an organic solvent, water, and an acid, and has a flow rate between 2–5 μL/min. The terminating CE voltage is applied to the sheath liquid to close the electrical circuit. Often, a third coaxial tube delivers a gas flow that helps with nebulization into the ESI source. An important feature of this type of interface for protein analysis is the sheathliquid composition (13,14), because it might influence the signal intensity as well as the shape and position of the protein's charge envelop. In the studies described below, a Beckman Coulter MDQ CE instrument was coupled to a Bruker Daltonics micrOTOF mass spectrometer using a CE–MS interface from either Agilent Technologies or Beckman Coulter.

Figure 1: Schematic representation of a sheath-liquid CEâMS interface.
Capillary Coatings: Because high-molecular-weight species like proteins have relatively low diffusion coefficients, theoretically, very high plate numbers can be obtained. However, an important limitation encountered in the CE analysis of proteins is their tendency to adsorb to the fused-silica capillary wall (15). The most common approach in CE to prevent protein adsorption is to coat the inner capillary wall with nonadsorptive agents. An elegant and simple way to create effective coatings is by applying charged polymers to the fused-silica surface (16). We have demonstrated the usefulness of noncovalent polyelectrolyte coatings of polybrenepoly(vinylsulphonic acid) (PB-PVS) and polybrene-dextran sulphate-polybrene (PB-DS-PB) for CE–MS analysis of intact proteins (8,9, 17–19). The negatively charged PB-PVS coating is used in combination with a background electrolyte (BGE) of medium or high pH for the analysis of acidic proteins. For basic proteins, the positively charged PB-DS-PB coating is applied in combination with a low-pH BGE. These coatings provide highly reproducible and efficient separations for both acidic and basic proteins. Typical migration time RSD values are below 1.6% (n = 40), whereas plate numbers are generally around 100?000. The performance of these coatings in CE–MS was thoroughly studied (18) and their effectiveness against protein adsorption was also investigated in situ (20). Because of the permanent charge of the coatings, a relatively high and pH-independent electro-osmotic flow (EOF) is obtained. However, this high EOF also decreases the effective separation window, which can be limiting when more complex samples have to be analysed. Polyacrylamide coatings can be very suitable for reducing the EOF velocity to virtually zero and thereby improving the CE resolution (10). After applying such a coating, the EOF is reduced significantly, improved resolutions are obtained, and the analytical performance is not compromised.
Applications
Recombinant Human Growth Hormone: Recombinant human growth hormone (rhGH) is a therapeutic protein used in the treatment of retarded growth and dwarfism. The monograph of rhGH in the European Pharmacopoeia includes a CE–UV method using bare fused-silica capillaries for detection of charge variants of this acidic protein. The use of PB-PVS coated capillaries for rhGH analysis by CE improves the method's repeatability, resolution, and efficiency. We developed an MS-compatible CE method using a volatile BGE of ammonium formate that provides a reliable determination of potential degradation products (8,9).
The latter method was used in combination with TOFMS for the analysis of aqueous solutions of rhGH. First, a standard solution of rhGH was analysed using a BGE of high pH. A low-pH sheath liquid was used to allow efficient positive ESI. A narrow and symmetrical peak (N ~ 100000) was obtained for rhGH [Figure 2(a), peak 0]. Deconvolution of the mass spectrum obtained in the apex of the peak [Figure 2(b), mass spectrum 0] confirmed the presence of rhGH (Mw 22,124). Next, a solution that was exposed to a temperature of 40 °C for 24 h and stored for one year at -18 °C was analysed (Figure 2). Remarkably, in this sample, no unmodified rhGH was detected although the main component (peak 1) had virtually the same migration time as rhGH. Based on the observed mass difference of 32 Da with respect to rhGH, this main degradation product was identified as doubly oxidized rhGH. The three additional degradation products could also be assigned [Figure 2(b)]. Peak 2 is clearly separated from the oxidized rhGH and differs by only 0.9 Da in mass. Most likely, this compound results from a combination of oxidation (double) as well as deamidation (single) of rhGH. Note that CE–TOF-MS can distinguish protein species that differ by one charge and 1 Da only. The molecular mass of the degradation product migrating at 12.2 min (peak 3) is 128 Da higher than rhGH, which in combination with its migration after compound 2, indicates that two sulphonic acid groups may have been formed from a protein disulphide bridge in addition to the double methionine oxidation. Considering its molecular mass and migration time, the component causing peak 4 most likely is the singly deamidated form of the sulphonated and oxidized product. The use of TOF-MS detection clearly adds important selectivity to the highly efficient CE separation, thereby enhancing the reliability of the method. Peaks 1 and 3 would probably erroneously have been assigned to unmodified rhGH and a bisdeamidated product, respectively, when using CE–UV.
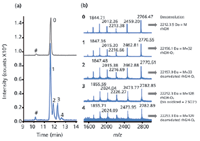
Figure 2: (a) Base-peak electropherograms obtained during CEâTOF-MS of rhGH (grey trace) and heat-exposed and stored rhGH (blue trace) using a PB-PVS coated capillary in combination with a background electrolyte of 75 mM ammonium formate (pH 8.5). The pound symbol indicates an unknown nonproteinaceous compound. (b) Mass spectra obtained in the apexes of the indicated peaks. After deconvolution, the degradation products (peak 1 to 4) were assigned based on their molecular mass and relative migration with respect to rhGH (peak 0). Adapted from reference 19.
Recombinant Human Interferon-β-1a: The drug recombinant human interferon-β-1a (rhIFN-β) is a 23-kDa N-glycosylated protein (Asn80) that is used for the treatment of multiple sclerosis. It has been demonstrated that the glycosylation of rhIFN-β may significantly affect its biological activity (21). Therefore, establishing the glycoform heterogeneity among batches of rhIFN-β is important.
rhIFN-β is a basic protein and, therefore, to avoid protein adsorption to the capillary wall, a PB-DS-PB coated capillary was selected in combination with an acidic BGE. The base-peak electropherogram (BPE) obtained after CE–MS analysis of rhIFN-β shows a distinct pattern of partially resolved bands [Figure 3(a)]. Figure 3(b) shows the deconvoluted mass spectrum obtained in the apex of the most intense peak (9.1 min), indicating a molecular mass of 22375 Da. It has been reported that the major glycoform rhIFN-β is a fucosylated disialylated biantennary structure with four hexose and five N-acetylhexosamine units (21). This glycoform, including the amino acid chain of rhIFN-β, has a molecular weight of 22375 Da, which agrees well with the observed mass. To assign the glycoforms present in the rhIFN-β sample, deconvoluted mass spectra were constructed throughout the peak pattern. From these mass spectra a total of 10 distinctive masses could be determined (Figure 4). The masses all differ either 291 Da or 365 Da with respect to each other, indicating the loss or gain of either a sialic acid (SiA) unit or a hexose N-acetylhexosamine (HexHexNAc) unit, respectively; unglycosylated rhIFN-β was not detected. With CE–MS, five out of the six glycoforms described in the European Pharmacopoeia monograph of IFN-β, which uses direct ESI-MS analysis, were observed. Moreover, CE–MS revealed additional low-abundance glycoforms with more SiA and HexHexNAc units than described in the European Pharmacopoeia. This underlines the importance of an efficient separation before MS analysis to prevent signal suppression commonly observed in ESI-MS and allows for reliable and more detailed assignment.
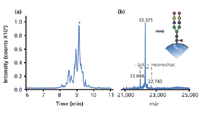
Figure 3: (a) Base-peak electropherogram obtained during CEâTOF-MS of rhIFN-β using a PB-DS-PB coated capillary in combination with a background electrolyte of 50 mM acetic acid (pH 3.0). (b) Deconvoluted mass spectrum obtained in the apex of the peak migrating at 9.1 min (denoted with an asterisk). The insert shows the assigned glycan structure with molecular weight 22,375 Da. Symbols: â/â, hexose; â², fucose; â , N-acetylhexosamine; â sialic acid. Adapted from reference 19.
For each assigned glycoform an extracted ion electropherogram (EIE) was constructed using the most abundant m/z value of the glycoform's respective charge envelope. From the EIEs, relative peak areas for all 10 detected glycoforms were obtained leading to a quantitative glycoform distribution (Figure 4). The glycoform with the lowest abundance is almost 1% in area with respect to the most abundant isoform, but could still be detected reliably with a signal-to-noise ratio of 16 (n = 3). The relative abundance of glycoforms may be useful for in-process and quality control of rhIFN-β batches or to compare biosimilar products.

Figure 4: Migration time, molecular mass, relative peak area and glycan composition for rhIFN-β glycoforms as observed with CEâTOF-MS (see Figure 3). Symbols: â/â, hexose; â², fucose; â , N-acetylhexosamine; â, sialic acid. Adapted from reference 19.
Recombinant Human Erythropoietin: Recombinant human erythropoietin (rhEPO) is a glycoprotein hormone that is frequently used for the treatment of anaemia. The protein has three N-glycosylation sites (Asn24, Asn38 and Asn83) and one O-glycosylation site (Ser126). The total glycan content can make up about 40% of the protein's molecular weight and introduces high variation in both protein structure and mass.
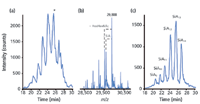
Figure 5: (a) Base-peak electropherogram obtained during CEâTOF-MS of rhEPO (epoetin-β product) using a polyacrylamide-coated capillary in combination with a background electrolyte of 2 M acetic acid (pH 2.0). (b) Deconvoluted mass spectrum obtained in the peak migrating at 25.4 min (denoted with an asterisk). (c) Composed extracted ion electropherogram (EIE) of different sialic acid isoforms with identical HexHexNAc content (Hex22HexNAc19Fuc3). The EIE was composed from the major ions of the respective charge distribution.
Although rhEPO can be analysed on charged coatings in relatively short time, the separation of its various glycoforms is not optimal (10). To obtain a more efficient glycoform separation, epoetin-β was analysed with CE–TOF-MS using a neutrally coated capillary in combination with an acidic BGE (2 M acetic acid) (Figure 5). A cluster of overlapping peaks between 18 and 30 min was obtained in this EPO product. In Figure 5(b) the deconvoluted mass spectrum obtained for the most intense peak (25.4 min) is shown. A main mass of 29888 Da is obtained. Also, a variety of other molecular masses are observed corresponding to glycoforms differing in number of HexHexNAc and SiA units [Figure 5(b)]. Deconvoluted mass spectra were constructed throughout the peak profile resulting in a total of 70 distinctive masses (Figure 6). It is impossible to derive an exact glycoform composition based solely on the intact glycoform's mass. However, from literature it is known that the glycoform with a molecular weight of 29888 Da consists of the EPO protein backbone with 22 Hex, 19 HexNAc, 3 fucose (Fuc) and 13 SiA units (10). This provides a starting point allowing for the assignment of the other glycoforms (Figure 6). Next to the different glycoforms, signals that differ either 16 Da or 42 Da from the main mass were observed in the mass spectrum (data not shown) which could be assigned to oxidation and acetylation products. Overall, approximately 200 different isoforms could be discerned in this single sample. In a different batch of the same product, a cluster of glycoforms was observed that comigrated with the SiA13–SiA15 glycoforms, but showed an increased mass of 146 Da. It was concluded that these glycoforms contain an additional Fuc residue (Figure 6).

Figure 6: Main rhEPO glycoforms and their respective carbohydrate composition as derived from CEâTOF-MS (see Figure 4). The molecular weights of the glycoforms with an additional fucose unit are indicated in italics. Their carbohydrate composition is indicated with the grey box.
To gain a better insight into the obtained glycoform separation, EIEs were created for various rhEPO glycoforms. Figure 5(c) shows a composed EIE obtained for a species containing various numbers of SiA residues, but the same amount of HexHexNAc residues (Hex22HexNAc19Fuc3). Clearly, these glycoforms are all well separated with increasing migration times for each additional negatively charged SiA to the glycan structure. The separation of HexHexNAc glycoforms bearing the same number of SiA residues is apparent, but less efficient (data not shown). Indeed, the addition of HexHexNAc residues merely results in a size difference of the protein because it does not bear any charged groups.
Sensitivity Enhancement by Sheathless Interfacing: Drug–Protein Conjugate Analysis: In the studies described above, a sheath-liquid ESI interface to couple CE to MS detection was used. However, because of the dilution of the capillary effluent by the sheath liquid, the detection sensitivity is compromised. Still, in CE–MS of intact proteins there is a definite requirement for increased sensitivity. Multiple charging of proteins occurring during ESI distributes the overall signal intensity over many charge states, thereby increasing the achievable detection limits for intact proteins. To improve the sensitivity, recently a novel sheathless interface to couple CE with ESI-TOF-MS was tested in our group for the analysis of intact proteins (22,23). The interface was developed in the laboratories of Beckman Coulter, based on a design introduced by Moini (24). In this design (Figure 7), 3–4 cm of the terminating end of the fusedsilica separation capillary is etched with hydrofluoric acid, producing a ~5-μm thick porous capillary wall allowing electrical contact when immersed in BGE. Limits of detection (LODs) between 0.5 and 1.3 nM were obtained for intact proteins with the sheathless CE–MS system using a nanoESI source, which was 50- to 140-fold better than sheath-liquid interfacing using the same capillary (22). The gain in sensitivity was the result of both reduced noise levels and increased analyte responses as obtained with sheathless CE–MS.
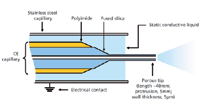
Figure 7: Schematic representation of the sheathless CEâMS capillary positioned in a stainless steel capillary. Adapted from reference 22.
The sheathless CE–MS system was used for the analysis of drug–protein conjugates (23). Kinase inhibiting drugs, such as erlotinib, were coordinatively bound to lysozyme using a BOCmethionine and a platinum-based linker [Figure 8(a)]. The reaction products (total protein concentration per preparation, 100 nM) were analysed by CE–TOF-MS. The BPE of the erlotinib-lysozyme preparation showed a pattern of peaks with migration times between 8 and 9 min [Figure 8(b)]. For all detected components, EIEs were constructed using the signal for the most intense protein charge state of the respective protein species, showing distinct and well-resolved peaks [Figure 8(c)]. Deconvolution of the mass spectra obtained in the apices of the peak provided the molecular weights of the components found. Taking into account the relative migration of the different components and the molecular masses of the platinum linker, the kinase inhibitors, the BOCmethionine residue, and lysozyme, all detected components could be assigned [Figure 8(c)]. The efficient CE separation of the highly related conjugate products could be obtained because of protein charge changes induced by drug conjugation (net reduction of positive charge). On the other hand, conjugation of the protein to the drug-platinum complex containing Pt2+ results in an increase in charge-to-mass ratio of the overall lysozyme conjugate.
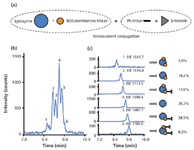
Figure 8: (a) Schematic representation of the production of drug-protein conjugates. (b) Base-peak electropherogram obtained during CEâTOF-MS of the erlotinib-ULS-BOCmet-lysozyme preparation using a positively-charged coating in combination with a background electrolyte of 100 mM HAc (pHÂ 3.1). (c) Extracted ion electropherograms for the main ion of peaks 1â6 constructed at the indicated m/z values, with interpretation and quantitation of the observed species on the right. After deconvolution, the reaction products (peaks 1â3, 5 and 6) were assigned based on their molecular mass and relative migration with respect to unreacted lysozyme (peak 4). Adapted from reference 23.
It is important to note that no BOCmethionine–lysozyme variants were detected at the same migration times of the drug–lysozyme products. This means that the platinum-coordinated drug–lysozyme conjugates do not dissociate during ESI. Furthermore, for all components discrete symmetrical peaks are obtained, which indicates that the conjugates were stable during CE separation. In addition, no shift in protein mass spectra upon drug conjugation was observed. From these observations, it is concluded that the CE–TOF-MS results accurately reflect the actual qualitative and quantitative composition of the drug–lysozyme conjugate preparations. Therefore, EIEs were used to determine peak areas for all detected components allowing a quantitative estimation of the relative composition of the preparations [Figure 8(c)]. Based on the relative peak area of each component we can derive that the different components were present in concentrations of 5–29 nM, illustrating the ability of the sheathless CE–TOF-MS system to detect low-abundant conjugates, which would not have been possible with sheath-liquid CE–MS.
Concluding Remarks
During the past few years, we have demonstrated that CE–TOF-MS using noncovalently coated capillaries represents an efficient and reproducible tool for the characterization of biopharmaceuticals. From the presented results it can be concluded that CE is especially suitable to probe protein modifications that lead to charge differences. For example, degradation products as a result of deamidation or sulphonic acid formation could be efficiently resolved from the parent compound. Also, protein glycoforms that differ in number of sialic acid groups could be separated. In cases where modifications do not affect the overall protein charge, the high mass resolution and accuracy of TOF–MS still allowed for the assignment of components. Overall, we believe that CE–TOF–MS provides a highly promising means for the qualitative and quantitative assessment of the heterogeneity of (glycosylated) biopharmaceutical products. With state-of-the-art CE equipment routinely present in laboratories of the contemporary biopharmaceutical industry, and high-quality TOF mass spectrometers becoming very accessible and affordable, we expect CE–MS to find widespread application in the near future. The application of CE–MS for the comparison of profiles of biopharmaceutical biosimilars would be very interesting and highly significant with respect to regulatory, commercial, and therapeutic issues connected to the entrance of more and more "generic" biopharmaceuticals on the market. The excellent performance provided by the CE–TOF-MS methods might allow for reliable comparisons between different batches and products. Furthermore, CE–MS analysis of monoclonal antibodies, which represent the most significant part of today's biopharmaceuticals, has hardly been explored so far. As many monoclonal antibody modifications involve a change in net charge and size of the protein, CE–MS could also be a very suitable tool for the characterization of these proteins. However, creating gas-phase ions by ESI from such high-molecularweight compounds after a CE separation will require thorough optimization of both separation and ionization parameters.
Acknowledgments
This research was supported by the Dutch Technology Foundation STW, Applied Science Division of NWO and the Technology Program of the Ministry of Economic Affairs. Vera Brinks, Robbert Jan Kok, Stefan Harmsen and Emmy Dolman of the Department of Pharmaceutics of Utrecht University and Chitra Ratnayake, Jeff Chapman and Hans Dewald of Beckman Coulter Inc. are kindly acknowledged for their input in parts of the presented work.
Rob Haselberg, Gerhardus J. de Jong and Govert W. Somsen work at the Biomolecular Analysis group of Utrecht University in The Netherlands. Please direct correspondence to: r.haselberg@uu.nl
References
(1) Pharmaceutical Research and Manufacturers of America,
(last accessed 9 December 2011).
(2) D.J.A. Crommelin, G. Storm, R. Verrijk, L. de Leede, W. Jiskoot and W.E. Hennink, Int. J. Pharm. 266, 3 (2003).
(3) H. Schellekens, Drug. Disc. Today 14, 495 (2009).
(4) J.S. Patrick and A.L. Lagu, Electrophoresis 22, 4179 (2001).
(5) R. Haselberg, G.J. de Jong and G.W. Somsen, J. Chromatogr. A 1159, 81 (2007).
(6) R. Haselberg, G.J. de Jong and G.W. Somsen, Electrophoresis 32, 66 (2011).
(7) A. Staub, S. Giraud, M. Saugy, S. Rudaz, J.L. Veuthey and J. Schappler, Electrophoresis 31, (2010) 388.
(8) J.R. Catai, J. Sastre Toraño, G.J. de Jong and G.W. Somsen, Analyst 132, 75 (2007).
(9) J.R. Catai, J. Sastre Toraño, P.M.J.M. Jongen, G.J. de Jong and G.W. Somsen, J. Chromatogr. B 852, 160 (2007).
(10) E. Balaguer, U. Demelbauer, M. Pelzing, V. Sanz-Nebot, J. Barbosa and C. Neusü , Electrophoresis 27, 2638 (2006).
(11) A. Taichrib, M. Pelzing, C. Pellegrino, M. Rossi and C. Neusü , J. Proteomics 74, 958 (2011).
(12) E. Giménez, F. Benavente, J. Barbosa and V. Sanz-Nebot, Electrophoresis 29, 2161 (2008).
(13) G. Brenner-Weiss, F. Kirschhofer, B. Kuhl, M. Nusser and U. Obst, J. Chromatogr. A 1009, 147 (2003).
(14) Z. Liang, Q. Yang, W. Zhang, L. Zhang and Y. Zhang, Chromatographia 57, 617 (2003).
(15) H. Stutz, Electrophoresis 30, 2032 (2009).
(16) C.A. Lucy, A.M. Macdonald and M.D. Gulcev, J. Chromatogr. A 1184, 81 (2008).
(17) R. Haselberg, G.J. de Jong and G.W. Somsen, J. Sep. Sci. 32, 2408 (2009).
(18) R. Haselberg, G.J. de Jong and G.W. Somsen, Anal. Chim Acta 678, 128 (2010).
(19) R. Haselberg, V. Brinks, A. Hawe, G.J. de Jong and G.W. Somsen, Anal. Bioanal. Chem. 400, 295 (2011).
(20) R. Haselberg, L. Van Der Sneppen, F. Ariese, W. Ubachs, C. Gooijer, G.J. de Jong and G.W. Somsen, Anal. Chem. 81, 10172 (2009).
(21) S. Orru, A. Amoresano, R. Siciliano, R. Napoleoni, O. Finicchiaro, A. Datola, E. De Luca, A. Sirna and P. Bucci, Biol. Chem. 381, 7 (2000).
(22) R. Haselberg, C.K. Ratnayake, G.J. de Jong and G.W. Somsen, J. Chromatogr. A 1217, 7605 (2010).
(23) R. Haselberg, M.E.M. Dolman, S. Harmsen, G.J. de Jong, R.J. Kok and G.W. Somsen, Anal. Chim. Acta 698, 77 (2011).
(24) M. Moini, Anal. Chem. 79, 4241 (2007).

Common Challenges in Nitrosamine Analysis: An LCGC International Peer Exchange
April 15th 2025A recent roundtable discussion featuring Aloka Srinivasan of Raaha, Mayank Bhanti of the United States Pharmacopeia (USP), and Amber Burch of Purisys discussed the challenges surrounding nitrosamine analysis in pharmaceuticals.

.png&w=3840&q=75)

.png&w=3840&q=75)


.png&w=3840&q=75)


.png&w=3840&q=75)


