Rapid Sample Preparation and Fast GC–MS–MS for the Analysis of Pesticides and Environmental Contaminants in Fish
LCGC Europe
A rapid, high-throughput analytical method was developed and evaluated for the simultaneous determination of pesticides and environmental contaminants in fish.
Volume 28 Number 2
Pages 78–87
A rapid, high-throughput analytical method was developed and evaluated for the simultaneous determination of pesticides and environmental contaminants in fish. The compounds included polycyclic aromatic hydrocarbons (PAHs), polychlorinated biphenyls (PCBs), polybrominated diphenyl ethers (PBDEs), and flame retardants. The method was based on a QuEChERS (quick, easy, cheap, effective, rugged, and safe) technique with acetonitrile extraction, and a dispersive solid-phase extraction (dSPE) cleanup. Three sorbent combinations were compared for cleanup efficiency and recoveries of the contaminants: C18+PSA, traditionally used for lipid removal in dSPE, and two novel sorbents, based on silica coated with zirconium dioxide (ZrO2) and ZrO2/C18, designed for phospholipid removal. The dSPE cleanup with ZrO2 sorbent provided the highest efficiency with the lowest baseline, as well as satisfactory recoveries (70–120% calculated based on isotope-labelled internal standards) for most analytes. The method allows for quick sample preparation of fish samples for the analysis of almost 200 targeted contaminants using fast, low-pressure gas chromatography with tandem mass spectrometry (low-pressure GC–MS–MS), thus providing a wide scope of analysis.
Advances in pesticide residue analysis in recent years has led to the development of methods for the analysis of multiple pesticides of different classes with a single sample preparation technique and preferably one chromatographic run. Other classes of contaminants, which were previously analyzed by separate methods, requiring either a different sample preparation technique or an additional chromatographic run, are now integrated into multiclass, multiresidue methods, allowing for faster, less expensive, high-throughput analysis. Thus, we recently reported a method for the simultaneous determination of >140 pesticides (1) and 50 environmental contaminants (2) in fish using fast sample preparation based on QuEChERS (quick, easy, cheap, effective, rugged, and safe) extraction and dispersive solid-phase extraction (dSPE) and low-pressure vacuum-outlet gas chromatography with tandem mass spectrometry (low-pressure GC–MS–MS). The reported method covers a wide range of pesticides along with legacy and novel environmental contaminants: polychlorinated biphenyls (PCBs), polyaromatic hydrocarbons (PAHs), polybrominated diphenyl ethers (PBDEs), and flame retardants, providing wide analytical scope. The method allows for rapid and simple sample preparation (10 homogenized fish samples can be prepared in 1 h), and low-pressure GC–MS–MS affords a fast (9-min) separation of more than 200 analytes, achieving high throughput. The method can easily be extended to include additional GC-amenable emerging contaminants as the need arises.

(PHOTO CREDIT: ANDIPANTZ/GETTY IMAGES)
During the extraction of complex matrices, multiple unwanted components from the matrix are extracted along with the compounds of interest. These coextractive matrix compounds may fill the active sites of the GC inlet and column causing matrix-induced ion enhancement (3), resulting in overestimating of the calculated concentrations. After continuous accumulation of matrix compounds on the inlet liner and the front part of the GC column, opposite effects can be observed - a "matrix-induced diminishing effect" (4), or a reduced ion signal, leading to underestimating of the calculated concentrations. Matrix compounds may also cause retention time shifts and analyte peak distortion, thus compromising quality of the analysis.
To remove interfering matrix compounds from extracts, various cleanup procedures such as gel permeation chromatography, solid-phase extraction, column chromatography, and others are commonly used. These techniques are laborious and time-consuming, and require large amounts of organic solvents. Sample cleanup by dSPE is fast and inexpensive, and removes coextractive interfering matrix components while requiring no solvents for conditioning sorbents or eluting compounds of interest. Sorbents such as C18 and primary secondary amine (PSA) are traditionally used for dSPE cleanup of fish extracts. Recently, two novel zirconium dioxide-based (ZrO2) sorbents, specifically designed to remove phospholipids, were introduced. A sorbent based on silica coated with ZrO2 is recommended for samples with <15% fat, and a sorbent based on silica coated with ZrO2 and incorporated C18 (ZrO2/C18) is recommended for samples with >15% fat.
In this article, we aim to evaluate and compare the C18+PSA, ZrO2, and ZrO2/C18 sorbents for dSPE in terms of coextractive removal efficiencies and target analyte and internal standard recoveries, evaluate matrix effects and identify matrix compounds causing them, and investigate how these matrix compounds alter the chromatographic behaviour of coeluted analytes. Lastly, we sought to examine the relationship of analyte recoveries on different sorbents and their log Kow values.
Experimental
Sample Preparation: Sample preparation was as follows: First, 10 g of homogenized fish sample was placed into a 50-mL polypropylene centrifuge tube, and internal standards and analytes were added for recovery experiments. After 15 min, 10 mL of acetonitrile was added and the tube was vigorously shaken by hand for 30 s. Then the entire extract, including the tissue, was poured into another 50-mL centrifuge tube containing 4 g of anhydrous magnesium sulphate and 1 g of sodium chloride and was vigorously shaken by hand for 1 min. The tube was then centrifuged for 2 min at 3250 rcf. Then, 1 mL of the extract was placed into a 2-mL centrifuge tube for dSPE cleanup with 150 mg of anhydrous magnesium sulphate and either 50 mg of C18 plus 50 mg of PSA; 50 mg of ZrO2; or 50 mg of ZrO2/C18. The tubes were then shaken vigorously for 30 s and centrifuged for 2 min at 3250 rcf. Lastly, 0.5 mL of the treated extract was transferred into an autosampler vial and subjected to low-pressure GC–MS–MS analysis.
Sorbents for dSPE: J.T. Baker Bakerbond C18 sorbent (40 µm) was purchased from Thomas Scientific. Primary secondary amine (PSA) was purchased from UCT, and zirconium dioxide-based Supel QuE Z-Sep (ZrO2) and QuE Z-Sep Plus (ZrO2/C18) sorbents were purchased from Supelco.
Low-Pressure GC–MS–MS: An Agilent Technologies 7000B triple-quadrupole mass spectrometer with electron ionization (EI) interfaced to an Agilent 7890A gas chromatograph was used. The GC instrument had a 220-V fast oven heating upgrade, which allowed for fast heating rates. A 15 m × 0.53 mm, 1-µm df Rti-5ms Restek GC column was used, and it was connected to a 5 m × 0.18 mm non-coated guard column (Restek) at the injector, and to a 17 cm × 0.53 mm phenyl-methyl deactivated guard column (Restek) at the transfer line with Ultimate union column connectors (Agilent) as previously described (2). The carrier gas was ultrahigh-purity helium at a 2-mL/min constant flow rate. The GC oven temperature programme was as follows: 70 °C for 1.5 min, 70–180 °C at 80 °C/min, 180–250 °C at 40 °C/min, 250–320 °C at 70 °C/min, and then 320 °C until a total run time of 9 min was reached. The transfer line and ion source were set at 250 °C and 320 °C, respectively. The triple-quadrupole collision gas was nitrogen at 1.5 mL/min and the quench gas was helium at 2.25 mL/min. The EI energy was –70 eV, the quadrupole temperatures were set at 150 °C, and the solvent delay was at 2 min. A multimode inlet (MMI, Agilent) was operated as a programmable temperature vaporizer (PTV) with solvent vent mode of He flow at 50 mL/min, and the injection volume was 5 µL. The inlet temperature programme was as follows: 80 °C for 0.31 min (at which point the vent was closed), 80–420 °C at 320 °C/min, and 420 °C for the rest of the GC run.
Coextractives Determination: A sample of 10 g of catfish was extracted with 10 mL of acetonitrile by shaking for 1 min; the entire extract, including the tissue, was then poured into another 50-mL centrifuge tube with 4 g of anhydrous magnesium sulphate and 1 g of sodium chloride, vigorously shaken for 1 min, and centrifuged as described above. An aliquot of the extract (2.5 mL) was placed into a previously weighed glass tube, evaporated to dryness with nitrogen, and dried in the oven at 100 °C for 20 min; at that point the tube with extractable residue was weighed again. To compare the coextractive removal efficiency, portions of 5 mL of the extract were placed into three previously weighed glass tubes and were treated with C18+PSA, ZrO2, and ZrO2/C18, 250 mg in each case, all in combination with 750 mg of anhydrous magnesium sulphate. After the tubes were centrifuged, 2.5 mL of the treated extracts was evaporated to dryness and dried in the oven at 100 °C for 20 min, and the tube was weighed again. The experiment was conducted in triplicate.
Three sets of matrix-matched calibration curves were prepared in catfish extracts after each dSPE cleanup (C18+PSA, ZrO2, and ZrO2/C18) as described above. Analyte and internal standard solutions were added to the treated extracts to yield needed concentrations for six calibration points. The solvent-only calibration curve was prepared in acetonitrile.
Results and Discussion
Coextractive Compounds and Matrix Effects: Coextractive matrix compounds may alter chromatographic behaviour of analytes and cause matrix effects, leading to inaccurate quantification. Therefore, it is important to develop a sample preparation procedure that yields as few coextractive components as possible. In this method, we selected acetonitrile as an extraction solvent because of its ability to extract compounds with a wide range of polarities without coextracting a significant amount of fat or lipids compared to nonpolar solvents (such as hexane or ethyl acetate). For example, the amount of total lipid and fat in catfish is approximately 6% (5), and using acetonitrile for extraction, the total measured amount of coextractives was 8 mg/g, or 0.8%.

Figure 1: Coextractive materials removal efficiency.
Dispersive SPE is commonly used to remove coextractive materials that interfere with the analysis of target analytes. In this work, three different sets of sorbents in dSPE were compared: C18+PSA, ZrO2, and ZrO2/C18, each in the amount of 50 mg per 1 mL of extract, all in combination with 150 mg of anhydrous magnesium sulphate.
Coextractive material removal efficiency was estimated gravimetrically by measuring the difference in weight before and after each dSPE treatment and calculated using the following formula:

Figure 1 shows the glass tubes from our experiments with coextractive materials before and after dSPE with C18+PSA, ZrO2, and ZrO2/C18. As it can be seen, the tube after dSPE with ZrO2/C18 still had an appreciable amount of coextractive material that was not removed. The calculated removal efficiency was 80% for C18+PSA, 66% for ZrO2, and 56% for ZrO2/C18 dSPE. This means that 1 mL of extract after dSPE cleanup contained 1.6 mg (C18+PSA), 2.72 mg (ZrO2), or 3.52 mg (ZrO2/C18) of coextractive materials, and with an injection volume of 5 µL, 8 µg (C18+PSA), 13.2 µg (ZrO2), or 17.6 µg (ZrO2/C18) of coextractives were introduced in the GC injector with each injection. Although the amounts of matrix compounds left in the extract seem very small, they may still affect chromatographic behaviour of coeluted analytes and cause matrix effects. Matrix-matched calibrations were used to account for matrix effects in each dSPE treatment. Difference in adsorption of analytes on active sites in neat solvent and sample extract containing matrix compounds can be seen as a difference between slopes of solvent-only and matrix-matched calibration curves. For example, Figure 2(a) shows solvent-only and matrix-matched calibration curves for triphenyl phosphate, a flame retardant. Matrix effects (ME in equation 2) were calculated as a difference between the slope of the matrix-matched (MM) calibration curve for each dSPE treatment and solvent-only (SO) calibration curve.

Calculated matrix effects for triphenyl phosphate were 4% (C18+PSA), 24% (ZrO2), and 25% (ZrO2/C18) (Figure 2[a]), based on peak areas (not normalized to an internal standard), illustrating signal enhancements in matrix-matched calibration by up to 25%. However, when normalized to the internal standard, 13C18-triphenyl phosphate, calculated matrix effects were 4% (C18+PSA), –2% (ZrO2), and 1% (ZrO2/C18) (Figure 2[b]).
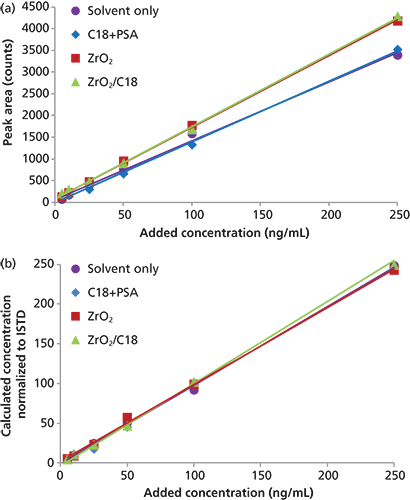
Figure 2: Solvent-only and matrix-matched calibration curves for triphenyl phosphate prepared using dSPE with C18+PSA, ZrO2, and ZrO2/C18 based on (a) external calibration and (b) normalized to an internal standard.
In another example, matrix effects calculated for o,p'-DDE based on peak areas were –3% (C18+PSA), –19% (ZrO2), and –51% (ZrO2/C18) (Figure 3[a]), revealing a less common example of signal diminishing effect (4) by up to 51%. However, when using the internal standard fenthion-d6, calculated matrix effects were –3% for C18+PSA, 0% for ZrO2, and –3% for ZrO2/C18 (Figure 3[b]). These examples demonstrate the value of internal standards to compensate for matrix effects and eliminate the need for matrix-matched calibration in some cases. Similar findings were reported for matrix effects of multiple pesticides in various food crops (6). Indeed, it is difficult, if not impossible, to have "clean", contaminant-free materials to prepare matrix-matched calibrations for many matrices. In case of "megamethods" with multiple analytes of different types, it is rare to find such an "analyte-free" matrix.

Figure 3: Solvent-only and matrix-matched calibration curves for o,p'-DDE prepared using dSPE with C18+PSA, ZrO2, and ZrO2/C18 based on (a) external calibration and (b) normalized to an internal standard.
Interestingly, calculated matrix effect values for triphenyl phosphate and o,p'-DDE gave Pearson correlation coefficients of 0.93 and –0.96, respectively, when linked to the amounts of coextractive materials for each dSPE treatment.
Furthermore, we looked into what particular coextractive compounds may cause matrix effects. Extracts treated with the three dSPE sorbents were run in scan mode, and total ion chromatograms (TICs) for these extracts are shown in Figure 4. Deconvolution software (Agilent Mass Hunter) and the National Institute of Standards and Technology (NIST) 2011 library identified 24 compounds in the range of 3–7 min on the TIC after dSPE with C18+PSA, 29 compounds in extracts treated with ZrO2 dSPE, and 17 compounds in extracts treated with ZrO2/C18. Most of these compounds were lipids, fatty acids, and their derivatives. Although fewer coextracted compounds were identified in the ZrO2/C18 chromatogram, their intensities were greater than those treated with C18+PSA or ZrO2 (Figure 4). Two of the largest peaks, identified on the TICs, were oleic acid (tR = 4.4 min) and octadecanoic acid (tR = 4.9 min), fatty acids from animal and vegetable fat and oil. Oleic acid amounts, calculated from peak areas, which remained in the extracts after dSPE cleanup with C18+PSA and ZrO2, were 20% and 13%, respectively, of the amount of oleic acid in the extract after dSPE with ZrO2/C18 (100%), suggesting that ZrO2/C18 was not effective in removing this fatty acid. Likewise, octadecanoic acid amounts were 13% (C18+PSA) and 2% (ZrO2) of the amount of this acid in ZrO2/C18 (100%). Pearson correlation coefficients for peak areas of oleic and octadecanoic acids and amounts of coextractive materials in these extracts were 0.89 and 0.88, respectively, proposing their significant contributions to the total amount of coextractive materials. The compound o,p'-DDE is coeluted with octadecanoic acid, and therefore may be affected by this coextractive interference. In fact, a good correlation was observed for matrix effects calculated for o,p'-DDE and the peak areas of octadecanoic acid for the three dSPE treatments, with r2 = 0.97.
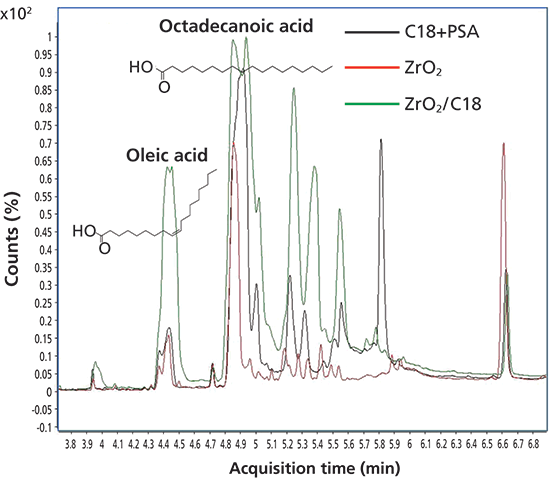
Figure 4: Overlaid total ion chromatograms for C18+PSA, ZrO2, and ZrO2/C18 dSPE treatments.
Figure 5 shows an extracted ion chromatogram for ion 176 representing o,p'-DDE at tR = 4.854 min for the three dSPE treatments and corresponding o,p'-DDE multiple reaction monitoring (MRM) chromatograms of the same extracts. MRM peak widths for o,p'-DDE were 2.98 ± 0.19 s for C18+PSA treatment, 2.97 ± 0.33 s for ZrO2, and 3.90 ± 0.39 s for ZrO2/C18 for n = 10 injections. The peak on the ZrO2/C18 MRM chromatogram was wide and asymmetrical with visible tailing, perhaps showing an example of interference by coeluted matrix compounds.
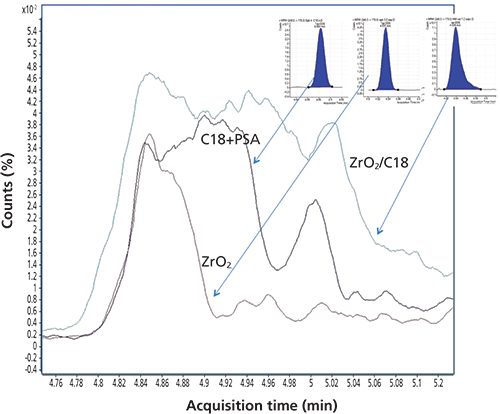
Figure 5: Extracted ion chromatogram for ion 176 representing o,p'-DDE at tR = 4.854 min for extracts treated with C18+PSA, ZrO2, and ZrO2/C18.
ZrO2 treatment removed the highest amounts of both oleic and octadecanoic acids in our experiment, and thus provided the "cleanest" chromatograms with lowest background levels. Several publications to date have described successful applications of ZrO2 in dSPE for cleanup of matrices with high amounts of lipids, and agreed that compared to C18+PSA and ZrO2/C18, ZrO2 provided the cleanest extracts, lowest background noise on the chromatograms, lowest amounts of coextractive matrix compounds (7), and highest amounts of analyzed contaminants showing acceptable recoveries and the lowest standard deviations.
Recovery Study: As the need for multiresidue, multiclass analysis of contaminants in foods and environmental samples continues to increase, megamethods covering multiple classes of contaminants in one uncomplicated technique are being introduced. As we have demonstrated, the use of internal standards helps to account for matrix effects and enables quite accurate quantification. Because it is impractical to match every single analyte with the isotope-labelled internal standard, efforts were made in our method development to use one representative internal standard labelled with an isotope or an alternate label for each class of contaminants. Thus, all organophosphate flame retardants were quantified with 13C18-triphenyl phosphate, all PCB congeners with 13C12-PCB 153, all PBDE congeners and brominated flame retardants with fluoro-BDE 126 (FBDE 126), and all pesticides with fenthion-d6. PAHs were quantified with various isotope-labelled PAHs because surrogate PAH cocktails are readily available and relatively inexpensive.
The recoveries of nearly all analytes were within the acceptable range of 70–120% while using calculations normalized to the internal standards (1,2). In the present study, we attempted to estimate "real" recoveries of the analytes without internal standard correction and recoveries of representative internal standards. This information gives a valuable insight into what quantity of analytes and internal standards were lost during the sample extraction and cleanup process. Recoveries were calculated as an average for all representative compounds of one class: PCBs, PBDEs, PAHs, flame retardants, and pesticides. For the three dSPE treatments, the average recoveries of representative compounds in a class and corresponding internal standards were as follows: PBDEs: 32–38%, internal standard FBDE 126: 34–46%; PCBs: 31–38%, internal standard 13C12-PCB 153: 31–38%; PAHs: 39–46%, internal standard acenaphthylene-d8: 33–64%; flame retardants: 36–45%, internal standard 13C18-triphenyl phosphate 50–58%; and pesticides: 71–108%, internal standard fenthion-d6: 104–121% (Figure 6). For all classes of contaminants, except for pesticides, the recoveries were 2–3 times lower when not normalized to an internal standard, reflecting incomplete recovery during the sample preparation process. For pesticides, however, the recoveries were comparable with and without normalizing to an internal standard. For all classes, except for PAHs, the recoveries using dSPE with ZrO2 were greater compared to the use of dSPE with C18+PSA or ZrO2/C18 (Figure 6). Also, standard deviations for dSPE with ZrO2/C18 were greatest compared to the other two treatments, compromising the repeatability of the method. Some of the matrix effects and coextractive compounds discussed above may be responsible for higher standard deviations in extracts treated with ZrO2/C18.
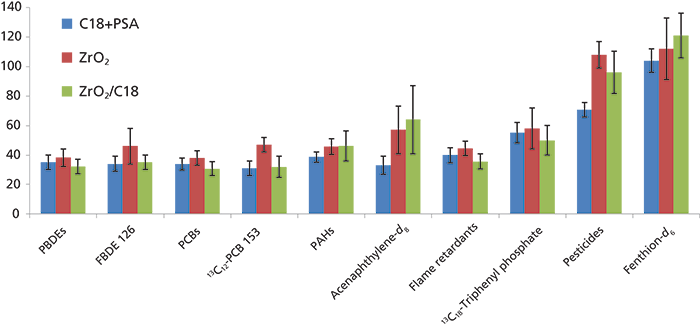
Figure 6: Average recoveries (%) of PBDEs, PCBs, PAHs, flame retardants, and pesticides and representative internal standards. Error bars represent standard deviations (%).
Correlation Between Recoveries and Log Kow Values: As is well known, the octanol–water partition coefficient, log Kow, is one of the factors affecting sorption of organic compounds. During a dSPE step, organic compounds in the extract undergo a sorption–desorption process on the sorbent, with their recoveries representing their retention on the sorbent. We explored a correlation between recoveries of targeted analytes from various classes and their log Kow values. For all classes of contaminants, except for PAHs, Pearson correlation coefficients were negative, indicating that increasing log Kow values lead to decreased recoveries. Chemicals with higher log Kow values are more lipophilic, and therefore tend to have a higher affinity for lipids, adsorbed by the sorbent during the SPE cleanup process. Similar to our study, Rajski and colleagues (7) examined the relationship of 92 pesticide recoveries from fatty matrices and log Kow, and concluded that the majority of pesticides with higher log Kow values exhibited lower recoveries.
The correlations were more pronounced for PBDE and PCB congeners, which are homologues with similar structures, unlike other classes of chemicals that include compounds with rather diverse chemical structures. Thus, for PBDE congeners, the calculated correlation coefficients were as follows: –0.95 for C18+PSA, –0.99 for ZrO2, and –0.99 for ZrO2/C18 (Figure 7). For PCB congeners, the correlation coefficients were –0.70 for C18+PSA, –0.85 for ZrO2, and –0.88 for ZrO2/C18 (Figure 7). In contrast to the negative correlation observed for all pesticides, PCBs, PBDEs, and flame retardants on all sorbents, the correlation coefficient for PAHs was negative only for ZrO2/C18 treatment (–0.90), and weakly positive for C18+PSA (0.44) and ZrO2 (0.28).
Figure 7: Correlation between recoveries (%) and log Kow values for (a) pesticides, (b) PAHs, (c) PBDEs, (d) flame retardants, and (e) PCBs.
Another interesting relationship was observed between tR and log Kow. Pearson correlation coefficients were 0.99 for PAHs, 0.95 for PBDEs, 0.98 for PCBs, 0.92 for flame retardants, and 0.55 for pesticides.
Conclusions
In this study we compared the efficiency of the three sorbents for dSPE cleanup of fish extracts for the analysis of pesticides and environmental contaminants: C18+PSA, ZrO2, and ZrO2/C18. C18+PSA removed the highest amounts of coextractive materials by weight (80%), followed by ZrO2 (66%) and ZrO2/C18 (55%). In terms of target analyte recovery, ZrO2 provided the highest recoveries for most contaminants, and ZrO2/C18 showed the highest standard deviations, possibly caused by matrix interferences. Recoveries of analytes not normalized to internal standards were 2–3 times lower for all classes, except for pesticides, reflecting losses during the sample preparation.
Two major coextractive compounds identified in the extracts that contributed to matrix effects were oleic and octadecanoic acid, and dSPE with ZrO2 removed these compounds most effectively. Peak shapes and widths were altered by coeluted matrix interferences as we observed in the case of o,p'-DDE.
Calculated matrix effects for triphenyl phosphate and o,p'-DDE based on peak areas were lowest for dSPE with C18+PSA, followed by ZrO2 and ZrO2/C18; however, they were ≤4% for all the treatments when normalized to internal standards, indicating the need to use an internal standard to compensate for matrix effects. Finally, Pearson correlations were reported for compound recoveries and tR and log Kow values.
Acknowledgements
Technical assistance of Tawana Simons of the USDA/Agricultural Research Service is greatly appreciated. Dr. Olga Shimelis of Supelco is acknowledged for providing Z-Sep and Z-sep Plus sorbents.
Disclaimer
Mention of trade names or commercial products in this publication is solely for the purpose of providing specific information and does not imply recommendation or endorsement by the U.S. Department of Agriculture. USDA is an equal opportunity employer.
Yelena Sapozhnikova, PhD, is a research chemist in the Eastern Regional Research Center at the Agricultural Research Center with the United States Department of Agriculture in Wyndmoor, Pennsylvania, USA.
References
(1) Y. Sapozhnikova, J. Agric. Food Chem.http://dx.doi.org/10.1021/jf404389e (2014).
(2) Y. Sapozhnikova and S.J. Lehotay, Anal. Chim. Acta758, 80–92 (2013).
(3) D.R. Erney, A.M. Gillespie, D.M. Gilvydis, and C.F. Poole, J. Chromatogr.638, 57–63 (1993).
(4) J. Hajslova and T. Cajka in Food Toxicants Analysis, Y. Pico, Ed. (Elsevier, Oxford, UK, 2006), pp. 419–473.
(5) USDA National Agricultural Library. Nutrient Data Laboratory. Available at: http://ndb.nal.usda.gov/ndb/foods/show/4673?qlookup=15234&fg=&format=&man=&lfacet=&max=25&new=1. (Accessed 20 June 2012.)
(6) H. Kwon, S.J. Lehotay, and L. Geis-Asteggiante, J. Chromatogr. A1270, 235–245 (2012).
(7) L. Rajski, A. Lozano, A. Uclés, C. Ferrer, and A.R. Fernández-Alba, J. Chromatogr. A1304, 109–120 (2013).

Characterizing Plant Polysaccharides Using Size-Exclusion Chromatography
April 4th 2025With green chemistry becoming more standardized, Leena Pitkänen of Aalto University analyzed how useful size-exclusion chromatography (SEC) and asymmetric flow field-flow fractionation (AF4) could be in characterizing plant polysaccharides.


