Quantitative Analysis of the Composition of Tea Tree Oil
The Application Notebook
The analysis of tea tree oil requires a severe quality control due to its potential to induce and elicit skin allergies. Tea tree oil is an essential oil and consists of a large number of constituents. Heart-cut Multidimensional GC–MS is very well suited to analysis of samples of such high complexity.
Luigi Mondello,1 Danilo Sciarrone1 and Margit Geissler,2
1 Dipartimento Farmaco-Chimico, University of Messina, Italy, 2 Shimadzu Europa GmbH, Duisburg, Germany.
Introduction
Essential oils are complex mixtures comprising of many different components. Single components have a special chemical effect, but the sum of all compounds characterizes an essential oil. The composition of the essential oil depends on the climate and soil in which a plant grows. The amount of a compound can even vary from year to year.
Tea Tree Oil
Tea tree (Melaleuca alternifolia) oil is an essential oil that is steam distilled from the leaves of the tea tree, native to Australia. The oil has fresh and pleasant odour, and some medical properties of odour eliminating as well as antibacterial and antiseptic action. Historically, the leaves were used as a substitute for tea, which is how tea tree oil got its name.
Tea tree oil components will vary depending on the growing environment including air and sunlight conditions.
Tea tree oil has found increasing use in certain consumer products including cosmetics. A number of recent dermatological publications indicate that the neat oil has a potential to induce and elicit skin allergies. Dilute solutions have a weaker sensitization potential. As the European Cosmetic Toiletry and Perfumery Association (COLIPA) recommends keeping tea tree oil content in industrial commodities at 1% or below, strict quality control is required.
Heart-cut Multidimensional GC–MS
Due to the complexity of the samples, tea tree oil in this application was analysed using Heart-Cut Multidimensional GC–MS.
Complex samples often cannot be completely characterized by a conventional GC–MS analysis using one single column. Either the matrix content of the sample is too high or the compounds cannot be separated on one column as they are too similar (e.g., optical isomers).
In this case, the use of a second column can solve the separation problem. In the MDGC-2010 system, compounds that could not be separated in the first chromatographic system are transferred to a second capillary column with a different separation mechanism. In this way, two compounds co-eluting on the first column can be identified and quantified on the second column independently of each other. Effectively, the peak capacity of the chromatographic system is increased.
In contrast to traditional heart-cut systems, the MDGC-2010 GC–MS system allows several cuts without showing any shifts of retention times. The user only needs to run one chromatogram to fix all the cut times. Method development for target compound analysis in difficult samples becomes very easy:
- run the standard on the first column (1 run only)
- determine the cut times (unlimited number of cuts)
- run the sample
Analytical Conditions
Tea tree oil diluted 1–10
GC — 1
Column: SLB-5MS 30 m × 0.25 mm i.d. × 0.25 mm f.t. (Supelco, Milan, Italy)
Column head pressure: 200 kPa, helium (constant mode), auxiliary pressure (APC) — 130 kPa, helium
Oven temperature programme: from 50 °C to 280 °C at 3 °C per minute, transfer line — 180 °C
Detector FID (310 °C), H2: 40.0 mL/min, air: 400.0 mL per minute, sampling rate: 80 msec (12.5 Hz)
GC — 2
Column: SUPELCOWAX 30 m × 0.25 mm i.d. × 0.25 mm f.t. (Supelco, Milan, Italy)
Temperature programme: 50 °C for 10 minutes to 280 °C at 3 °C per minute
Detector: MS, ion source: 200 °C, interface temp.: 220 °C, Interval scan: 40–400 m/z, scan speed: 5000 amu per second (12.5 Hz).
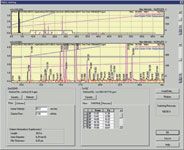
Figure 1
Quantification in Heart-cut MDGC
A calibration curve using standard samples with different concentrations can be acquired using the same conditions and transfer times to the second column.
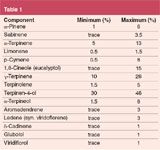
Table 1
Software for Heart-cut MDGC
All parameters of the system are controlled by the MDGCsolution software. With this software the user can load the monitor chromatogram from FID and graphically determine the cut times for the subsequent MDGC analysis (Figure 1).
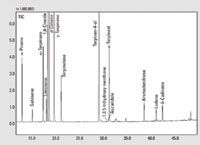
Figure 2
Results
In this application note the analysis of tea tree oil using Shimadzu's MDGC-2010 system is shown. Figure 2 shows that sharp peaks of each component in tea tree oil can be obtained using the MDGC-2010 system. In Table 1 the distribution of each component in the tea tree oil is given. Table 2 shows the results of the analysis of the tea tree oil sample in Figure 2. The quadrupole mass spectrometer used for detection in the second dimension ensures a secure identification and characterization of the tea tree oil sample.
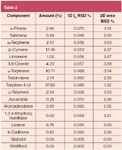
Table 2

Shimadzu Europa GmbH
Albert-Hahn-Str. 6–10, D-47269 Duisburg, Germany
tel. +49 203 7687 0 fax +49 203 766625
E-mail: mge@shimadzu.de
Website: www.shimadzu.eu

The Benefits of Custom Bonded Silica
April 1st 2025Not all chromatography resins are created equal. Off-the-shelf chromatography resins might not always meet the rigorous purification requirements of biopharmaceutical manufacturing. Custom bonded silica from Grace can address a wide range of separation challenges, leading to real performance improvements. Discover more about the latest innovations in chromatography silica from Grace, including VYDAC® and DAVISIL®.
5 Things to Consider When Selecting a Chromatography Silica
April 1st 2025Particularly in the pharmaceutical industry, drug purity isn’t just a goal – it’s essential for achieving safety, stability and efficacy. However, purification is easier said than done, especially with challenging molecules like DNA and RNA “oligonucleotides,” due in large part to their diversity and the range of impurities that can be generated during production. Enter DAVISIL® chromatographic silica, with a wide range of pore diameters and particle sizes to meet your specific application, performance and sustainability requirements. Before you choose the chromatography resin for your next purification application, take a look at these 5 considerations.
Automating Protein Purification: Efficiency, Yield, and Reproducibility
March 27th 2025Recent advancements in automated protein purification stress the importance of efficiency, scalability, and yield consistency. This eBook compares different purification platforms, highlighting their impact on downstream applications and demonstrating how automation enhances throughput and process control.
MilliporeSigma: Ultrapure Water for Sensitive LC-MS Analysis of Pesticides
March 25th 2025The aim of the study was to illustrate the efficiency of Milli-Q® water purification systems in eliminating pesticides from tap water, thereby producing and delivering reliable and consistent-quality ultrapure water suitable for pesticides analysis


