Practical GC: Selectivity Differences Resulting from Analytes Interacting with the Solvent and Stationary Phase
Different stationary phases, solvents, and compounds using different split ratios demonstrating impacts to selectivity as a function of analytes interacting with the solvent and the stationary phase are examined.
Solvent effects were described in detail by Konrad Grob in the early 1980s when he observed that solvents retained by the stationary phase influenced retention of early eluting analytes and could lead to peak distortion. The effects of stationary phase polarities with varying solvents examined in split mode and using significantly less solvent were not the main focus of Grob’s work. Split injection eliminates the injection port as a contributor to variation in retention times. This article examines different stationary phases, solvents, and compounds using different split ratios demonstrating impacts to selectivity as a function of analytes interacting with the solvent and the stationary phase.
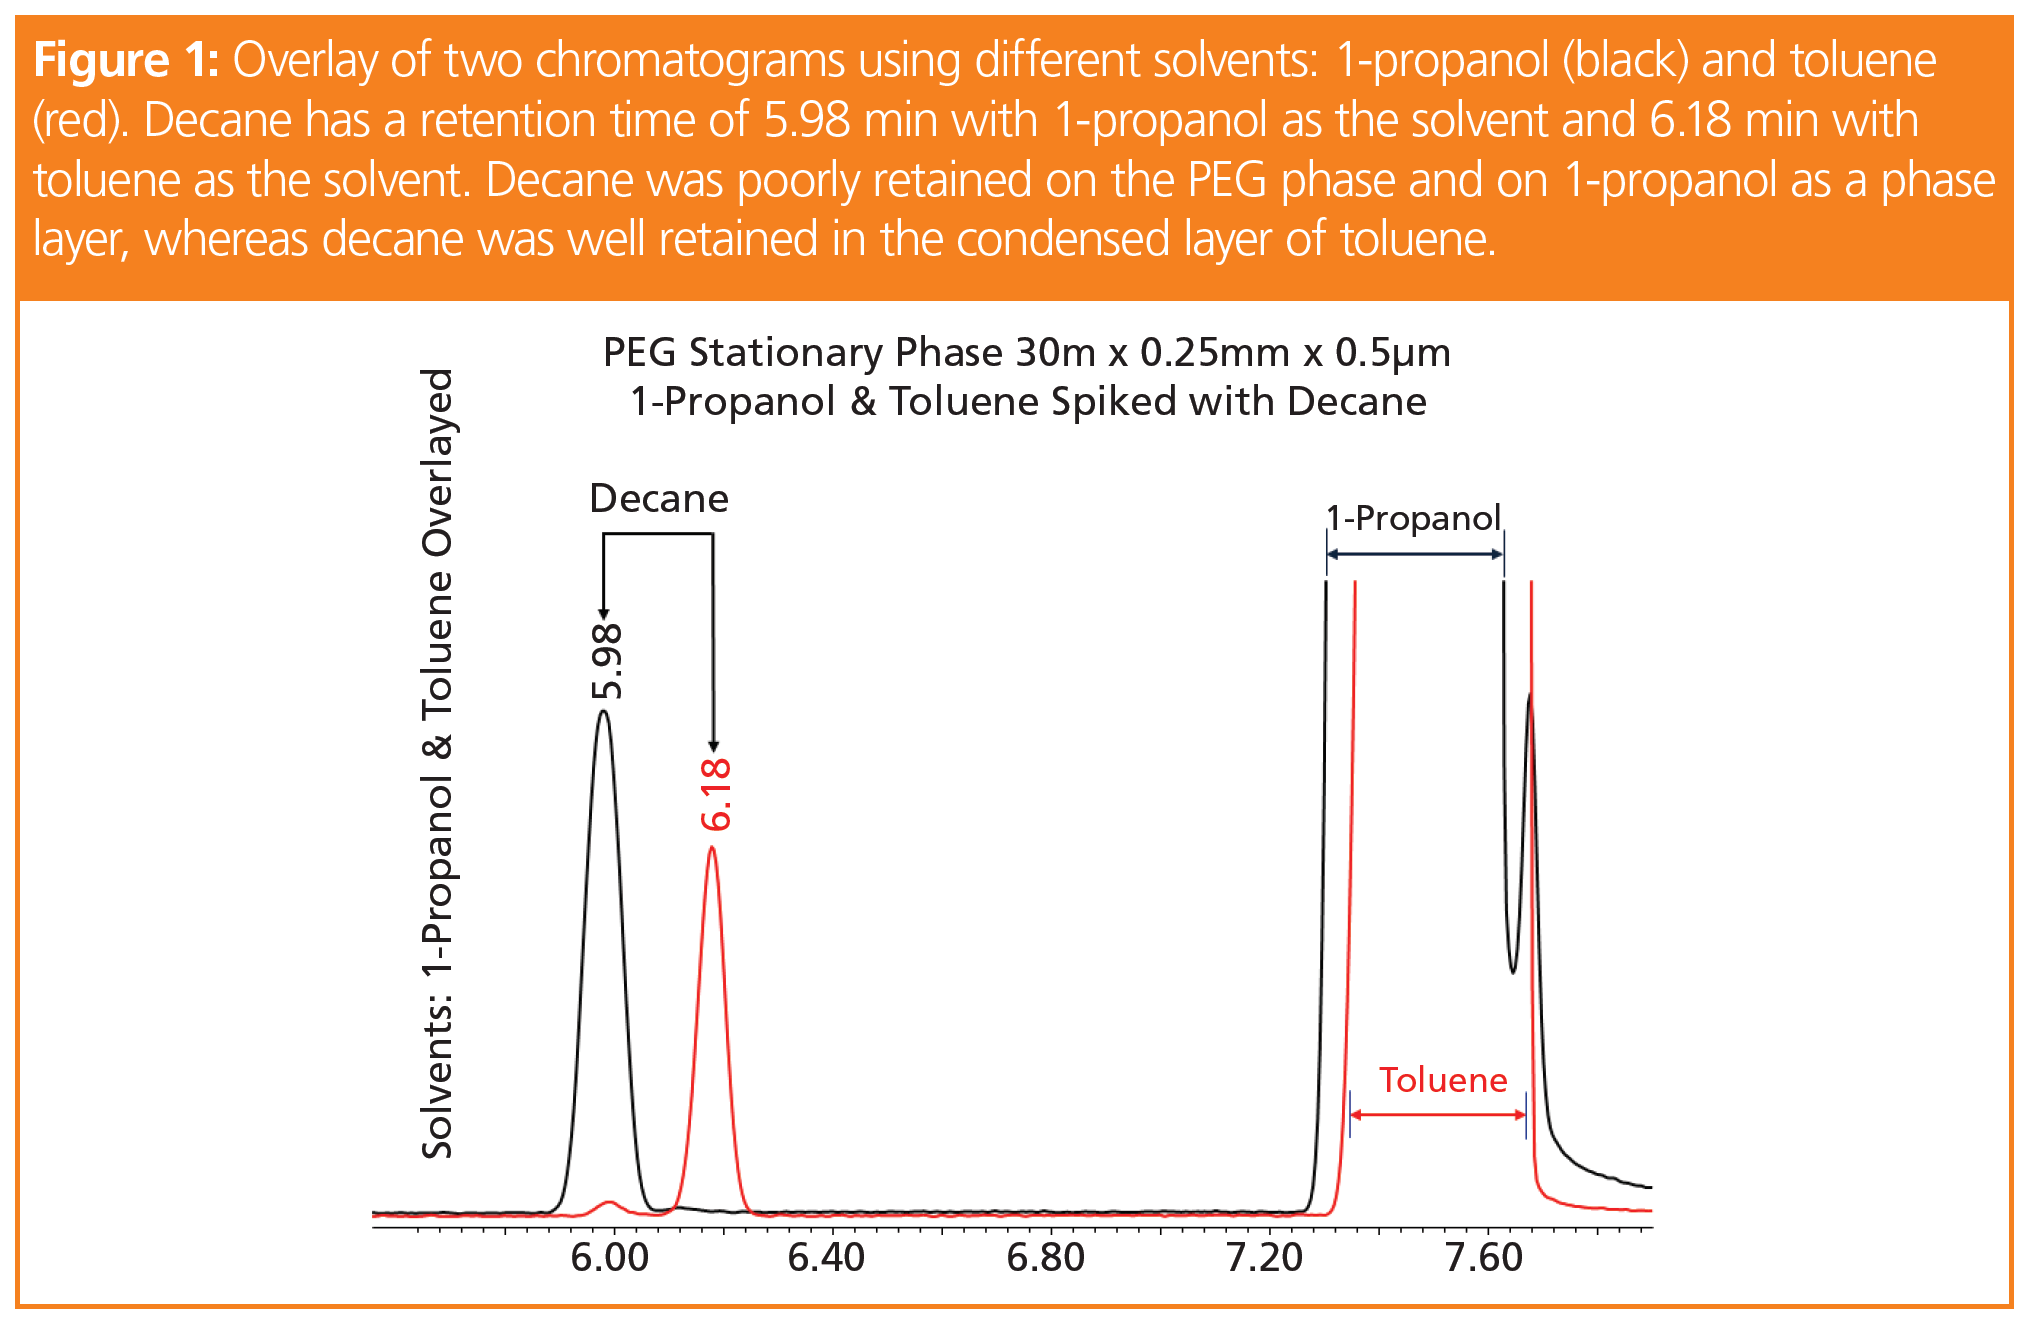
A colleague of mine, Corby Hilliard, was faced with a chromatographic anomaly while performing split analysis. Two different solvents—1-propanol and toluene—contained the same complex mixture of analytes, but one compound in particular shifted 0.2 min. An overlay of the two chromatograms revealed that decane exhibited a retention time of 5.98 min with 1-propanol as the solvent and 6.18 min with toluene as the solvent (1). Using Konrad Grob’s book on split and splitless injection, a reference was made to solvent soaking (2) and from there we had a hypothesis to test (Figure 1).
In capillary gas chromatography (GC) there are five common techniques for vaporizing a sample and transferring it onto the inlet of the analytical column: split, splitless, direct, PTV, and on-column injections. The most commonly used techniques are split and splitless, where the sample is vaporized using heat and transferred to the head of the column. In splitless injection, the split valve is closed long enough to allow most of the vaporized sample and solvent in the injection port liner to be transferred to the analytical column, which can take anywhere between 30 and 90 s. Since the split vent valve is closed, the sample transfer moves at the speed of the column flow, typically in the 1–2 mL/min range (3). Note that the volumetric flow rate into the inlet is lower as the carrier gas is compressed. In split mode, the split rate can be adjusted with a high degree of precision using modern equipment. Jack Cochran generated a 6-point calibration curve that covered a split range from 400:1 (1 ng on-column) to 10:1 (36.4 ng on-column) with a correlation coefficient of 0.99948 (4). A notable observation from this work highlighted a 3 s delay in elution of analytes when split ratios were set too low and amount of analyte on-column was too high. He found that by increasing the split ratio and adjusting the on-column concentration to 8 ng, using a 0.25 mm inner diameter (i.d.) × 0.25 µm film thickness, produced good peak shapes and stable retention times. Increasing the film thickness would also accommodate more analyte and solvent on-column.
There are two different approaches for refocusing vaporized sample from the inlet to the head of the column: solvent focusing and analyte focusing. The difference between these two techniques is the initial temperature of the column oven. Analyte focusing begins with an oven temperature that allows the solvent to move through the column as a vapour at the time of injection and requires a large difference in boiling point between the solvent and higher molecular weight analytes. Solvent focusing requires an oven temperature 20 °C below the boiling point of the sample solvent and allows the solvent and analyte to focus and wet the stationary phase. This can result in a solvent effect as described by Konrad Grob, where the condensed solvent acts as a temporary stationary phase contributing to changes in retention based on the polarity of the solvent, analyte, and column (1). In this work, six different compounds were made up in five different solvents analyzed on three different stationary phases, examining high and low split ratios to precisely control the amount of solvent on the column. The compounds and solvents represent a range of polarities, vapour pressures, and boiling points.
Experimental Design
Three columns were chosen with orthogonal selectivity addressing a wide polarity range: 100% polydimethylsiloxane (PDMS), “1‑type phase”; polyethylene glycol (PEG), “wax phase”; and a 20% diphenyl–80% polydimethylsiloxane phase, “20-type phase”. Columns dimensions were the same for the phases evaluated (30 m × 0.25 mm, 0.5-μm df columns [Restek]). Compounds chosen were nonpolar (hexane, benzene, toluene), intermediately polar (chloroform, methyl tert butyl ether), and polar (ethanol). The solvents used were methanol, 2-propanol, acetonitrile, 1-propanol, and 2-ethoxyethanol. The starting temperature for this study was 40 °C, assuring that the solvent was fully retained at the head of the column so we could measure its impact. Standards were made up at 5000 parts‑per‑million, therefore a 200:1 split resulted in 25 ng on-column concentration and a 25:1 split in a 200 ng on‑column compound concentration. Instrument conditions were as follows: column flow: 1.1 mL/min, 8.55 psi, 37.88 cm/s; oven: 40 °C (hold 12 min) 30 °C/min to 225 °C (hold 5) [23 min]; MS scan: 35 to 300 AMU.
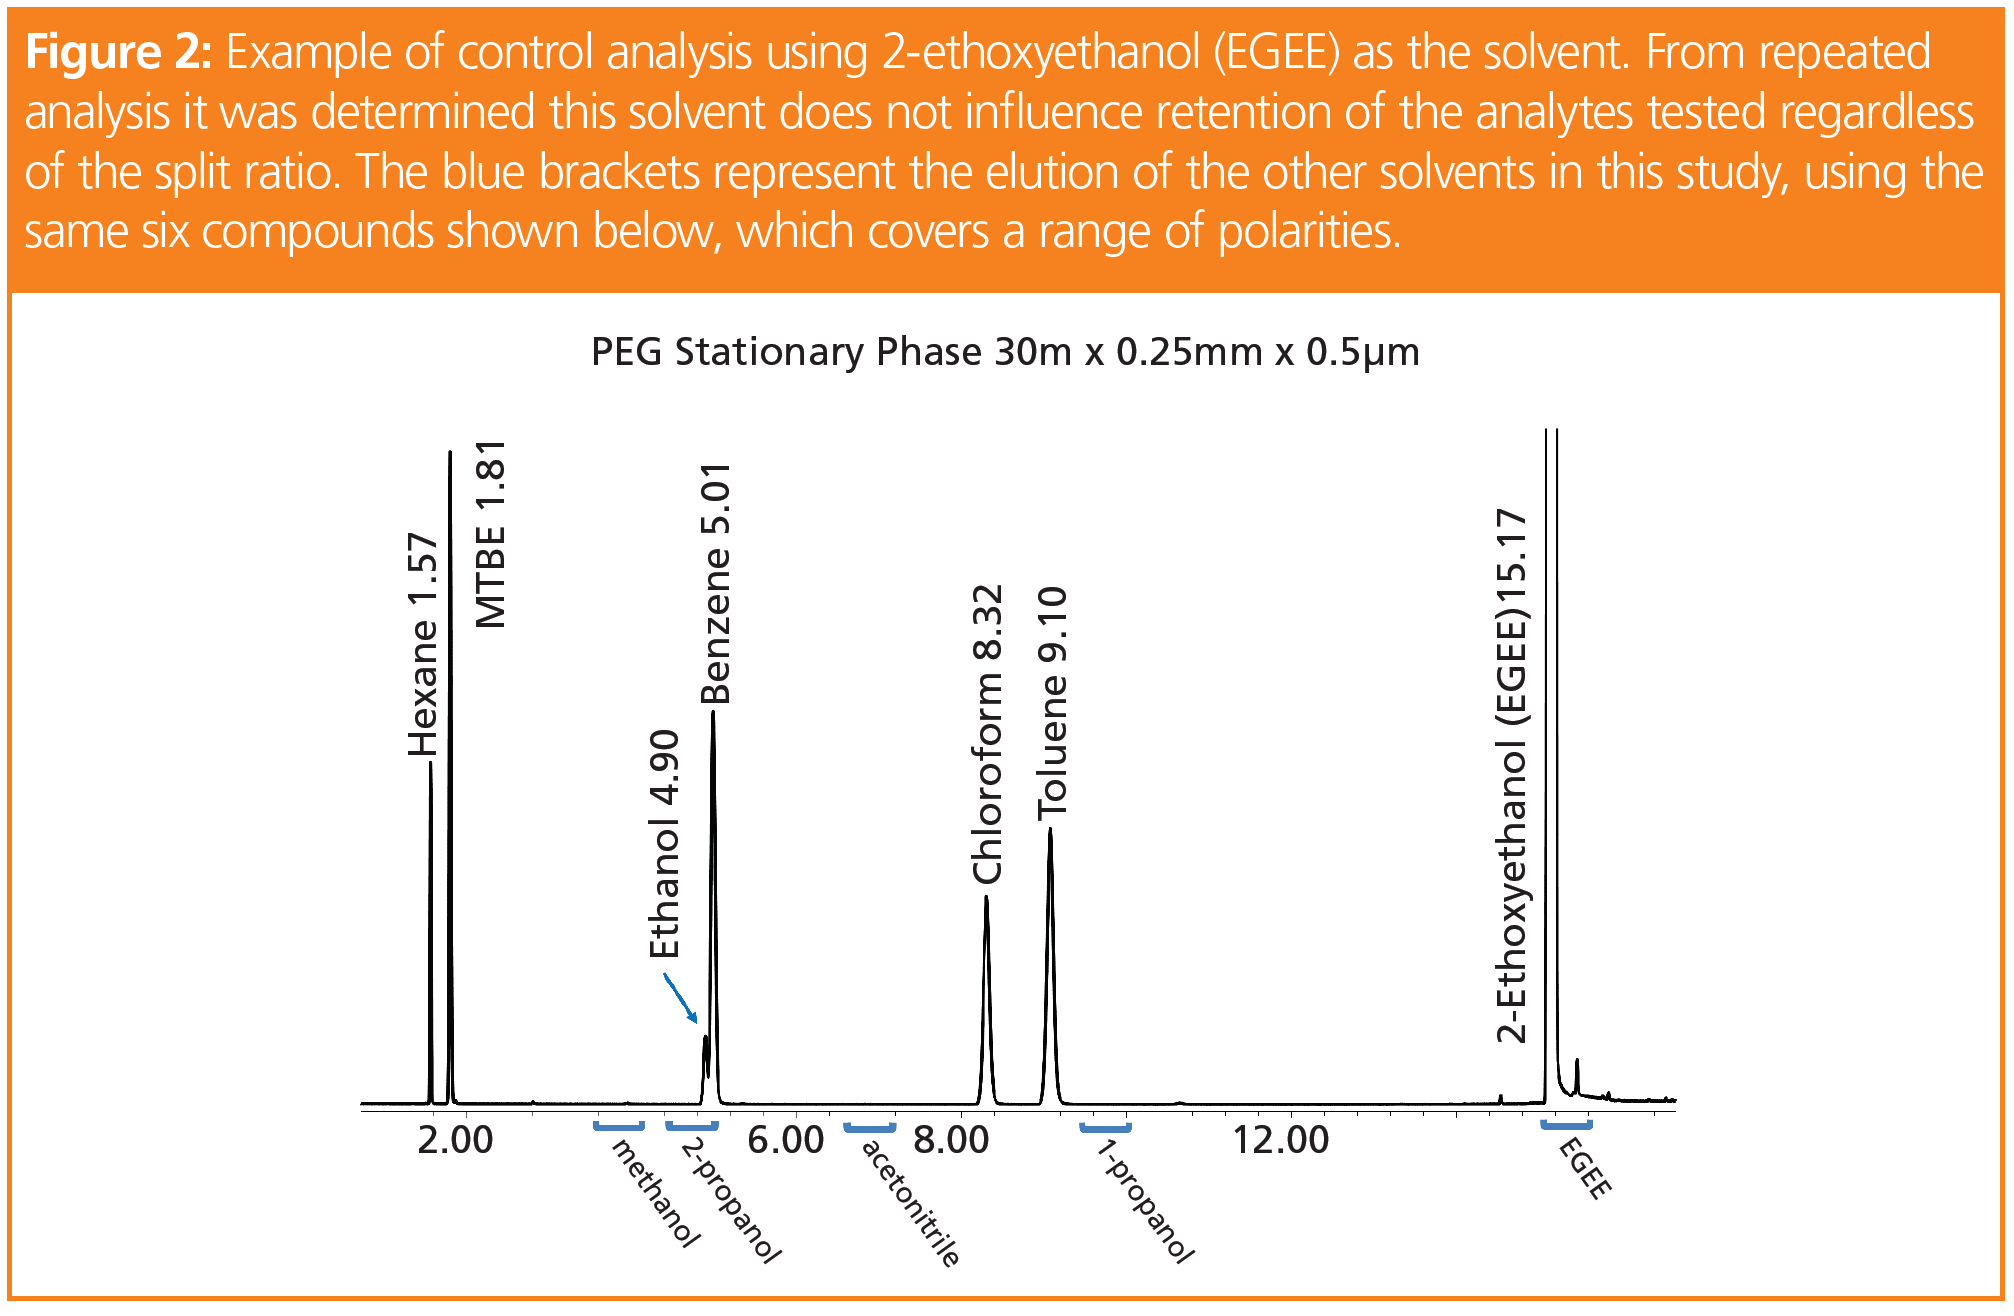
Analyses for this study were performed in triplicate using a 1 µL fast autosampler injection. Based on earlier studies, it was determined that 2-ethoxyethanol does not influence retention of the analytes tested regardless of the split ratios or stationary phases. For this reason, the six compounds were spiked into this glycol ether and used as a retention check standard before and after sample sets to verify consistent retention times. Surprisingly, the majority of triplicate runs were within 0.01 min (Figure 2). This work was originally performed in our laboratory to evaluate impacts on selectivity, however, no differences were observed.
Results and Discussion
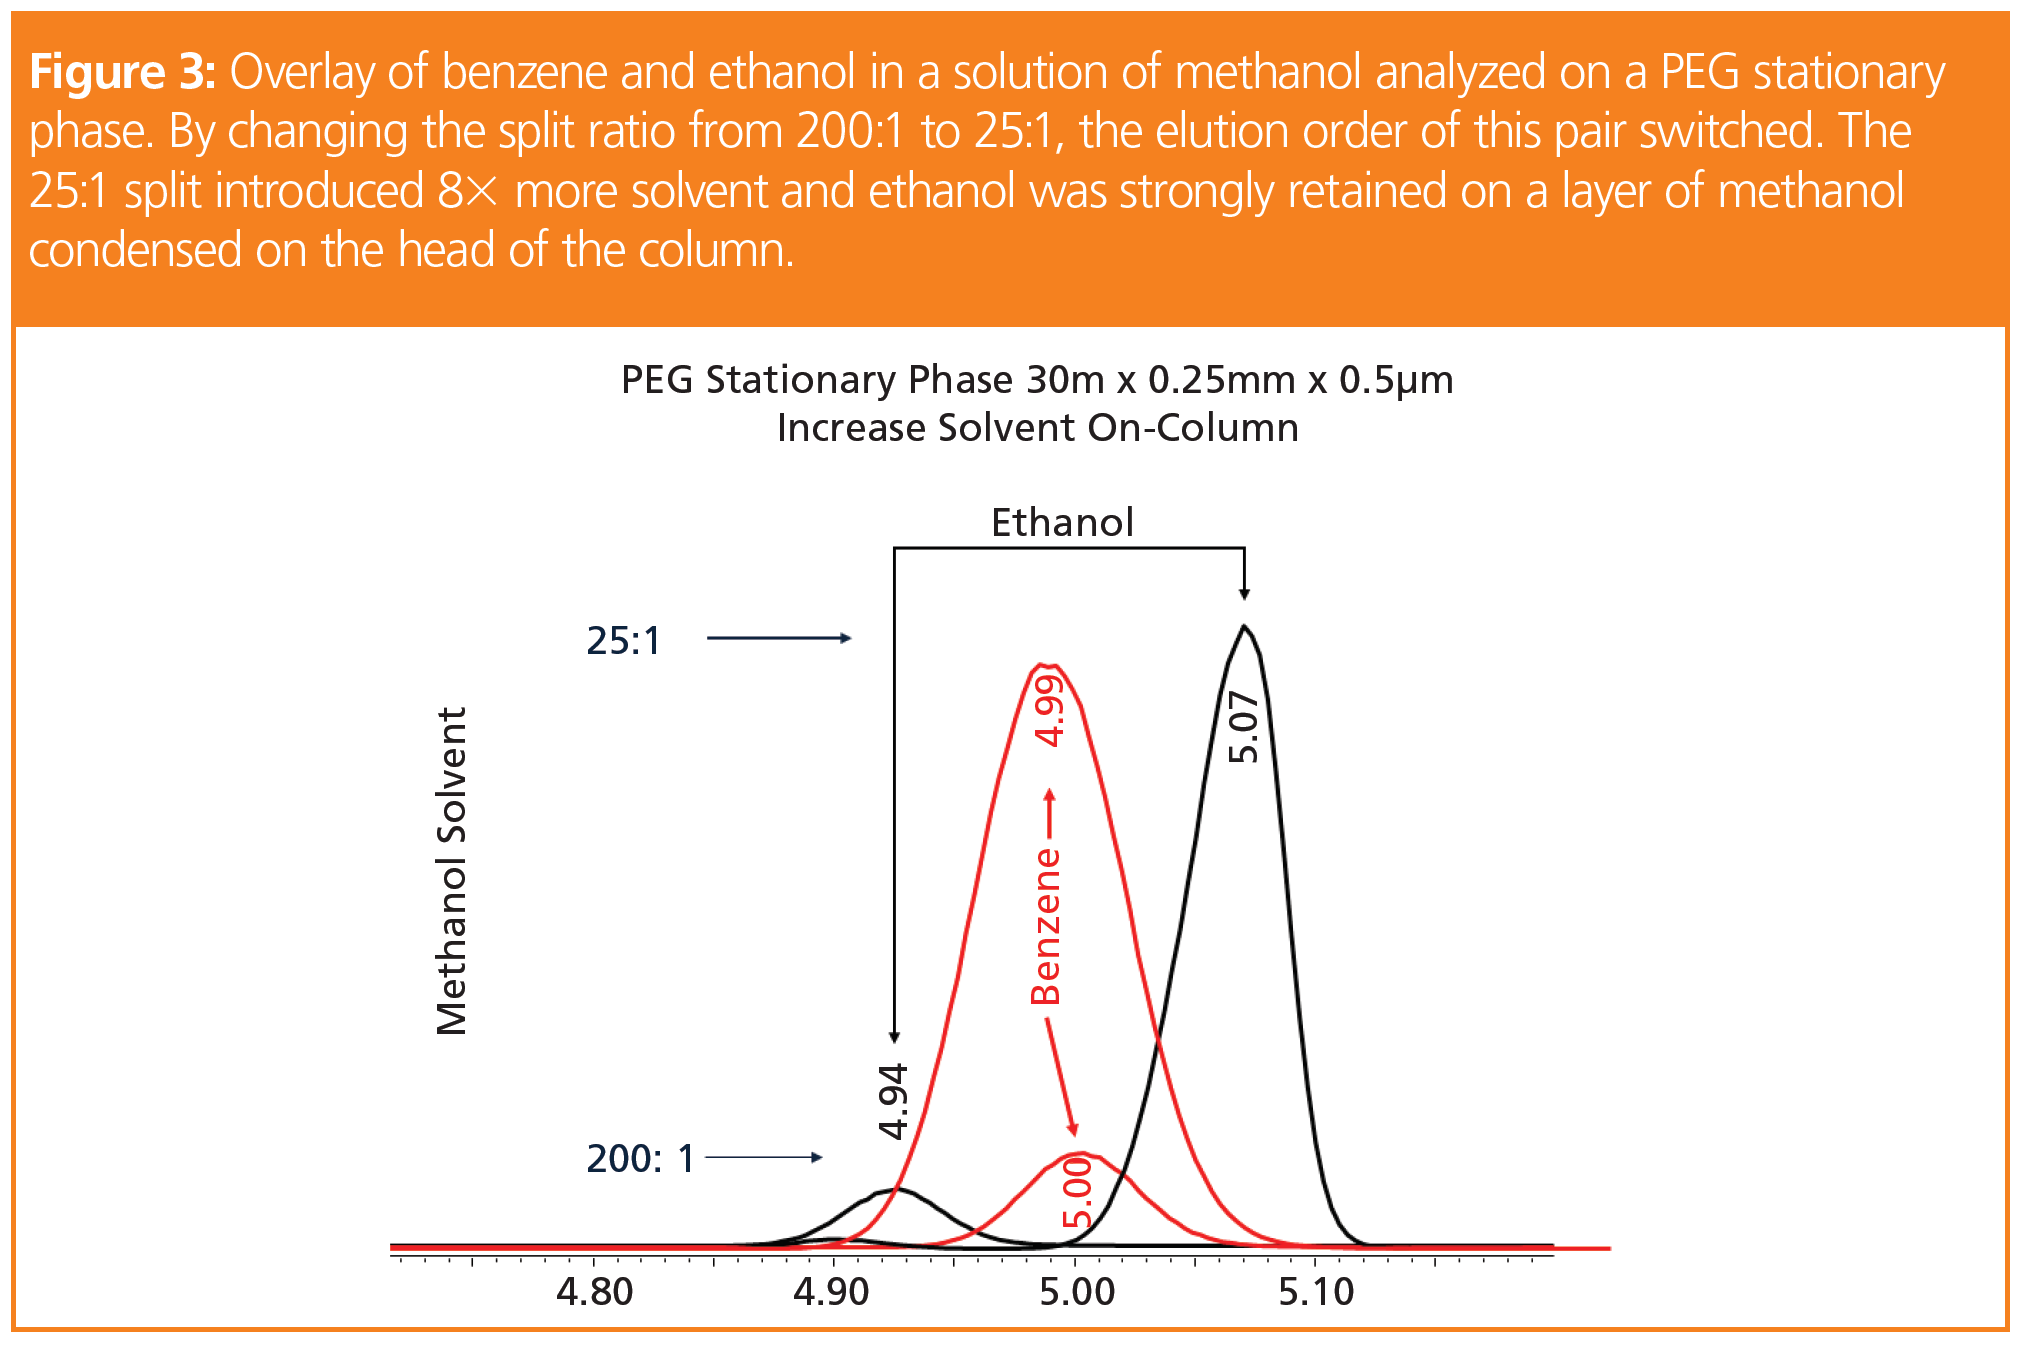
From our work with hand sanitizers, we found problems with peak distortion of acetaldehyde in the presence of percent levels of methanol and ethanol using a cyanopropyl-type stationary phase. A similar approach was taken with this work in that we used methanol as the solvent and examined the performance of ethanol relative to a nonpolar compound, in this case benzene. Using a PEG stationary phase and injecting a methanol standard with a 200:1 split ratio, our retention times matched those found in Figure 2. However, when the split ratio was adjusted to 25:1, which introduced eight times more solvent, ethanol was retained on a layer of condensed methanol at the head of the column. Ethanol eluted just before benzene with a 200:1 split and eluted after benzene using a 25:1 split (Figure 3).
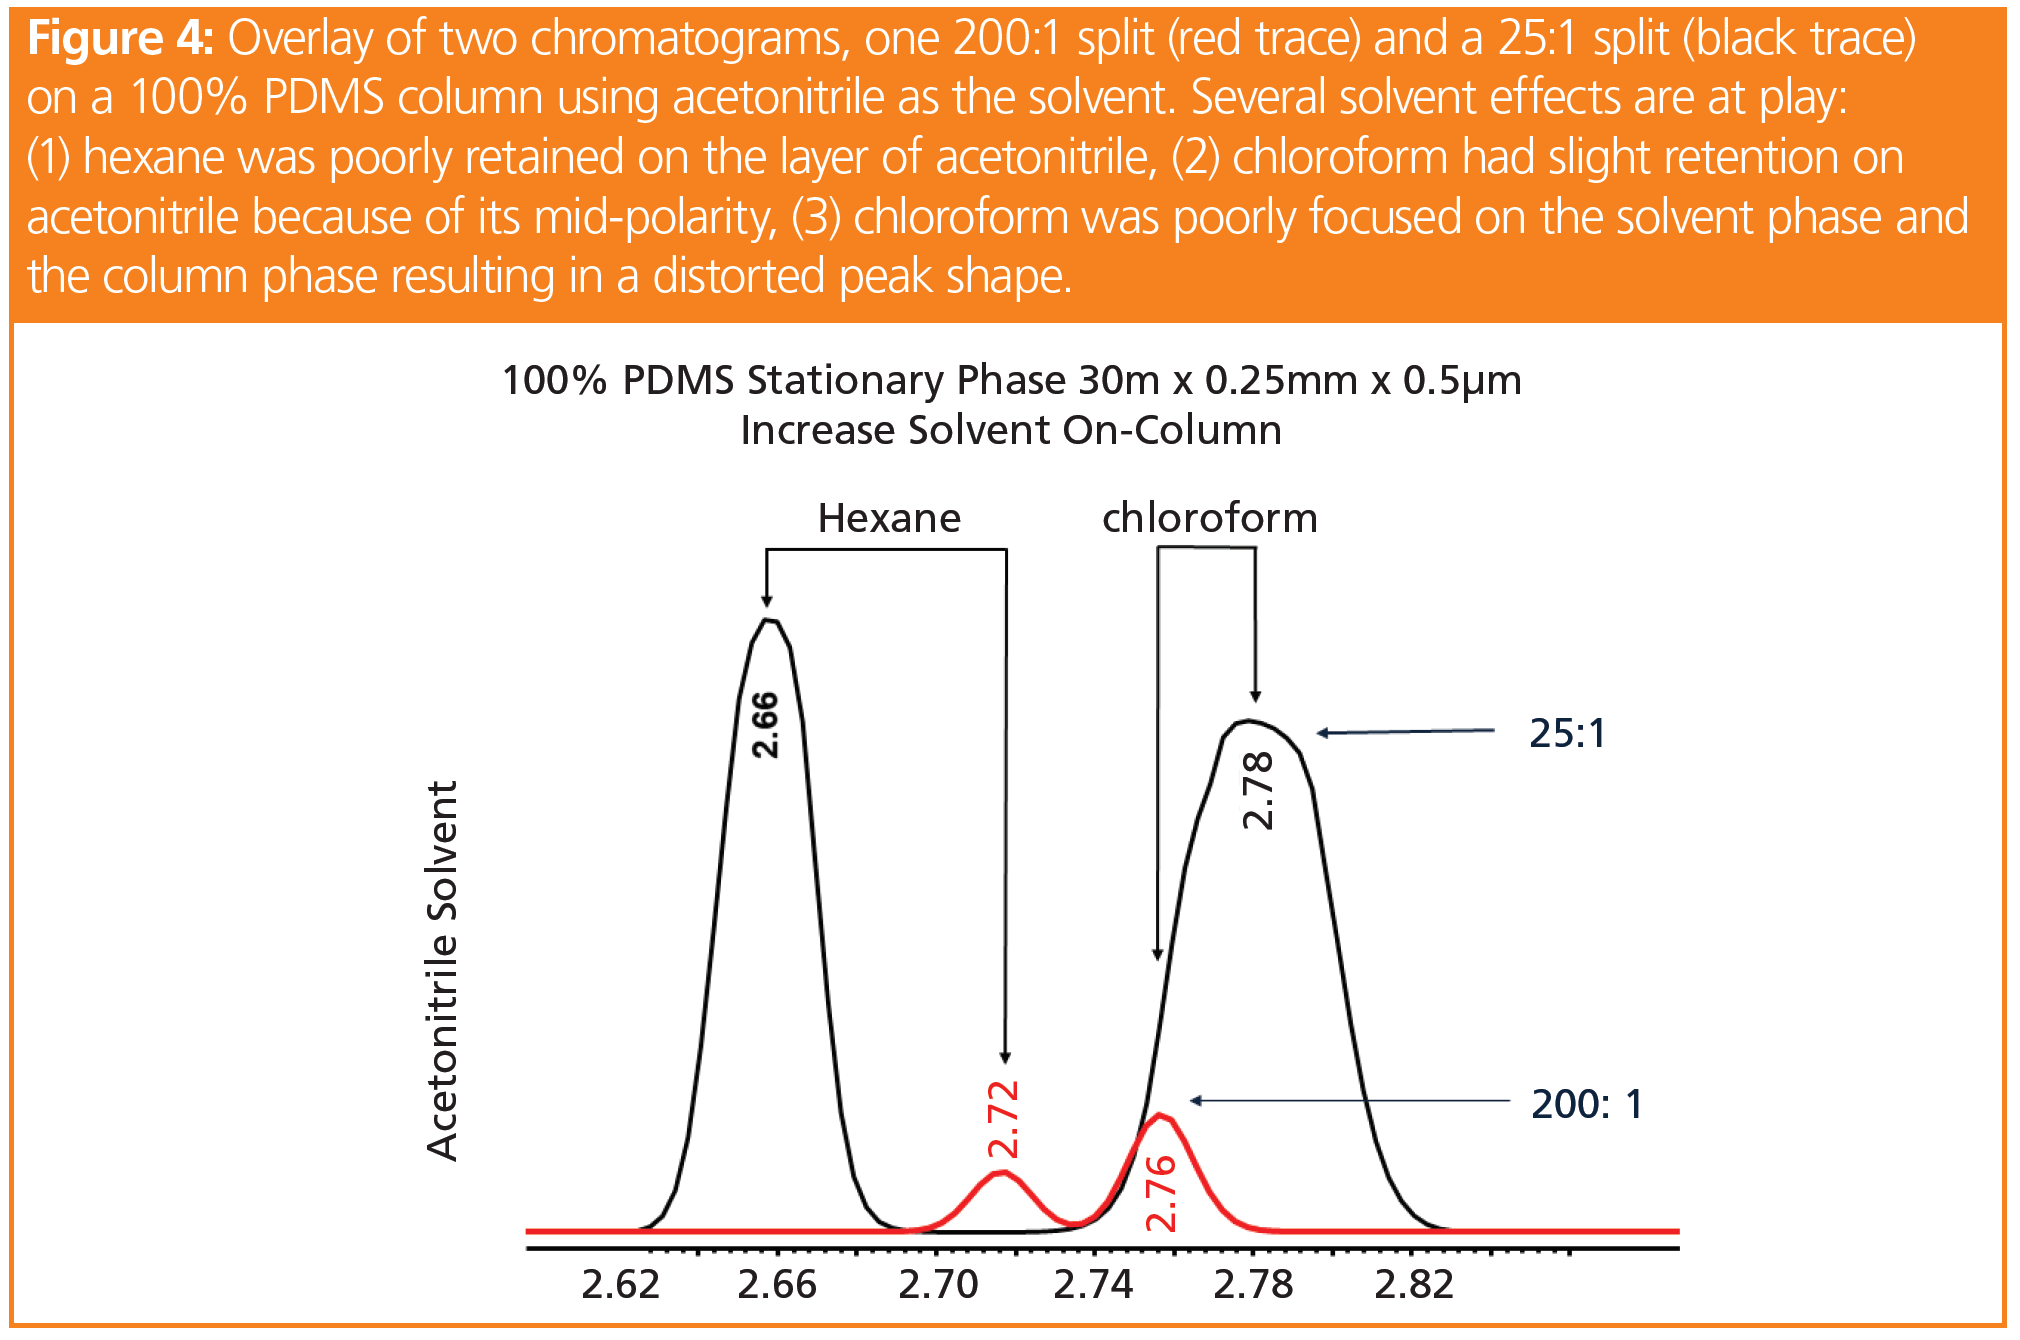
The results found in Figure 3 were not completely surprising because we are dealing with two highly polar alcohols; however, when analyzing a mid-polarity compound, such as chloroform, predicting the outcome is more complex. Konrad Grob wrote a paper specifically about solvent effects and chloroform and for this reason we added this compound into our test set. The paper describes chloroform as being “partially trapped”, which results in peak distortion (5). Using a 100% PDMS column and acetonitrile as the solvent, hexane and chloroform retention times were within 0.04 min using a 200:1 split. Using a 25:1 split, hexane was less retained and chloroform was slightly more retained and, as predicted by Grob, the peak shape was broad and distorted, indicating the analyte was “partially trapped” by acetonitrile (Figure 4).
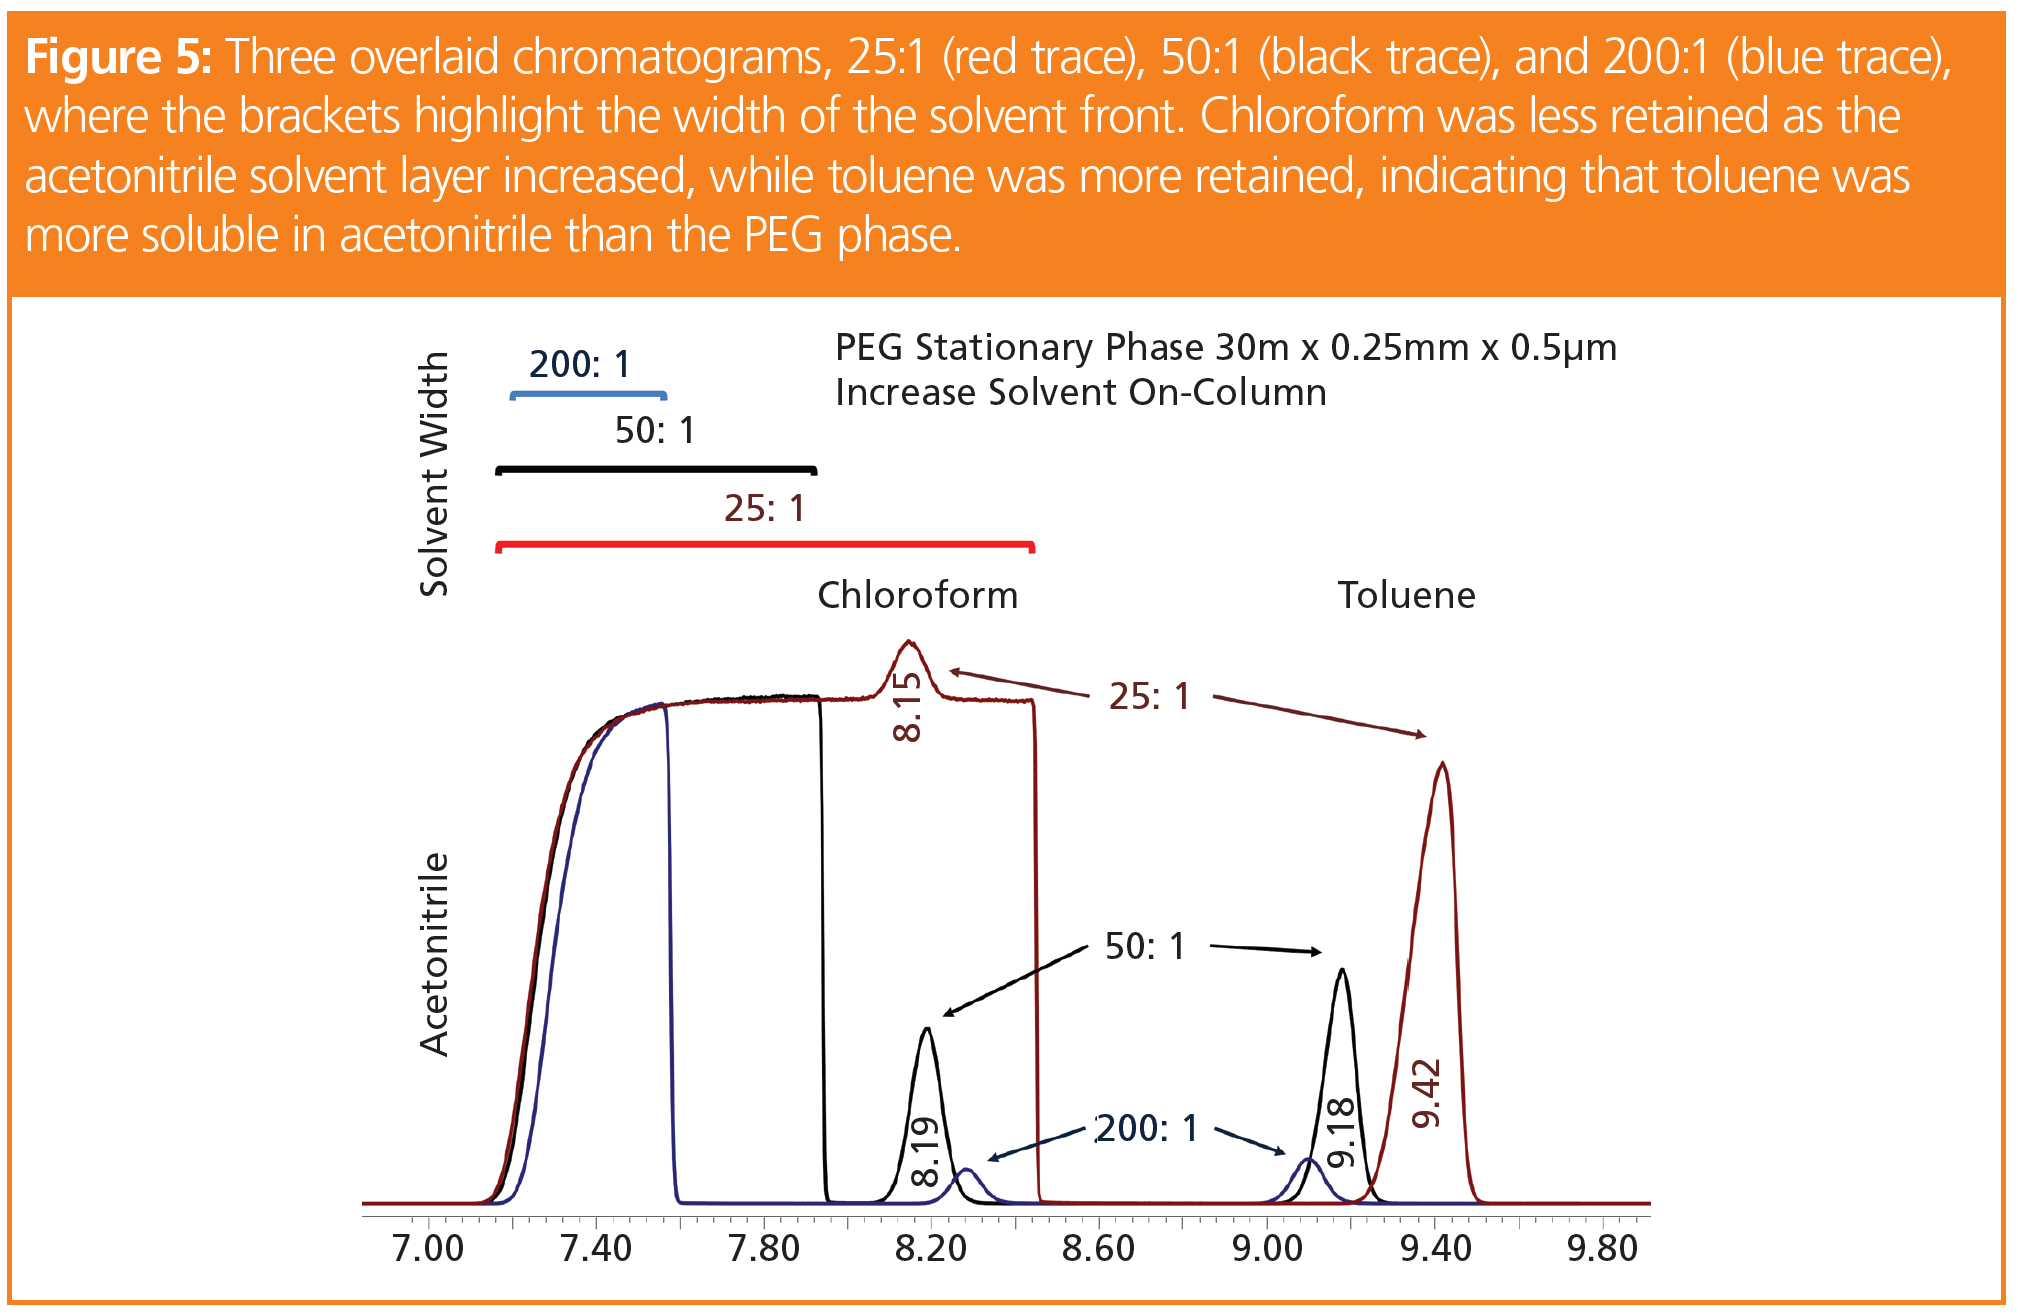
For our final notable result, we examined three different split ratios: 200:1, 50:1, and 25:1. We found an example where there was retention at and in the solvent front, which, in this case, was acetonitrile. The column used was a PEG and the two compounds examined were chloroform and toluene. At 200:1, chloroform eluted at 8.28 min and toluene was 9.10 min, which again matched our control runs and is a clear indication of no solvent effects. At a 25:1 split, chloroform was in the solvent with a retention time of 8.15 min and toluene was more retained at 9.42 min. As the solvent increased, chloroform was less retained in the solvent than it would be in the PEG phase. Toluene was more soluble in an acetonitrile layer than in the column phase (Figure 5).
Conclusions
The four primary examples have demonstrated different solvent effects similar to that described by Konrad Grob four decades ago. Interestingly, even 0.04 μL of solvent retained in the column acts as a temporary stationary phase, influencing retention based on the polarity of the stationary phase, solvent, and analytes. In some cases, predictions can be made about the change in retention characteristics specific to solvent effects. For mid-polarity compounds, predictions are far more challenging.
Acknowledgement
Special thanks to Jaap de Zeeuw (Restek, Middelburg, The Netherlands) for his technical advice and review.
Chris English has managed a team of chemists in Restek’s innovations laboratory since 2004. Before taking the reins of the laboratory, he spent seven years as an environmental chemist and was critical to the development of Restek’s current line of volatile GC columns. Prior to joining Restek, he operated a variety of gas chromatographic detectors conducting method development and sample analysis. Chris holds a B.S. in environmental science from Saint Michael’s College, USA.
E-mail: chris.english@restek.com
Website: www.restek.com

Study Examines Impact of Zwitterionic Liquid Structures on Volatile Carboxylic Acid Separation in GC
March 28th 2025Iowa State University researchers evaluated imidazolium-based ZILs with sulfonate and triflimide anions to understand the influence of ZILs’ chemical structures on polar analyte separation.
Quantifying Microplastics in Meconium Samples Using Pyrolysis–GC-MS
March 26th 2025Using pyrolysis-gas chromatography and mass spectrometry, scientists from Fudan University and the Putuo District Center for Disease Control and Prevention detected and quantified microplastics in newborn stool samples.


