The Power of Liquid Chromatography–Mass Spectrometry in the Characterization of Protein Biopharmaceuticals
Special Issues
This article highlights some selected examples of the power of liquid chromatography combined with mass spectrometry (LC–MS) in the development of protein biopharmaceuticals.
Protein biopharmaceuticals, such as monoclonal antibodies and recombinant proteins, are currently widely used to treat various life-threatening conditions including cancer, anaemia, diabetes and autoimmune diseases. Protein therapeutics are far more complex than small molecule drugs and unravelling this complexity obviously represents an analytical challenge. This article highlights some selected examples of the power of liquid chromatography combined with mass spectrometry(LC–MS) in the development of protein biopharmaceuticals.
More than 30 years after the commercial introduction of the first recombinant protein to treat diabetes, namely human insulin, hundreds of protein biopharmaceuticals have been approved by the regulatory agencies and several have blockbuster status (1). Today the global protein therapeutics market is worth 100 billion dollars (which represents approximately 20% of the total pharmaceutical market) and it is expected that, within the current decade, more than 50% of the new drug approvals will be biologics (2). Monoclonal antibodies are expected to play a dominant role (3).
During the development and lifetime of these molecules, an in-depth characterization is required. Compared with small molecule drugs, protein biopharmaceuticals are large and heterogeneous (as a result of the biosynthetic process and subsequent manufacturing and storage), making their analysis very challenging. Liquid chromatography (LC) combined with mass spectrometry (MS) has become the principal enabling technology to characterize these macromolecules (4–7).
Using a monoclonal antibody (mAb) as an example, we will illustrate how characteristics such as amino acid sequence; molecular weight and structural integrity; N-glycosylation; N- and C-terminal processing; S-S bridges; deamidation (asparagine and glutamine); aspartate isomerization; and oxidation (methionine and tryptophan) can be extracted out of the LC–MS dataset. A detailed structural insight requires an assessment at protein, peptide and sugar levels.
Characteristics Revealed at Protein Level
It has been 25 years since the 2002 Nobel Laureate, John Fenn, described an elegant way to present proteins to the mass spectrometer (8). The principle known as electrospray ionization (ESI) revolutionized the analysis of proteins. In combination with high-resolution mass spectrometers such as time-of-flight (TOF), orbitrap and fourier transform ion cyclotron resonance (FTICR), great structural detail can be obtained (4–6).
The process of ESI generates multiply charged ions from proteins resulting in a characteristic charged envelope that can be converted readily to the molecular mass by applying a maximum entropy algorithm. Typically, the average molecular mass can be determined, however, in cases where the mass analyser offers sufficient resolution, proteins can be resolved at isotope level allowing the monoisotopic mass to be determined. The resolution offered by TOF mass analysers allows isotope resolution of smaller proteins (up to approximately 20 kDa) while that offered by FTICR mass analysers allows isotope resolution of larger proteins. The phenomenon of multiply charging under ESI conditions allows even the largest proteins to fall within the mass range of the common mass analysers (charged envelopes typically range from m/z 500–3500), thereby making ESI an attractive option to measure a wide range of proteins. This is illustrated in Figure 1 where the deconvoluted spectra of an intact monoclonal antibody, its heavy and light chain (Hc and Lc) generated following interchain disulphide bond reduction using dithiothreitol (DTT) and the crystallizable fragment (Fc) generated following papain cleavage is shown.
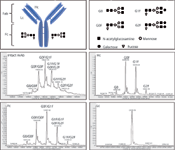
Figure 1: Representation of a mAb and deconvoluted spectra of the intact mAb, Hc, Lc and Fc fragments acquired on a quadrupoleâtime-of-flight mass spectrometer (QâTOF-MS) system. A functional mAb is composed of two heavy and two light chains connected through interchain disulphide bridges. Several intrachain disulphide bridges occur within the Hc (four) and Lc (two). The Hc contains a consensus sequence for N-glycosylation. An intact mAb subsequently has two N-glycosylation sites. The main N-glycans observed on the mAb are schematically presented. Note that the G1F glycan can exist as two different isomers. These cannot be differentiated in the displayed data. The Lc measurement also highlights a chemical glycation given the observed mass increase of 162 Da compared to the native Lc (23439 vs. 23601).
Data were acquired by introducing the samples into a hybrid quadrupole timeofflight mass spectrometer (Q–TOFMS) via a reversed-phase (RP) on-line desalting cartridge. This measurement provides an initial confirmation of the gene-derived protein sequence and reveals the structural integrity and the post-translational modifications. The measured average MW values obtained at all levels (intact, Hc, Lc and Fc) are well below 0.005% of the theoretical MW values, which is expected when using high-resolution and accurate mass instrumentation. The intact mAb, Hc and Fc measurements demonstrate the existence of several glycoforms with characteristic 146 Da and 162 Da spacings which is indicative of fucose and galactose and consequently N-glycosylation, a critical quality attribute. The detection of N-glycosylation is not surprising given the presence of one consensus sequence for N-glycosylation on the heavy chain (Asn-Xxx-Ser/Thr where Xxx can be any amino acid except Pro). Four main glycoforms are revealed at the Hc level containing the typical mammalian complex type N-glycans termed G0, G0F, G1F and G2F. The intensity of the peaks is indicative of the occurrence of the different glycoforms. A fully functional mAb is composed of two heavy chains linked via disulphide bridges, hence, the measurement of the intact mAb and the Fc allows the simultaneous interrogation of the two N-glycosylation sites, thereby providing further structural detail.

Figure 2: Reversed-phase liquid chromatographyâultravioletâmass spectrometry (RPLCâUVâMS) analysis of the mAb Lc highlighting two peaks with a 1 Da mass difference indicative for deamidation. The left trace shows the UV = 214 nm chromatogram, the right traces show the deconvoluted spectra of the main and post peak. Separation was performed on a sub-2-µm C4 column (15-cm length, 2.1-mm internal diameter) operated at 60 °C using 0.1% trifluoroacetic acid (TFA), acetonitrile and water as mobile phase constituents. The elevated temperature substantially improves peak shape and recovery (7). Note the presence of an additional impurity at 12.4 min which displays a 2 Da mass increase over the main peak. This indicates the reduction of one intra-chain disulphide bond.
These measurements lack any chromatographic separation apart for on-line RP desalting. As shown in Figure 2, separating the mAb Lc on an RPLC column prior to Q–TOF-MS measurement allows variants with subtle mass differences to be highlighted. Indeed, a post peak with a mass difference of only 1 Da, indicative of a deamidation event, is highlighted. In the absence of any chromatographic separation, the deamidated peak is masked by the more intense native peak, illustrating the perfect marriage between chromatography and mass spectrometry. The theoretical MW values, that is, 23439.26 and 23440.24, for the native Lc and deamidated Lc, respectively, correspond well to the measured values shown in Figure 2.
RPLC is perfectly compatible with ESI–MS given the volatility of the mobile phases. It has to be stressed, however, that the best chromatographic conditions are not necessarily the best mass spectrometric conditions. Indeed, trifluoroacetic acid (TFA) is an ideal ion-pairing reagent and gives rise to superb chromatography, however, it simultaneously acts as a suppressor of the ESI process resulting in a reduced signal intensity. The reverse is true for formic acid (FA). Ion exchange (IEX) and size exclusion chromatography (SEC), two other common chromatographic modes for the separation of proteins, are not directly compatible with MS because of the presence of non-volatile salts in the mobile phases. The mass spectrometric measurement of IEX and SEC peaks requires their collection in fractions and subsequent on-line desalting prior to MS measurement.
Characteristics Revealed at Peptide Level
As demonstrated, protein measurement is extremely powerful but does not provide the complete picture. While it is indicative for identity and highlights dominant modifications, it does not provide the actual amino acid sequence nor does it allow the modifications to be localized. The LC–MS measurement presented in Figure 2 reveals a deamidation on the Lc but it cannot be traced back to a specific asparagine or glutamine residue. The Lc of the measured mAb contains six asparagine and 15 glutamine residues which are all prone to this chemical modification. These characteristics can further be assessed at peptide level following proteolytic digestion with, for example, trypsin which cleaves peptides C-terminally of an arginine or lysine residue. Peptide mapping can either be performed under non-reducing conditions in case disulphide bridges have to be confirmed or following the execution of a reduction and alkylation step.
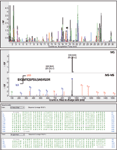
Figure 3: Liquid chromatographyâmass spectrometry (LCâMS)-based peptide mapping performed on the reduced, alkylated and trypsinized mAb. In the presented case, a sub-2 µm C18 column (15-cm length à 2.1-mm internal diameter) operated at 60 °C, using mobile phases containing water, acetonitrile and 0.1% TFA, was used. The upper trace shows the reversed-phase LCâMS chromatogram with the unique peaks coloured. The middle traces show the MS and MSâMS spectra of the peak labelled with an asterisk. This peptide is predominantly doubly charged and based on its monoisotopic mass, it is assigned to peptide DIQMTQSPSSLSASVGDR at a mass accuracy below 5 ppm. This particular peptide finds its origin in the Lc (N-terminal peptide). MSâMS data further confirms the sequence (processed spectrum is shown â intensity filtered and de-isotoped). Annotated y- and b-ions are coloured in red and blue, respectively. An immonium ion is coloured in green. Upon matching the monoisotopic mass and MSâMS data of all the extracted and coloured peaks in the peptide map, over 98% sequence coverage is obtained. Part of the sequence covered is displayed in green, undetected peptides in grey. Note that MSâMS data was acquired in an automated, data-dependent manner.
Figure 3 shows the RPLC–MS-based peptide map obtained following reduction, alkylation and trypsin digestion of the mAb using a Q–TOFMS. When considering fully cleaved tryptic peptides, 62 peptides are theoretically expected in the peptide map. The true peptide mixture complexity is much higher because of the presence of modified peptides and sample preparation artifacts, such as miscleaved and aspecifically cleaved peptides and trypsin autolysis fragments. As is the case with proteins, peptides are typically multiply charged under ESI conditions; to a much lesser extent given their smaller size. Using high-resolution mass spectrometers, full isotope resolution is obtained, thereby allowing the determination of the monoisotopic mass typically at mass accuracies below 5 ppm which is highly specific towards identification. Implementing tandem MS systems allows fragmentation data on the peptides to be obtained, typically using collision induced dissociation (CID), further increasing confidence about peptide identity, sequence, modifications and modification sites. Peptides fragment in a predicable manner under CID conditions (along the peptide bond) giving rise to so-called y- and b-ions, respectively, containing the C- and N-terminus of the peptide. The mass difference between successive y- or b-ions corresponds to the residual mass of the amino acids. It is important to note that intact proteins are typically not subjected to fragmentation.
The question evidently arises as to how all the generated signals in an LC–MS(–MS) peptide map are efficiently linked to the protein under investigation? This is not typically done by manual interpretation of the data. It starts with an algorithm that extracts the unique peaks out of the LC–MS dataset (see coloured peaks in Figure 3). The algorithm localizes and combines all related co-varying ions (including isotopes, adducts and charge variants) with the generation of a single monoisotopic mass, retention time and an abundance for each peak. The peptide map is thereby converted to a peak list. In a parallel in-silico workflow, the geneencoded protein sequence is theoretically digested with the enzyme used, that is, trypsin, and the calculated monoisotopic masses of the in-silico peptides are matched on the experimental peak list at a userdefined mass accuracy (for example, 5 ppm). The in-silico workflow can be fed with all types of modifications whose masses are added or substracted from the in-silico peptides. In cases where MS–MS data have been acquired, it is added to the peak list, further increasing confidence in the identification. Given the predictable fragmentation of peptides, theoretically expected fragmentation of in-silico peptides can be matched against the acquired spectra.
When applying this strategy onto the mAb under investigation, over 98% of the sequence is covered, thereby confirming the amino acid sequence and identity (Figure 3). Peptides that are not detected are typically small and their signal might be suppressed in the column flow through. In addition to confirming the sequence, the peptide map also reveals modifications and modification sites. As an example, the deamidation observed in the Lc can be traced back to a specific peptide based on accurate mass data and to a specific amino acid when incorporating the MS–MS data. This is demonstrated in Figure 4. Some very informative b- and y-ions allow the asparagine to be identified as the deamidation site. Comparing the peak areas of the native and deamidated peptides, allows deamidation to be quantified at around 7%.
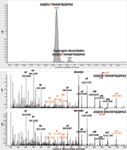
Figure 4: Deamidated and native peptide extracted out of the peptide map data with their corresponding MSâMS spectra. Based on accurate mass data, the deamidation in the Lc could be traced back to tryptic peptide ASQDVNTAVAWYQQKPGK which contains four potential deamidation sites (three Gln and one Asn). MSâMS data reveals the actual deamidation site (asparagine).
Additional examples of modifications highlighted in the presented case are cyclization of the N-terminal Glu on the Hc with the formation of pyroGlu (3%), Lys truncation at the C-terminus of the Hc (99%) and N-glycans at the peptide containing the consensus sequence for N-glycosylation. It is simultaneously demonstrated that the N-glycosylation site is occupied for 98%. Indeed, a small amount of the non-glycosylated peptide containing the consensus sequence for glycosylation is detected. It is important to mention that the MS–MS spectra of the glycopeptides contain informative sugar fragments, alongside peptide and sugar/peptide fragments, but a detailed insight in the glycans themselves is not obtained from the peptide map data.
Characteristics Revealed at Glycan Level
Glycosylation can be revealed at both the protein and peptide level. A detailed insight into the sugars, however, can only be obtained following their removal from the protein/peptide backbone (9). This is preferably done enzymatically using the deglycosidase PNGase F. The liberated sugars are subsequently labelled via reductive amination to improve their chromatographic separation and detectability (fluorescence and mass spectrometric detection). Figure 5 displays the analysis of 2-aminobenzamide (2-AB) labelled mAb N-glycans using hydrophilic interaction chromatography (HILIC) with on-line fluorescence (FLD) and MS detection. This measurement provides great detail in the glycans and allows structural isomers to be resolved, that is, G1Fa and G1Fb which differ in the positioning of the galactose residue either on the α1-3 or α1-6 branch of the complex type glycan. The FLD trace is typically used for quantitative purposes while the MS trace is used for qualitative purposes. Indeed, as shown in the MS–MS spectrum of the main peak, G0F glycan sequence information can be obtained (Figure 5). Interpretation of glycan fragmentation spectra can be challenging given the branching and the presence of isomeric building blocks: galactose and mannose.
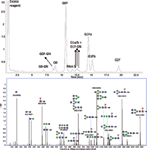
Figure 5: Hydrophilic interaction chromatography with fluorescence and MS (HILICâFLDâMS) analysis of 2-AB labelled mAb N-glycans on a sub-2 µm HILIC column (15 cm length à 2.1 mm internal diameter) operated at 40 °C using ammonium formate, acetonitrile and water as mobile phase constituents. The upper trace shows the FLD trace while the lower trace shows the QâTOF-MSâMS spectrum of the G0F glycan. For the nomenclature of the main peaks, the reader is referred to Figure 1.
When comparing the N-glycosylation quantitation accuracy at protein, peptide and glycan level, a remarkable consistency is noticed. This is demonstrated in Table 1 when the four main glycans in the quantitation are considered.

Table 1: mAb N-glycosylation measured relatively at protein, peptide and glycan level.
Conclusion
Protein biopharmaceuticals are an emerging class of therapeutics. This article provides a brief overview on the characterization of these molecules at both protein, peptide and glycan level using LC–MS. The use of LC–MS in biotherapeutic analysis evidently goes beyond the topics discussed. It is also being applied to determine higher order characteristics, for example, using hydrogen/deuterium exchange, thereby complementing nuclear magnetic resonance spectroscopy (NMR) and X-ray crystallography (2,6,10). In addition, the technique is being proposed as an alternative to the more common ligand binding assays in pharmacokinetic studies, requiring the measurement of therapeutic proteins at low levels in complex matrices such as blood plasma (6,11). In the latter case, triple quadrupole mass spectrometers are the systems of choice.
Koen Sandra is R&D Director Life Sciences at RIC, Kortrijk, Belgium.
Isabel Vandenheede is a protein analyst at RIC, Kortrijk, Belgium.
Pat Sandra is Chairman at RIC, Kortrijk, Belgium.
Acknowledgments
The authors acknowledge the Agency for Innovation by Science and Technology in Flanders, Belgium (IWT-Flanders).
References
(2) S.A. Berkowitz, J.R. Engen, J.R. Mazzeo and G.B. Jones, Nat. Rev. Drug Discov.11(7), 527–540 (2012).
(3) J.G. Elvin, R.G. Couston and C.F. van der Walle, Int. J. Pharm. 440(1), 83–98 (2013).
(4) C.A. Srebalus Barnes and A. Lim, Mass Spectrom. Rev. 26(3), 370–388 (2007).
(5) Z. Zhang, H. Pan and X. Chen, Mass Spectrom. Rev. 28(1), 147–176 (2009).
(6) A. Beck, S. Sanglier-Cianferani and A. Van Dorsselaer, Anal. Chem. 84(11), 4637–4646 (2012).
(7) S. Fekete, A.L. Gassner, S. Rudaz, J. Schappler and D. Guillarme, Trends Anal. Chem. 42, 74–83 (2013).
(8) J.B. Fenn, M. Mann, C.K. Meng, S.F. Wong and C.M. Whitehouse, Science 246(4926), 64–7 (1989).
(9) C. Huhn, M.H.J. Selman, L.R. Ruhaak and A.M. Deelder, Proteomics 9(4), 882–913 (2009).
(10) D. Houde and J.R. Engen, Methods. Mol. Biol. 988, 269–289 (2013).
(11) M. Fernandez Ocana, I.T. James, M. Kabir, C. Grace, G. Yan, S.W. Martin and H. Neubert, Anal. Chem. 84(14), 5959–5967 (2012).
Regulatory Deadlines and Supply Chain Challenges Take Center Stage in Nitrosamine Discussion
April 10th 2025During an LCGC International peer exchange, Aloka Srinivasan, Mayank Bhanti, and Amber Burch discussed the regulatory deadlines and supply chain challenges that come with nitrosamine analysis.
Polysorbate Quantification and Degradation Analysis via LC and Charged Aerosol Detection
April 9th 2025Scientists from ThermoFisher Scientific published a review article in the Journal of Chromatography A that provided an overview of HPLC analysis using charged aerosol detection can help with polysorbate quantification.
Removing Double-Stranded RNA Impurities Using Chromatography
April 8th 2025Researchers from Agency for Science, Technology and Research in Singapore recently published a review article exploring how chromatography can be used to remove double-stranded RNA impurities during mRNA therapeutics production.


