Perspectives on the Adoption and Utility of 1.0-mm Internal Diameter Liquid Chromatography Columns
One millimetre internal diameter liquid chromatography columns are available from many manufacturers. In this article, the utility of 1.0-mm internal diameter (i.d.) columns, and the arenas in which they play a relatively strong role, are investigated. Further, the advantages and disadvantages of 1.0 mm diameter columns are contrasted with both larger- and smaller-bore formats.
One millimetre internal diameter liquid chromatography columns are available from many manufacturers. In this article, the utility of 1.0-mm internal diameter (i.d.) columns, and the arenas in which they play a relatively strong role, are investigated. Further, the advantages and disadvantages of 1.0 mm diameter columns are contrasted with both larger- and smaller-bore formats.
It has been observed over recent years that 1.0-mm internal diameter (i.d.) columns continue to be introduced by manufacturers. The usage of 1.0-mm i.d. columns in the laboratory, however, seems to be scarce. A rudimentary scan of research articles employing these smaller-bore columns initially supported this hunch, and prompted a more intensive investigation into the utility of 1.0-mm i.d. columns. What follows is a synopsis of these findings.
Terminology
The terminology surrounding column geometries is often confusing. Terms such as “nanobore” and “microbore” are often used to describe a number of different formats. For example, Majors referred to columns having an internal diameter greater than 3 mm (up to and including 4.6 mm) as “conventional” or “standard” columns. The term “microbore” is associated with 2.1-mm internal diameters. The term “narrow-bore” is used for columns of greater than 1.0 but less than 2-mm i.d., and “capillary” is employed to describe columns with internal diameters less than 1.0 mm (1). In a 2003 article, Gerard Rozing proposed that 4 mm to 5 mm i.d. columns be termed “normal-bore”, 2.1 mm < i.d. < 4 mm as “narrow- or small-bore”, 1.0 mm ≤ i.d. ≤ 2 mm as “microbore”, 100 µm < i.d. < 1.0 mm as “capillary”, and “nanobore” for columns less than 100 µm (2). In addition, terms describing flow rate, including nanoflow and microflow, are often mixed into the column descriptions. To this author’s knowledge, there has been no formal standardization of terminology relating to internal diameters of liquid chromatography (LC) columns. For clarity, actual internal diameters or specified ranges of internal diameters are used throughout this work when describing column geometries.
Manufacturing Trends
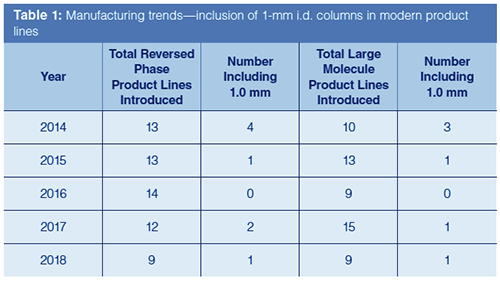
Table 1 shows a count of the reported new product lines introduced based on LCGC manufacturer surveys over the past five years (3–7). The data are first broken down into product lines intended for reversed-phase chromatography, as this tends to be the category most widely used. Within the reversed-phase category, the number of product lines that contained the release of 1.0-mm formats was counted and presented (authors note: inclusion was based on data provided by vendors at the time of submission). As smaller internal diameter columns are often associated with the needs of large molecule separations, columns designated for large molecule analyses (peptides, proteins, and antibodies) are separately counted, along with the number of these lines that included 1.0-mm diameters. The data indicate that the number of product line introductions targeted towards reversed-phase separations has largely stayed constant over the past five years. The number of product lines reported to include 1.0âmm columns, however, seems to have decreased from four entries in 2014 to no more than two (2017) in the years following. Although there have been nearly the same number of overall product line introductions geared towards large molecule separations, the downwards trend of including 1.0-mm i.d. columns parallels that of reversed-phase introductions. This was a surprising result, as smaller bore columns are often associated with the needs of large molecule analysis.

Reviewing one major column supplier website, 94 column products (including guard systems) out of 547 (17%) were described as having 1.0 mm diameters. The data suggest that column vendors are paying less attention to 1.0-mm i.d. column formats, but still retain a considerable portfolio of 1.0-mm i.d. options.
User Trends
In the last high performance liquid chromatography (HPLC) column survey published by Ron Majors in 2012, column dimensions below 2.1-mm i.d. were not reported in the top five employed column formats (1). An increase in the popularity of 2.1-mm and 3.0-mm columns from previous surveys (8,9) was speculated as being due to the increase in use of mass spectrometric (MS) detection in conjunction with liquid chromatography (LC).
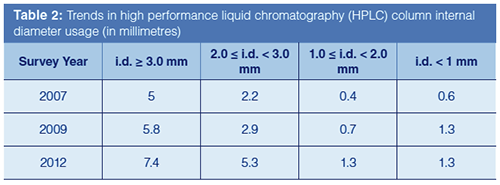
The data presented in Table 2 is based on surveys of end-user purchasing habits conducted in 2007, 2009, and 2012. The values noted are weighted averages attempting to estimate the number of columns used per year, per instrument. In a relative sense, columns based on 3 mm and larger internal diameters have historically dominated usage (and continue to do so). As noted above, there has been a significant rise in the use of 2.1-mm i.d. columns, largely due to adoption of LC–MS platforms. Smaller diameters of greater than or equal to 1.0 mm and less than 2 mm (typically 1.0 mm and herein noted as such for simplicity) have risen as well. Lastly, smaller diameters than 1.0 mm appeared to rise between 2007 and 2009, but levelled out according to the 2012 results. In this treatment, the lower column usage for the smaller two diameter classes can be attributed to the smaller number of available instruments suitable for their operation (1).

In an attempt to further understand the general trends on 1.0-mm i.d. column usage from the user perspective, several literature searches were attempted. The lack of common terminology, however, made this task extremely difficult. It suffices to report that finding either fundamental or applied papers specifically using 1.0-mm i.d. columns proved onerous. The user results seem to indicate that, although the 1.0-mm column formats are available from a number of manufacturers, the format is not well adopted.
Why Go Narrow?
The desire for narrower columns stems from several areas of interest. Smaller column volumes result in less solvent consumption, and therefore may reduce cost and provide for an overall greener separation technology. As noted by Lestremau and associates, reducing the use of environmentally unfriendly solvents through reduction in volume, rather than replacement with greener solvents, is often preferred from a selectivity standpoint (10). Smaller column internal diameters and thus lower optimal flow rates also give rise to more efficient desolvation or ionization in LC–MS analyses resulting in greater sensitivity.
The disadvantages of smaller-bore columns lies in the limited loading capacity and the relative impact of extra-column band broadening in a given chromatographic system. The limited loading capacity may be offset by the increase in detection sensitivity when coupled with mass spectrometry (MS). Extra-column volume, however, is fixed for a given system, and, as the column volume is reduced, band broadening as a result of the extra-column volume increases. Lestremau and associates compared the performance of commercially available 1.0 mm × 100 mm and 2.1 mm × 100 mm columns using a modern ultrahighâperformance liquid chromatography (UHPLC) system, and determined that, in isocratic mode, approximately 67% of the efficiency was obtained on the 1.0âmm i.d. column versus the 2.1âmm i.d. geometry (10). The impact of extra-column volume could be reduced by either increasing the 1.0-mm i.d. column length (increase the relative volume of the column), or by converting to gradient mode. The group reported that in the latter mode 80% of the efficiency obtained on the 2.1-mm i.d. column could be achieved using the 1.0-mm i.d. column.
Packed columns in 1.0-mm diameter tubing do not often provide efficiencies that are theoretically expected, even when extra-column dispersion is taken into account. Loss of efficiency can also be caused by poorly packed beds, inadequate surface treatments, and frit dispersion. Axial heterogeneity in the packed bed is also a source of dispersion. Gritti and Wahab explained that, using conventional methods, the packed bed near the wall of the column is more dense than that of the bulk packing, which results in variance in analyte and mobile phase velocity through the column (11). For a given column internal diameter, there exist wall region (more dense) volumes and bulk region (more loosely packed) volumes. For 0.8–1.0-mm columns, the wall region volume to bulk region volume ratio is close to 1. This is the worst case because it maximizes the potential for the sample to be impacted by the heterogeneity. For larger diameter columns, the wall volume becomes overall less significant, and, for smaller column internal diameter, the bulk region becomes less significant.
Anspach and colleagues, however, demonstrated that laboratoryâproduced columns with 1.0-mm internal diameters could produce efficiencies close to theoretical predictions (12). Great care in the design of column hardware (retaining frits, for example), experimental parameters such as injection volume, and instrument configuration to limit extra-column dispersion was required. Similarly, Ma and associates determined that 80–90% of the efficiency of a 2.1-mm i.d. column could be achieved with a 1.0-mm i.d. column for well-retained analytes when the system was optimized for minimal extra-column band broadening (13). Band focusing using weak injection solvent was also noted as a potential means to minimize the impact of extra-column volume. Without modification of the HPLC system for the smaller internal diameter column, Wu and Bradley reported a 73% loss of efficiency on a 1.0-mm i.d. column for a well retained analyte when compared to a 4.6-mm i.d. column of the same length (14).
Who Uses 1.0-mm i.d. Columns?
As noted above, finding research where 1.0 mm i.d. columns were specifically utilized was difficult. For example, in a review of microâUHPLC as applied to residue and contaminant analysis, Blokland and colleagues made no mention of column internal diameters in the region of 1.0 mm, yet described much research using 2.1 mm and sub-1.0-mm i.d. columns (15). With the preconception that 1.0-mm i.d. columns would be most popular in large molecule analyses, the many articles pored over were again found to be either based on 2.1-mm or subâ1.0-mm i.d. columns.
Olkowiscz and associates compared method performance using a 1.0-mm i.d. column (termed “LC microflow”) versus “direct”, and a “preconcentration” system utilizing 75-µm columns for the quantitation of cardiac troponin T in mouse heart (16). The group determined that the preconcentration method utilizing the 75-µm column provided a significant gain in sensitivity without loss of accuracy and precision as compared to the 1.0-mm i.d. column setup.
One successful usage of 1.0âmm i.d. columns discovered was for the analysis of monoamine neurotransmitters in microdialysis samples (17). As expected, the group demonstrated a significant increase sensitivity using the 1.0âmm i.d. column as compared to a 2.1âmm i.d. column. Careful attention to band broadening as a result of extra-column volume was noted. In addition, the group reported the use of a weak sample injection solvent to aid in focusing the sample at the head of the column. In this case, the 1.0-mm i.d. format fit the needed sample size, sensitivity requirements, and speed of analysis desired.
Conclusions
Although 1.0-mm i.d. columns are commercially available for liquid chromatography, the adoption of this format by users is relatively low. The increase in sensitivity afforded by the reduction in column volume from the more popular 2.1 mm to 1.0 mm is confounded by decreases in efficiency and loadability. The effort needed to reduce extraâcolumn volumes or compensate for instrument band broadening to focus analytes at the head of columns appears to be a strong barrier. In addition, the packing quality of commercially available 1.0-mm i.d. columns may be suspect due to the challenges of wall effects. The apparent popularity of sub-1.0-mm i.d. columns suggests that users are more apt to move straight to “capillary” formats rather than deal with 1.0-mm nuances. In some cases, however, the 1.0-mm i.d. format can provide the right combination of sensitivity and speed.
References
- R.E. Majors, LCGC Europe25(1), 31–39 (2012).
- G. Rozing, LCGC Europe6(6A), 1–7 (2003).
- R.E. Majors, LCGC Europe27(4), 195–207 (2014).
- M. Swartz and R.E. Majors, LCGC Europe28(4), 232–243 (2015).
- D.S. Bell, LCGC Europe29(4), 214–224 (2016).
- D.S. Bell, LCGC Europe31(4), 234–247 (2018).
- D.S. Bell, LCGC Europe30(4), 196–207 (2017).
- R.E. Majors, LCGC North Am. 27(11), 956–972 (2009).
- R.E. Majors, LCGC North Am.25(6), 532–544 (2007).
- F. Lestremau, D. Wu, and R. Szücs, J. Chromatogr. A1217(30), 4925–4933 (2010).
- F. Gritti and M. Farooq Wahab, LCGC Europe31(2), 90–101 (2018).
- J.A. Anspach, T.D. Maloney, and L.A. Colón, J. Sep. Sci.30(8), 1207–1213 (2007).
- Y. Ma, A.W. Chassy, S. Miyazaki, M. Motokawa, K. Morisato, H. Uzu, M. Ohira, M. Furuno, K. Nakanishi, H. Minakuchi, K. Mriziq, T. Farkas, O. Fiehn, and N. Tanaka, J. Chromatogr. A1383, 47–57 (2015).
- N. Wu and A.C. Bradley, J. Chromatogr. A1261, 113–120 (2012).
- M.H. Blokland, H.G. Mol, and A. Gerssen, LCGC Europe27(s9), 13–18 (2014).
- M. Olkowicz, I. Rybakowska, S. Chlopicki, and R.T. Smolenski, Talanta, 131, 510–520 (2015).
- J. Van Schoors, K. Maes, Y. Van Wanseele, K. Broeckhoven, and A. Van Eeckhaut, J. Chromatogr. A1427, 69–78 (2016).
David S. Bell is a director of Research and Development at Restek. He also serves on the Editorial Advisory Board for LCGC and is the Editor for “Column Watch”. Over the past 20 years, he has worked directly in the chromatography industry, focusing his efforts on the design, development, and application of chromatographic stationary phases to advance gas chromatography, liquid chromatography, and related hyphenated techniques. His undergraduate studies in chemistry were completed at the State University of New York at Plattsburgh (SUNY Plattsburgh), USA. He received his Ph.D. in analytical chemistry from The Pennsylvania State University, USA, and spent the first decade of his career in the pharmaceutical industry performing analytical method development and validation using various forms of chromatography and electrophoresis. His main objectives have been to create and promote novel separation technologies and to conduct research on molecular interactions that contribute to retention and selectivity in an array of chromatographic processes. His research results have been presented in symposia worldwide, and have resulted in numerous peerâreviewed journal and trade magazine articles. Direct correspondence to: LCGCedit@ubm.com

Detecting Hyper-Fast Chromatographic Peaks Using Ion Mobility Spectrometry
May 6th 2025Ion mobility spectrometers can detect trace compounds quickly, though they can face various issues with detecting certain peaks. University of Hannover scientists created a new system for resolving hyper-fast gas chromatography (GC) peaks.
University of Oklahoma and UC Davis Researchers Probe Lipidomic Profiles with RP-LC–HRMS/MS
May 6th 2025A joint study between the University of Oklahoma Health Sciences Center (Oklahoma City, Oklahoma) and the UC Davis West Coast Metabolomics Center (Davis, California) identified differentially regulated lipids in type 2 diabetes (T2D) and obesity through the application of reversed-phase liquid chromatography-accurate mass tandem mass spectrometry (RP-LC-accurate MS/MS).
Automated Sample Preparation (ISO 20122) for MOSH/MOAH in Seasoning Oils
May 6th 2025This work presents an Automated Sample Preparation procedure for MOSH/MOAH analysis of Seasoning Oils. We compare results from a manual epoxidation procedure compliant with DIN 16995 with results based on fully automated sample preparation (epoxidation and saponification) compliant with ISO 20122. In both cases, online clean-up via activated aluminum oxide (AlOx) are used to remove interfering n-alkanes from the MOSH fraction during the HPLC run. Automated data evaluation using a dedicated software (GERSTEL ChroMOH) is presented.

.png&w=3840&q=75)

.png&w=3840&q=75)


.png&w=3840&q=75)


.png&w=3840&q=75)


