The Perfect Method, V: Changing Column Selectivity
LCGC North America
How to avoid an expensive shot in the dark.
For the last several months we've been working through the steps to develop a liquid chromatography (LC) method quickly and effectively. First we looked at setting separation goals (1) and selecting the starting conditions (2). Then we adjusted retention times (3) and mobile phase conditions (4) to get the retention and peak spacing to meet the goals we set. Changes in the mobile phase percent organic (%B), solvent type, pH, and temperature were easy variables to modify in an effort to fine-tune the separation, because these variables can be changed in a continuous manner. That is, the incremental change in the parameter from one run to the next can be made in any step size we desire, such as a change from 45% B to 46% B or 43% methanol, 35% acetonitrile, and 22% buffer to 44% methanol, 34% acetonitrile, and 22% buffer. One other variable that can be useful to change peak spacing is a change in the column type, for example, C18 to phenyl. Unfortunately, such column changes are in discrete steps — it is not possible to change from 44% phenyl and 56% C18 to 43% phenyl and 57% C18. And changing columns is expensive — typically $500 per column — so column changes have more budgetary impact than changes in pH or temperature.

This month's installment of "LC Troubleshooting" will focus on changing the column as a means to change the peak spacing in a chromatogram. We will consider two approaches — a traditional one of selecting the column by bonded phase type and a newer technique based upon the chromatographic properties of the column.
"Orthogonal" Columns
We often hear the term "orthogonal" to describe a column or separation change in the quest to obtain a better separation of two or more peaks. Strictly speaking, orthogonal conditions are those that produce a separation that is at right angles or perpendicular to the current one. As long as we are working with reversed-phase LC, hydrophobic interactions dominate the separation mechanism, so no matter what change we make, hydrophobic interactions are still the most important ones. As a result, there is no truly orthogonal separation condition in this context. Perhaps if we switched to a different retention mechanism, such as from reversed phase to ion exchange, we might get orthogonality, but some would argue that as long as we used LC as the analytical tool, we wouldn't achieve orthogonal results.

John W. Dolan
Our present goal is to get a significantly different separation than the one we currently have, and in this context, we'll refer to a set of conditions that achieves this goal as orthogonal. (Those of you who are purists had better stop reading at this point or take your blood pressure medicine!)
Contributions to Column Selectivity
There are three major contributions to achieving the desired selectivity, or peak spacing, in reversed-phase LC, the analyte chemistry, the mobile phase composition, and the column composition. For the most part, we're stuck with the analyte chemistry (with the major exception for ionic compounds when the mobile phase pH is changed), and we've already explored mobile phase changes. The column chemistry has two major contributions — the packing particles (usually silica) and the bonded phase. There was a time when we thought all silica was created equal and all bonded phases of the same description were the same. Thus, a C18 column was a C18 column . . . period. This gave rise to the L-1 classification in the United States Pharmacopoeia (USP), grouping all C18 columns in one category. Now, unless you are very new at LC or very naive, you realize that not all C18 columns are created equal.
The Traditional Approach
Even though we know that all C18 columns are not the same, it seems logical that a change in the bonded phase type will be more likely to change peak spacing than a change to another C18 column. One common approach to try to change selectivity by a change in column is to change from a C18 column to a phenyl or cyano column. The logic is that both the phenyl and cyano columns have π–π interactions that are not present with the C18 phase and the cyano also has dipole–dipole contributions. To limit the variables, often columns are selected from the same family of phases from the same manufacturer. This means that the same silica particles are used, so the differences seen are the result of the bonded phase changes.
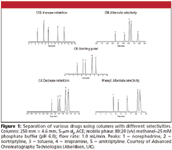
An example of selectivity changes with bonded phase changes is shown in Figure 1 for a sample of several drugs. These columns are all from the same manufacturer and are operated under identical conditions (see figure caption). The reference conditions use a C8 bonded phase, which gives a retention time for the last peak of approximately 7.5 min. The primary effect of changing to a C18 or C4 phase is that retention is increased or decreased, respectively. There are some minor changes in peak spacing, but all three columns use a hydrocarbon bonded phase, so little change in the bonded phase chemistry and, thus, peak spacing is expected or observed.

Figure 1
A change to the phenyl or cyano column makes a significant change in selectivity for this set of aromatic compounds, for which π–π interactions are expected to be significant. The phenyl column reverses peaks 2 and 3, whereas with the cyano column only peak 4 is in the same order as it was with the C8 column. I think we can agree that the cyano column gives an orthogonal separation for this sample; the phenyl column has some, but not as much orthogonal nature. I would expect the results to be much less dramatic for a sample that did not have a significant aromatic or dipole component.
Over the last ten years, bonded phases containing an embedded polar group (EPG) have become popular. These often incorporate a nitrogen-containing functional group, such as an amide or carbamate, near the base of the C8 or C18 bonded phase chain. The EPG phase can impart a significant change in selectivity over the comparable C8 or C18 phase, so it represents a viable alternative to the phenyl or cyano phases for a change in selectivity. EPG columns also have the advantage of being capable of operation in 100% aqueous mobile phases without phase dewetting (which we called "phase collapse" in the past), so they have added flexibility. For many workers today, the EPG column is the column of choice for alternate selectivity when a C18 column does not give the desired separation.
An Alternate Technique
The use of a cyano, phenyl, or EPG column to give different selectivity from a C8 or C18 column has stood the test of time, but is not a guarantee of orthogonality. Just as some pairs of different C18 columns give similar separations and other pairs exhibit changes in selectivity, some of the alternate non-C18 columns might give similar separations to the starting C18 column. It would be nice to have increased confidence that the chosen column would indeed make significant changes in the separation. In the last few years, several groups have been working on ways to quantify the differences and similarities between LC columns and translate this information into practical tools. The results from one of these studies has generated a database of more than 300 commercial reversed-phase columns, which allows the user to select columns that are similar or ones that are different from a chosen reference column. (See reference 5 for a recent review of this approach, the "hydrophobic-subtraction model.")
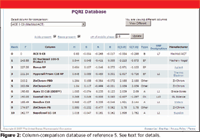
The database is available in beta-test version on the USP website (6) and is expected to be available in a released version in the future. The screen capture shown in Figure 2 depicts the database configured to look for columns of different selectivity ("View Different" button in upper right for Figure 2). You select your current column from the drop-down menu at the upper right. In this case, I've chosen the ACE 5 C8 column, the same one used as the starting place in Figure 1. Next, select the appropriate check boxes if the sample has acids or bases present and enter the pH of the mobile phase. After these selections have been made, the database searches for columns that are maximally different from the reference column and displays the 10 columns most different. The measure of the difference is the Fs fitting value (abbreviated F in the database). If the Fs value is greater than approximately 65, the column has a high likelihood of giving different selectivity. You can see that the displayed columns all have Fs values greater than 162 — significantly different. The next few columns of the database display measured characteristics of the columns: H, hydrophobicity; S (abbreviated S* in the table), resistance of the bonded phase to penetration by bulky molecules; A, and B, the ability to hydrogen bond with nonionized acids and bases, respectively; and C, the cation-exchange characteristics of the column at pH 2.8 and 7.0 (see (5) and related references for a more detailed discussion of these parameters). The column type is listed, the USP "L" classification, and the manufacturer at the far right.

Figure 2
For the reference column we selected, a sample containing both acids and bases, and a mobile phase pH of 2.8, it can be seen that the list of different columns contains several different phase options. Three of the choices are EPG columns (abbreviated EP in the table) and one is a cyano (CN) column, which is consistent with the previous discussion of the use of these phases as alternatives to the C8 or C18 column. There are also several columns with zirconia particles (ZirChrom, Anoka, Minnesota) indicated to exhibit different selectivity. Notice that three of the columns are Type A C18 columns. This highlights the difference that is sometimes observed between the older Type A silica particles and the newer, high purity Type B particle columns. Because of reproducibility and peak tailing problems with Type A columns, I recommend against using such columns for a new separation. Notice that in all cases except the Type A columns, the best choice columns for different selectivity is found with a different bonded phase from a different manufacturer. This means that the change in both the packing particle chemistry and the bonded phase are playing a part in giving alternate selectivity. It should be noted that this technique of choosing an orthogonal columns is not a guarantee of an orthogonal separation for your sample, but there is a high probability that this is the result you will obtain.
An Extra Point of Leverage
A change in stationary phase type using one of the two techniques discussed previously is likely to give you a change of selectivity, but if you want to increase the chances of obtaining a significantly different separation, there is one additional change you can make. It is well known that a change in the organic solvent type, such as changing from methanol to acetonitrile, can be a powerful way to change selectivity in reversed-phase LC. If you combine this mobile phase change with a change in the stationary phase, you will further increase the chances of achieving an orthogonal separation (7). Thus, if we use the data of Figure 2, we might change from the ACE 5 C8 column in a pH 2.8 phosphate buffer–acetonitrile mobile phase to a Bonus RP (EPG) column with the same buffer, but methanol instead of acetonitrile. This combination would be likely (but not guaranteed) to give a separation with different selectivity. In the event that this change was not sufficient, a change in mobile phase pH could be used as additional way to change selectivity (7).
Summary
It usually is best from an economic and convenience standpoint to attempt to obtain the desired separation by changing the mobile phase strength, solvent type, temperature, and pH as discussed last month (4). If these changes are unsuccessful, a change in the column should be explored. A cyano, phenyl, or EPG column often will give a change in the separation from a starting C8 or C18 column. The database of Figure 2 can be used to improve the chances of selecting a column for a successful orthogonal separation. A change in the column plus a change in the mobile phase solvent type from methanol to acetonitrile or acetonitrile to methanol will give added power to change the separation selectivity.
JohnW. Dolan
"LC Troubleshooting" Editor John W. Dolan is Vice-President of BASi Northwest Laboratory of McMinnville, Oregon; a Principal Instructor for LC Resources, Walnut Creek, California; and a member of LCGC's editorial advisory board. Direct correspondence about this column to "LC Troubleshooting," LCGC, Woodbridge Corporate Plaza, 485 Route 1 South, Building F, First Floor, Iselin, NJ 08830, e-mail John.Dolan@Bioanalytical.com
For an ongoing discussion of LC trouble-shooting with John Dolan and other chromatographers, visit the Chromatography Forum discussion group at http://www.chromforum.com.
References
(1) J.W. Dolan, LCGC 25(6), 546–552 (2007).
(2) J.W. Dolan, LCGC 25(7), 632–638 (2007).
(3) J.W. Dolan, LCGC 25(8), 704–709 (2007).
(4) J.W. Dolan, LCGC 25(9), 944–950 (2007).
(5) L.R. Snyder, J.W. Dolan, and P.W. Carr, Anal. Chem. 79, 3254-3262 (2007).
(6)http://www.usp.org/USPNF/columnsDB.html
(7) J. Pellett, P. Lukulay, Y. Mao, W. Bowen, R. Reed, M. Ma, R.C. Munger, J.W. Dolan, L. Wrisley, K. Medwid, N.P. Toltl, C.C. Chan, M. Skibic, K. Biswas, K.A. Wells, and L.R. Snyder, J. Chromatogr., A 1101 (2006) 122–135.

Common Challenges in Nitrosamine Analysis: An LCGC International Peer Exchange
April 15th 2025A recent roundtable discussion featuring Aloka Srinivasan of Raaha, Mayank Bhanti of the United States Pharmacopeia (USP), and Amber Burch of Purisys discussed the challenges surrounding nitrosamine analysis in pharmaceuticals.


