Development and Validation of a UHPLC Method for Paroxetine Hydrochloride
LCGC North America
An ultrahigh-pressure liquid chromatography (UHPLC) method was developed to separate paroxetine from several of its related compounds using a systematic screening protocol that monitors combinations of selectivity factors including column chemistry, organic modifier, and pH. When the best combination of these factors was selected, the method was optimized by varying gradient slope and temperature.
Paroxetine is a potent and selective serotonin (5-hydroxytryptamine) reuptake inhibitor. The activity of the drug on brain neurons is thought to be responsible for its antidepressant effects. Paroxetine hydrochloride is the active ingredient of Paxil, a prescription drug used to treat panic disorder, social anxiety disorder, generalized anxiety disorder, obsessive–compulsive disorder, posttraumatic stress disorder, renal–hepatic impairment, and depression (1). Any related compounds, excipients, or impurities that exceed peak areas greater than 0.1% of the active ingredient must be fully identified, explained, and quantified for ICH guidelines to be met (2).

An ultrahigh-pressure liquid chromatography (UHPLC) method was developed to separate paroxetine from several of its related compounds by utilizing a systematic screening protocol that monitors combinations of selectivity factors including column chemistry, organic modifier, and pH. After the best combination of these factors was selected, the method was optimized by varying gradient slope and temperature.
As shown by MacNair and colleagues (3,4), the use of extremely high pressures in LC can improve the efficiency and reduce analytical time for columns packed with small particles. High performance LC (HPLC) methods typically use columns packed with 3-μm particles or greater on pumps operating at pressures as high as 6000 psi, while UHPLC methods use 1.7-μm particle columns operating at pressures as high as 15,000 psi. The smaller particle columns and larger pressure capacity offer significantly improved speed and peak capacity (5). Using 1.7-μm particles and a holistically designed system provide significantly more resolution (information) while reducing run times and improving sensitivity for the analyses of many types of compounds (6). UHPLC methods take advantage of smaller particle sizes and higher linear velocities, which produce higher efficiency at faster optimum flow rates (7). The time savings combined with increase in sensitivity while maintaining resolution provide a tremendous advantage to using UHPLC instead of HPLC methods and columns.
The 2006 USPC, Inc. Official 8/1/06 – 4/30/07 USP Monographs: Paroxetine hydrochloride, uses three different chromatographic runs on three different analytical columns to separate related compounds B, D, F and G from the active pharmaceutical ingredient (8). The total analysis time using HPLC columns and technology is over 180 min. Equivalent or greater resolution of related compounds B, D, F, and G from paroxetine was achieved in a single chromatographic run in less than 5 min using an UHPLC system and a 50 mm × 2.1 mm,1.7-μm column.
The method was validated using method validation software. The software enabled method validation, experimental design, and statistical analysis of the data to be preformed completely within the software. Paroxetine was treated as a drug substance and validated as a purity assay in phase II of development.
This article addresses the successful development and partial validation of an LC method for the analysis of paroxetine and its related compounds.
Experimental
Materials: USP reference standards: USP Paroxetine Hydrochloride RS, USP Paroxetine System Suitability Mixture A RS, USP Paroxetine Related Compound B RS, USP Paroxetine Related Compound C RS, USP Paroxetine Related Compound E Mixture RS, USP Paroxetine Related Compound F RS, USP Related Compound G RS were all purchased from the United States Pharmacopeia (Rockville, Maryland). Water was purified with a Milli-Q system (Millipore, Billerica, Massachusetts). Acetonitrile, formic acid, and ammonium hydroxide were purchased from Fisher Scientific (Fair Lawn, New Jersey). Ammonium bicarbonate and ammonium formate were purchased from Sigma-Aldrich (St. Louis, Missouri).
LC Apparatus and Conditions
A Waters ACQUITY UPLC system (Milford, Massachusetts) was utilized for the separation and consisted of a Binary Solvent Manager (BSM), Sample Manager (SM), Column Manager, and a photodiode-array detector. System control, data collection, and data processing were accomplished using Waters Empower 2 Chromatography Data System software with the Method Validation Manager option. The method development protocol was performed on four column chemistries; ACQUITY UPLC BEH C18, BEH Shield RP18, BEH Phenyl, and HSS T3. The column configuration was 50 mm × 2.1 mm, 1.7-μm and 1.8-μm for the BEH and HSS columns, respectively. Mobile phase A1 contained a 20 mM ammonium formate buffer adjusted to pH 3 using formic acid. Mobile phase A2 contained a 20 mM ammonium bicarbonate buffer adjusted to pH 10 using ammonium hydroxide. Mobile phase ± contained acetonitrile, and mobile phase B2 contained methanol. A 5-min gradient from 5% to 90% B was used as a general scouting gradient. The flow rate was 0.5 mL/min.
For validation, a 4-μL injection was performed with a 10-μL sample loop using partial-loop needle overfill injection mode. To minimize carryover, 200-μL of the strong needle wash (10:90 water–acetonitrile) and 600 μL of the weak needle wash (5:95 methanol–water) were used. Detection wavelength was 295 nm based upon 2006 USPC, Inc. Official 8/1/06–4/30/07 USP Monographs: Paroxetine hydrochloride (8). A sampling rate of 20 points/s and a filter constant of 0.10 s were used.
Method Development
Sample Preparation: Paroxetine hydrochloride was prepared at a concentration of 200 μg/mL with the related compounds spiked in at 10% of the concentration of paroxetine for easy identification. This resulted in a concentration of 20 μg/mL, in 50:50 methanol–water. After the initial screening was complete, a second mixture containing paroxetine-related compounds at concentration of 0.1% of paroxetine hydrochloride was prepared to emulate a sample of disparate concentrations. The new sample was prepared as described in the validation section of this report.
Validation
Stock solution of paroxetine hydrochloride was prepared at 1 mg/mL in 50:50 methanol–water. Stock solutions of related compounds B, D, and F were prepared at 100 μg/mL in a solution of 50:50 methanol–water. Related compound G was prepared at 200 μg/mL in a solution of 50:50 methanol–water. A combined standard mixture of paroxetine at 200 μg/mL and related compounds at 0.2 μg/mL in a solution of 50:50 methanol–water was prepared. This mixture was used for method development, system suitability, specificity, repeatability, intermediate precision, and robustness experiments.
For linearity and accuracy (recovery) experiments, a stock solution of paroxetine hydrochloride was prepared at 300 μg/mL followed by serial dilutions of each subsequent concentration to make calibration standards of 250, 200, 150, and 100 μg/mL. Related compounds were spiked into each solution at 0.1% concentration level relative to paroxetine.
Results and Discussion
Method development initial screening: Many approaches are taken towards developing a chromatographic method. Common approaches include: conducting a literature search, trial and error, a stepwise iterative approach or a systematic screening protocol. A well designed method development strategy can generate a significant amount of information up front. This can alleviate the total work necessary for the method validation process, providing an efficient and cost-effective protocol (9). In accordance with the work of Snyder and colleagues (10), a steep gradient that highlighted the % organic the analytes would elute was used. Combinations of pH and organic solvent were varied so that each column was screened at low pH and at high pH with acetonitrile as the organic modifier and then with methanol as the organic modifier. A comprehensive approach that systematically screens combinations of different variables (as was implemented in this work) often will lead to a successful result in a more efficient manner when compared to a typical trial and error approach.
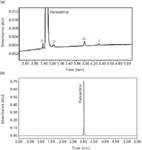
Figure 1: Final separation of paroxetine and related compounds B, D, G, and F: (a) zoomed in and (b) absorbance full scale. The related compounds are at the 0.1% level.
By using UHPLC to monitor combinations of selectivity factors (column chemistry, organic modifier, and pH), systematic method screening can be completed within 7 h. Screening each column at low and high pH with acetonitrile as the organic modifier and then with methanol as the organic modifier produced a 14-chromatogram matrix of results: four chromatograms for each BEH column and two for the HSS T3; the HSS T3 was not evaluated at alkaline pH due to limitation of chemical resistance with alkaline mobile phase. Each of these chromatograms was evaluated for retentivity, peak shape, and resolution. Using the result matrix, the first decision was made by evaluating the data produced at the extremities of the pH scale.
By first evaluating the data acquired at low and high pH, the retention characteristics, loadability, and overall chromatographic resolution of the mixture of analytes can be determined quickly. As seen in Figure 2, acidic mobile phase pH results in poor resolution of paroxetine and related compounds. Alkaline pH provided better retention and resolution of all components due to the change in charge state of analytes.
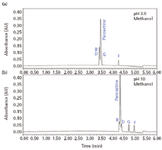
Figure 2: Selectivity comparison of mobile phase pH using the ACQUITY UPLC BEH C18 column: (a) pH 3 and (b) pH 10.
After the mobile phase pH is selected, the selectivity differences between the column chemistries were evaluated. As shown in Figure 3, all three BEH columns show potential for resolving all components. Due to its high chemical resistance to alkaline pH, we selected the BEH C18 for further optimization.
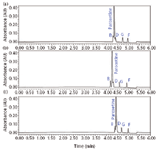
Figure 3: Column selectivity comparison at high pH: (a) ACQUITY UPLC BEH C18, (b) ACQUITY UPLC BEH Shield RP18, and (c) ACQUITY UPLC BEH Phenyl.
After selecting the mobile phase pH and column chemistry, we compared the selectivity produced by different organic modifiers. Methanol is a weaker elution solvent than acetonitrile, resulting in greater retention of all analytes. For this set of components, acetonitrile offers a better separation, as depicted in Figure 4.
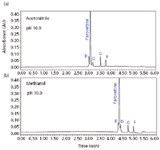
Figure 4: Solvent selectivity comparison: (a) acetonitrile and (b) methanol.
As a result of the systematic screening protocol employed, the combination of pH 10, BEH C18 column, and acetonitrile was selected for further optimization.
Optimization
For method optimization, the concentration of the related compounds was reduced from 10% of paroxetine, to the target concentration of 0.1%. As shown in Figure 5, inadequate resolution among paroxetine and related compounds B and D resulted due to disparate levels of concentration.
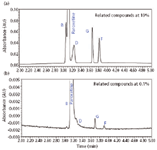
Figure 5: Disparate levels of concentration of related compounds relative to paroxetine. Shown are related compounds at (a) 10% and (b) 0.1%.
In efforts to improve chromatographic resolution, the gradient slope was altered by changing the % organic at both the endpoint and initial gradient conditions. Changing the gradient slope is often a balance between sensitivity relative to resolution. Using a shallower gradient slope might improve resolution, but it also will decrease sensitivity. Using a steeper gradient slope might compress the peaks and often reduces resolution; however, it also will focus the peaks and increase sensitivity. At first, the gradient slope was made shallower by altering the initial % organic from 5% to 20% acetonitrile, as shown in Figure 6a. Resolution of related compound D from paroxetine improves marginally. However, related compound B still was coeluted with paroxetine. Next, the gradient endpoint was altered, as shown in Figure 6b. In this case, although marginal improvements were made, altering gradient slope did not lead to a successful result. Another optimization parameter explored was column temperature.
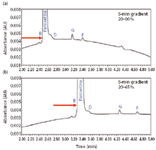
Figure 6: Chromatographic effect on (a) changing initial organic composition and (b) changing endpoint organic composition.
Temperature affects every chemical process that occurs. Increasing the temperature will reduce mobile phase viscosity, resulting in lower system back pressure. Increasing temperature also will change the rate of partitioning between the stationary phase and mobile phase, improving analyte diffusivity. In this case, column temperature was increased in 15 °C increments from 30 to 45 to 60 °C. Increasing temperature further improved the separation. Analyte diffusivity, sample loadability, and peak shape dramatically improved as illustrated in Figure 7. At 60 °C, adequate separation of related compounds from paroxetine was achieved; therefore, no further optimization was necessary.
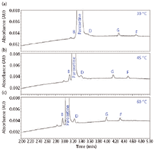
Figure 7: Influence of temperature on separation: (a) 30 °C, (b) 45 °C, and (c) 60 °C.
Final Conditions
Separation was performed on a 50 mm × 2.1 mm, 1.7-μm BEH C18 column at 60 °C. Mobile phase A contained 20.0 mM ammonium bicarbonate with 1.2% ammonium hydroxide. Mobile phase B was acetonitrile. A 5-min gradient from 20% to 65% acetonitrile was performed. Flow rate was 0.5 mL/min.
System Suitability
System suitability is the checking of a system to ensure system performance before or during the analysis of samples. The tests are based upon the concept that the equipment, electronics, analytical operations, and samples to be analyzed constitute an integral system that can be evaluated as such (2). System suitability tests were performed before each validation test to ensure the system performance.
Suitability Criteria
As depicted in Figure 1a, the retention times are 2.93, 3.08, 3.24, 4.00, and 4.29 min for related compound B, paroxetine hydrochloride, related compound D, related compound G, and related compound F, respectively. Related compound B and paroxetine as well as paroxetine and related compound D, represent the critical pairs in the separation. The resolution between these pairs must be greater than or equal to 1.5. These results are shown in Table I. The percent relative standard deviation for amount of replicate injections is less than 2.0% for each analyte peak.
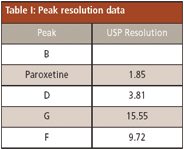
Table I: Peak resolution data
Method Validation Results
Method validation is the process by which it is established, through laboratory studies, that the performance characteristics of the method meet the requirements for its intended purpose (11–18). It is a part of the overall validation process that also includes software validation (18), instrument qualification (12,16), and system suitability (18). Analytical methods are used for many different purposes, and different test methods require different validation schemes. Any significant change to a method, instrumentation, or column type will require a method to be revalidated.
A factorial experimental approach toward conducting robustness testing: In a factorial design of experiments, multiple factor variations can be combined together in a single chromatographic run. The factorial design of experiments approach allows for the acquisition of a minimal amount of chromatographic runs, thus, saving on the amount of sample, analyst time, instrument time, and solvent waste disposal costs. In efforts to streamline the method validation process, the method validation option for the software was utilized.
Specificity
The discrimination of compounds in this procedure was confirmed by a comparison of known reference material of paroxetine and its related compounds (Figure 8a), compared with negative results from samples that do not contain the related compounds (Figure 8b). A sample diluent was prepared using the same protocols as the assay preparation to ensure sample cleanliness (Figure 8c). All other peaks are below the 0.05% detection threshold and do not have to be identified.
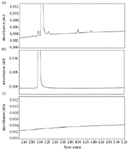
Figure 8: Paroxetine separations: (a) paroxetine and related compounds B, D, G, and F (related compounds are at the 0.1% level); (b) paroxetine hydrochloride without related compounds; and (c) a sample diluent blank.
Acceptance Criteria for Specificity
The diluent blanks must show no interference with the peaks of the active ingredients. Any coelution of significance (nonactive ingredient, excipient, or unknown peak) must be noted clearly in the final reporting of the results.
Specificity Results
Injections of a diluent blank showed no extraneous peaks. Injections of individual reference standards gave the following retention times; 2.93, 3.08, 3.24, 4.00, and 4.29 min for related compound B, paroxetine hydrochloride, related compound D, related compound G and related compound F, respectively. No other peaks were noted in the chromatograms from the individual standards.
Linearity
Serial dilutions from three 150% stock solutions (0.3 mg/mL paroxetine) were made and diluted four consecutive times to obtain five sets of linearity solutions from 50% to 150% of the nominal analytical concentration of the paroxetine (0.2 mg/mL). Each of the five linearity solutions were injected and the linear regression of these injections provided the correlation coefficient and line equation as seen in Table II.

Table II: Linearity R2 values and equation
Acceptance Criteria
The correlation coefficient should not be less than 0.959 for paroxetine.
Linearity Results
The linearity of paroxetine hydrochloride met the acceptance criteria for a range of 50% to 150% of the nominal concentration. Linearity results are shown in Figure 9 including 95% confidence interval lines.

Figure 9: Linearity curve for paroxetine hydrochloride including 95% confidence interval
Precision — Repeatability
Repeatability depicts the results of the method operating over a short time interval under the same conditions; also known as interassay precision. The repeatability of the main sample peak was measured by making six preparations at the 100% level (0.2 mg/mL), one injection per preparation.
Acceptance Criteria for Precision — Repeatability
The %RSD for area should not be more than 2.0% for the paroxetine peak. The %RSD for retention time should not be greater than 2.0%.
Precision — Repeatability Results
The repeatability met the acceptance criteria for the main sample component. Results are shown in Table III.

Table III: Repeatability at the 100% level (n = 6)
Precision — Intermediate Precision
To establish the effects of random events on the precision of the analytical procedure, an intralaboratory trial was conducted. Six sample assay preparations were analyzed over a three-day span, on two different systems, with two different columns, by two different analysts. The experimental design matrix is listed in Table IV.

Table IV: Intermediate precision experimental design matrix
Acceptance Criteria
The %RSD of both area and retention time obtained from the six preparations by both analysts should not be greater than 3.0%. The mean paroxetine peak result for each experiment tested should not differ from the mean result for any other experiment by more than 3.0%.

Table V: Overall % effect by analyst, instrument, and column on peak area over three days
Precision — Intermediate Precision Results
Intermediate precision results for analysts, instrument, and days met the acceptance criteria. These results demonstrate acceptable intermediate precision for the assay. Results are summarized in Table V and VI.

Table VI: Retention time and area values. Values are derived from the mean paroxetine values of each intermediate precision experiment
Precision — Reproducibility
Reproducibility was assessed by means of an interlaboratory trial. Analysts from two laboratories prepared and analyzed six sample assay preparations. Analysts prepared their own standards and solutions, using their own columns and systems.
Acceptance Criteria
The %RSD of both area and retention time obtained for the six preparations by both analysts should not be greater than 2.0%. The mean result for laboratory 1 should not differ from the mean result for laboratory 2 for the main peak by more than 10.0%.
Precision — Reproducibility Results
Precision reproducibility results from both laboratories meet the criteria described previously demonstrating acceptable reproducibility from the assay. Results are summarized in Table VII.

Table VII: Reproducibility results - paroxetine
Robustness
Robustness is the capacity of a method to remain unaffected by small, deliberate variations in method parameters or factors. It is a measure of reliability. The factors that are found to be most susceptible to variation should be noted in a precautionary statement in the procedure to ensure adequate controls.

Table VIII: Varied robustness factors
The factors that were monitored in the robustness study are displayed in Table VIII. An experimental one-fourthfractional factorial matrix was utilized to complete eight experiments and show the interplay of changing more than one factor at once. Effects were evaluated on peak area and retention time.
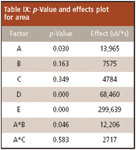
Table IX: p-Value and effects plot for area
Acceptance Criteria
The p-value allows you to accept or reject a null hypothesis. It is the probability of obtaining a result at least as extreme as a given data point, assuming the data point was the result of chance alone. In robustness, the null hypothesis indicates the effect of a factor is statistically insignificant. The null hypothesis is rejected if p-value is less than the significance. For robustness testing, one wants to accept the null hypothesis, thus, the p-value should be equal to or greater than the significance (0.05).
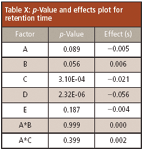
Table X: p-Value and effects plot for retention time
Robustness Results
The results for the method modifications are summarized in Tables IX and X, as well as Figures 10 and 11. The effect is the change in response due to the change of a factor. The effect value is one-half of the average response at the high level minus the average response at the low factor level. Figures 10 and 11 provide insight as to which factors caused the most change to the method. The area factors where the p-value was less than the significance were buffer strength, flow rate, injection volume, and the combination of buffer strength and temperature. For retention time, the significance factors were column temperature and flow rate. These are the factors that need to be controlled specifically. If there is a change to the method of the same magnitude as in the robustness tests then the two runs will be different statistically. Figures 10 and 11 show that flow rate has the greatest effect on changing retention time and injection volume has the greatest effect on changing peak area. A tight control of these factors would ensure the reproducibility of the method.

Figure 10: Retention time robustness results of paroxetine hydrochloride. A*B and A*C indicate the combination of factors.
Accuracy–Recovery
The four related compounds were spiked into a blank sample diluent at 50%, 100%, and 150% of the 0.1% maximum allowance relative to the 100% level of paroxetine hydrochloride. Three preparations at each level were evaluated. Paroxetine hydrochloride was analyzed at 50%, 100% and 150% of its prescribed amount (0.2 mg/mL). Percent recovery amounts were determined by quantitation against its calibration curve and comparison of the calculated amount to the expected amount.

Figure 11: Peak area robustness results of paroxetine.
Acceptance Criteria
The percent recovery value of the sample peaks were within 98–102% for paroxetine hydrochloride with a %RSD less than 2%.

Table XI: Accuracy results all compounds
Accuracy–Recovery Results
The percent recovery values are summarized in Table XI, with the individual percent recovery plot shown in Figure 12. Recovery values were within 98–102% of the expected value for paroxetine hydrochloride with a %RSD less than 2%, meeting the acceptance criteria.

Figure 12: Percent recovery plot for paroxetine.
Quantitation and Detection Limit
The limits of detection and quantification were determined using the ICH a signal-to-noise ratio approach (2). The limit of quantitation for paroxetine hydrochloride is 25 ng/mL, while the limit of detection is 10 ng/mL using UV detection. These numbers were based upon multiple injections of paroxetine hydrochloride combined standards at low-level concentrations.
Limit of detection of related compounds was determined to be 0.05% of the active pharmaceutical ingredient with the active at a concentration of 0.2 mg/mL.
Conclusion
Chromatographic methods can be developed efficiently and effectively by evaluating combinations of selectivity factors including mobile phase pH, column chemistry, and organic modifier. By using UHPLC, this comprehensive method-screening approach can be completed in just 7 h. If this approach was scaled directly to a more traditional HPLC column configuration (150-mm-long, 5-μm dp column), this same approach would take 43 h. Therefore, UHPLC can be used to develop methods over six times faster than traditional HPLC without sacrificing the quality of information.
A single, sensitive chromatographic method for paroxetine hydrochloride and its related compounds B, D, F, and G was developed and validated. This method was demonstrated to be robust, sensitive, specific, accurate, and reliable. The method and techniques presented in this paper can be used in industry to greatly increase efficiency and reliability in method development and validation. The screening protocol, optimization, and various validation tests help to ensure high-quality pharmaceuticals and medicines.
The ability to significantly improve laboratory efficiency, productivity and compliance, has been demonstrated by utilizing the combination of UHPLC and method development software. By utilizing the combined strengths of these approaches, rapid method development and validation was achieved.
Christopher J. Messina, Eric S. Grumbach, and Diane M. Diehl
Waters Corporation Milford, MA 01757-3696
Please direct correspondence to Christopher Messina at Christopher_messina@waters.com
References
(1) http://www.mentalhealth.com/drug/p30-p02.html
(2) ICH Harmonised Tripartite Guideline: Validation of Analytical Methods: Definitions and Terminology, ICH Topic Q2A.
(3) J.E. MacNair, K.C. Lewis, and J.W. Jorgenson, Anal. Chem. 1997, 69, 983–989.
(4) J.E. MacNair, K.D. Patel, and J.W. Jorgenson, Anal. Chem. 1999, 71, 700–708
(5) C. Henry, C&E News 82, 70 (2004).
(6) M.E. Swartz, LCGC Supplement, 14 (May 2005).
(7) D. Anton, J. Jerkovich, S. Mellors, and J.W. Jorgenson, LCGC 21(7), 600–610 (2003).
(8) The United States Pharmacopeia 26 / National Formulary 21 (The United States Pharmacopoeia Convention, Inc., Rockville, MD, 2002), Chapter <621>.
(9) U.D. Neue, HPLC Columns (Wiley-VCH, New York, 1997).
(10) L. Snyder, J.J. Kirkland, and J. Glajch, Practical HPLC Method Development, 2nd ed. (John Wiley & Sons, New York, 1997), p. 239.
(11) M.E. Swartz and I.S. Krull, Handbook of Analytical Method Validation (Taylor and Francis) in press.
(12) AAPS PhamSci Tech 2004, 5(1) Article 22 (http://www.aapsparmscitech.org).
(13) The United States Pharmacopeia 29 / National Formulary 24 (The United States Pharmacopeia Convention, Inc., Rockville, MD, 2006), Chapter <1225>, including Supplement 1, Official April 2006.
(14) International conference on Harmonization, Harmonized Tripartite Guideline, Validation of Analytical Procedures, Text and Methodology, Q2(R1), November 2005, See www.ICH.org.
(15) Draft Guidance for Industry: Analytical Procedures and Methods Validation. U.S. Department of Research, Center for Biologics Division of Research, Rockville, Maryland, August 2000).
(16) R. Brown, M. Caphart, P. Faustino, R. Frankewich, J. Gibbs, E. Leutzinger, G. Lunn, L. Ng, R. Rajagopalan, Y. Chiu, and E. Sheinin, LCGC 19(1), 74–79 (2001).
(17) General principles of software validation; final guidance for industry and FDA staff. U.S. Department of Health and Human Services, Food and Drug Administration, Center for Drug Evaluation and Research, Center for Biologics Division of Research, Rockville, MD, January 2002.
(18) Pharmacopeial Forum 31(5), 1453–1463 (Sept-Oct 2005).
University of Tasmania Researchers Explore Haloacetic Acid Determiniation in Water with capLC–MS
April 29th 2025Haloacetic acid detection has become important when analyzing drinking and swimming pool water. University of Tasmania researchers have begun applying capillary liquid chromatography as a means of detecting these substances.
Prioritizing Non-Target Screening in LC–HRMS Environmental Sample Analysis
April 28th 2025When analyzing samples using liquid chromatography–high-resolution mass spectrometry, there are various ways the processes can be improved. Researchers created new methods for prioritizing these strategies.

.png&w=3840&q=75)

.png&w=3840&q=75)


.png&w=3840&q=75)


.png&w=3840&q=75)


