Quantitative Proteomics: Available Tools and Results of Collaborative Study
LCGC North America
Quantitative assessment of protein expression in biological systems in response to perturbations is an important element in the discovery and validation of biomarkers and drug targets. This can be a challenging task given the complexity and dynamic range of biological extracts. Many methods are currently in use to address protein quantification. This installment of "Directions in Discovery" reviews several of the more popular ones and reports on a collaborative study organized by the Association of Biomolecular Resource Facilities.
An important pathway to drug discovery is the identification of proteins whose expression is differentially regulated in a particular metabolic state. Determination of protein abundance in response to perturbations such as disease or therapeutic intervention requires measuring quantitative levels of proteins in complex mixtures such as biological fluids or tissue extracts. To be useful and reliable, quantitative methods must be both sensitive and accurate, and return reproducible results in replicate assays. A variety of quantitative methods have been developed for expression proteomics, and the performance of several of them have been assessed in an interlaboratory study organized by the Association of Biomolecular Resource Facilities (ABRF) late last year. This installment of "Directions in Discovery" will review these methods and summarize the findings of the ABRF Proteomics Research Group study on advanced quantitative proteomics (PRG 2007).

Approaches to Quantitative Proteomics
Quantitative proteomic methods can be classed into three general types: gel-based methods, stable isotope-labeling methods, and label-free methods. Some of these are performed at the protein level (for example, gel-based methods) while most are performed at the peptide level after protein extraction and fractionation followed by proteolysis. The methods differ in the degree to which they can be automated, from largely manual methods (for example, gel electrophoresis) all the way to fully automated approaches (for example, label-free quantification using multidimensional liquid chromatography [LC]-tandem mass spectrometry [MS] analysis). All use MS or tandem MS to identify the species being quantified.
Gel-Based Quantification
Before the development of modern MS instrumentation, gel electrophoresis was the primary technique for analysis of proteins in complex mixtures, and is still used as a quantitative tool in many laboratories. Two-dimensional gel electrophoresis (2D-GE) can resolve hundreds to thousands of proteins (1), and image analysis and densitometry of stained gels can yield information on the quantity of individual species. However, 2D-GE has several limitations. The technique is time-consuming, labor-intensive, and dependent upon the expertise of the operator. Certain classes of proteins behave poorly in 2D-GE, such as very small and very large proteins, hydrophobic proteins, and very acidic or basic species. Successful quantification is limited by nonlinear staining response, gel-to-gel reproducibility, interference from high-abundance proteins, and poor resolution of the protein of interest from neighboring spots. One advantage of 2D-GE is that proteins carrying posttranslational modifications that alter protein charge (such as phosphorylation) are readily observed as lateral trains of spots. Thus, up- or down-regulation of specific isoforms or their interconversion is recognized easily.

Tim Wehr
The problem of gel-to-gel reproducibility can be minimized greatly by using differential gel electrophoresis (DIGE). In this technique, samples to be compared (for example, control and two experimental samples) are labeled with three different fluorescent cyanine dyes (2,3). The dyes (Cy2, Cy3, and Cy5) carry an amine-specific reactive group that forms a covalent amide bond with lysine side chains. The dyes are positively charged to conserve the charge of the tagged proteins and so minimize changes in the isoelectric focusing (IEF) dimension, and have similar masses to minimize differences in the sodium dodecyl sulfate–polyacrylamide gel electrophoresis (SDS-PAGE) mobility of tagged proteins across sample sets. The three dyes have distinct fluorescence properties such that two or more differentially-tagged samples can be pooled and detected simultaneously on a single gel. Cyanine fluorescence sensitivity is higher than Coomassie staining, but somewhat less than silver staining. A major advantage for quantitative analysis is the linearity of fluorescence response over four orders of magnitude. Limitations of DIGE include significant mobility shifts for low Mr tagged proteins (which can make it difficult to locate the untagged protein on preparative gels), the cost of the DIGE reagents, and the cost of the precast gels (which are cast on glass with low fluorescence background).
Stable Isotope Labeling Methods for Quantification
A host of stable isotope labeling methods for proteomics have been described (4,5), all of which rely upon the same principle. Proteins or their derived peptides from an experimental sample are labeled with one or more stable isotopes, pooled with an unlabeled control sample, and proteolytic digests are analyzed by LC-tandem MS. The signature mass difference between labeled and unlabeled species serves to identify the mass-tagged polypeptide and its cognate unlabeled control, while the MS signal intensities of the differentially labeled peptide pair are used to determine their relative abundance. The various stable isotope labeling methods can be grouped in three categories: metabolic stable isotope labeling, introduction of mass or isotope tags by chemical reaction, and introduction of stable isotopes by enzymatic reaction.
Metabolic Stable Isotope Labeling
With this technique, developed by the Mann laboratory and termed stable istope labeling by amino acids in cell culture (SILAC) (6,7), the cell proteome is labeled by in vivo incorporation of one or more isotope-labeled essential amino acids during growth (Figure 1). Experimental cells are cultured in a defined medium supplemented with a labeled amino acid (for example, arginine containing 13C or 15N), while control cells are grown in a medium containing natural amino acids. After a growth period sufficient to label the proteome fully (typically five or more generations), experimental and control cells are harvested, pooled, and the extracted proteins digested and analyzed by LC-tandem MS. The SILAC approach minimizes the number of manipulations that need to be performed after harvest, and, using 13C-labeled amino acids as precursors, yields labeled and unlabeled peptides that are coeluted chromatographically. Of course, the technique is limited to studies in which cells can be grown in culture and can incorporate the exogenous amino acid into protein.
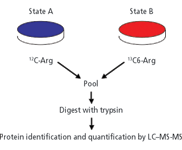
Figure 1: Schematic of the SILAC experiment. Adapted from reference 6 with permission from the American Chemical Society.
Stable Isotope or Mass Tagging Via Chemical Reaction
Introduction of a mass or stable isotope tag after protein digestion allows for reaction with a specific peptide functionality, while introduction of affinity groups in the reagent enables enrichment of peptides containing a particular amino acid.
Stable isotope tagging by acetylation of N-terminal amines and the ε-amino group of lysine with N-acetoxysuccinimide or N-acetoxy [2 H3]succinimide (8) is termed the global internal standard technique (GIST). Another approach termed mass-coded abundance tagging (MCAT) (9) employs guanidination of lysine side chain amino groups with O-methylisourea. In this approach, labeled and unlabeled peptide pairs are readily identified by a signature mass difference of 42 amu.
A family of stable isotopically-labeled mass tags specifically developed for tandem MS-base quantification and currently used widely in proteomics are the iTRAQ (Isobaric Tag for Relative and Absolute Quantification, Applied Biosystems, Foster City, California) reagents (10). These reagents are composed of three moieties (Figure 2). An amine-specific peptide reactive group reacts with N-terminal and side-chain lysine amino groups to covalently attach the tag to each peptide. A reporter group contains one or more stable isotopes to form a family of four different tagged reagents differing by 1–4 mass units. These two groups bracket a balance group that also carries stable isotopes. The four reagents contain complimentary combinations of reporter and balance group masses so that all four iTRAQ reagents are isobaric. Because the only difference in the four reagents is substitution with 13C, 14N, or 18 O isotopes, a peptide tagged with any of the four has the same chromatographic properties. In tandem MS, the iTRAQ reagent fragments to release the reporter ion, and quantitative information is provided by the intensity of the reporter ion signal. Relative quantification can thus be performed by multiplexing up to four experimental samples, while absolute quantification can be performed by using an internal standard peptide labeled with one iTRAQ reagent. A limitation of the iTRAQ system is that the reporter ion masses are below the low-mass cutoff of ion-trap mass spectrometers. At least one ion trap vendor has recently introduced software that provides collision-induced dissociation (CID) conditions for detection of the iTRAQ ions.
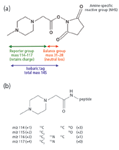
Figure 2: Structure and use of the iTRAQ reagents. (a) The iTRAQ reagent; (b) peptide-iTRAQ reaction product. Adapted from reference 10 with permission from the American Chemical Society.
The first widely used affinity-based stable isotope tag, developed by the Aebersold group (11) and termed ICAT (isotope-coded affinity tag), introduces an affinity group on cysteinyl residues (Figure 3). The reagent consists of a sulfhydryl-reactive iodoacetate group, a biotin affinity group, and a linker carrying multiple light or heavy isotopes (2H8 in the first version, 13C9 in a more recent version). Following the reaction to derivatize cysteine residues, control (light) and experimental (heavy) protein samples are pooled, digested with trypsin, and peptides with tagged cysteinyl groups are captured on a monomeric avidin affinity column, then eluted for LC-tandem MS analysis. The ICAT reagent has been improved with the introduction of an acid-cleavable site in the linker (12). This enables the biotin to be removed from captured peptides before LC–MS analysis. This eliminated complications arising from fragmentation of biotin in the MS-MS spectra.
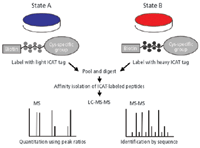
Figure 3: Schematic of the ICAT experiment. Adapted from reference 11 with permission from the Nature Publishing Group.
Some of the limitations of the ICAT procedure have been minimized using a cysteine-specific group attached to beads using a photocleavable linker with light or heavy isotope tags (13). In contrast to the original ICAT method, in which the affinity group and isotope tag are attached to proteins, this solid-phase technique captures and labels cysteine-containing peptides after proteolysis. The solid-phase method has been shown to identify a greater number of proteins than the ICAT method.
Specific affinity capture of cysteine-containing peptides from a complex protein mixture is both an advantage and a limitation in proteomic analysis. Affinity capture greatly minimizes the complexity of the sample without seriously compromising the information yield of the experiment. This is because the majority of proteins contain cysteine (91.6% of the yeast proteome, for example) while only a small fraction of the derived tryptic peptides (9.4% in yeast) contain this amino acid (14). However, it is still possible that biologically relevant proteins in a proteomic study that do not contain cysteine will be missed by the affinity capture step.
Stable Isotope Labeling by Enzyme Reaction
Enzyme-catalyzed labeling of peptides using stable isotopes provides a method for global labeling of proteomes for quantitative comparison. Proteolytic cleavage of a protein by trypsin, Lys-C, Glu-C, or chymotrypsin in the presence of highly enriched H218O results in the incorporation of two 18O atoms in the carboxy terminus for each peptide product (15–17). If a control digest of the same protein is performed in unlabeled H2O and the experimental and control are pooled, MS spectra exhibit paired peaks for each peptide separated by 4 amu. The intensities of the labeled and unlabeled peptide pairs provide quantitative information. In MS-MS spectra, only the y ions will conserve the heavy label and appear as doublets. This simplifies spectral interpretation and sequence assignments. The stability of the 18O–C bond prevents back-exchange of 18O with H216O during chromatographic separation and ionization. Because the labeled and unlabeled peptides are chemically indistinguishable, they are coeluted in chromatography. It has been demonstrated that catalytic labeling can occur independent of cleavage, allowing labeling to be performed following proteolysis.
Label-Free Quantification
Label-free protein quantification methods are based upon a correlation between peptide mass spectral peak data and the abundance of the protein in the sample (18). Two approaches have been used for label-free quantification. In one approach, mass spectral peak intensities of peptide ions are used to measure protein amount. In the other approach, termed spectral counting, the number of MS-MS spectra assigned to a protein is used as a measure of protein abundance. Label-free methods are desirable in cases in which metabolic labeling is not possible or in which introducing stable isotopes by chemical derivatization is too cumbersome.
For quantification based upon MS peak intensity, an extracted ion chromatogram is generated for each peptide of a given protein for peak area calculation. The method requires at least one peptide in common for a pair of samples, and reproducible quantification requires detection of three or more peptides in common per protein. Linearity over 1000-fold has been demonstrated.
In spectral counting quantification, all MS-MS observations for any peptide in a given protein are summed. The method requires detection of at least one spectrum in either sample pair, and accurate quantification requires four or more spectra per protein. As spectral counts increase above ~30, protein ratios that can be reliably measured decrease.
A comparison of the two methods yielded similar results and agreed with an independent method (gel electrophoresis with Coomassie staining). Spectral counting proved more sensitive for detecting changes in abundance, while peak intensity measurement provided more accurate estimates of protein ratios. An advantage of spectral counting is that peptides in common between data sets are not required for protein ratio determination.
Targeted Protein Quantification Using SRM
Once a protein of interest has been identified using one of the techniques described previously, accurate and precise quantification can be accomplished using single reaction monitoring (SRM) in a tandem MS instrument (19). Triple-quadrupole MS systems are often the instruments of choice for SRM because of their stability and wide dynamic range. In this approach, the peptide to be used for quantification of the analyte protein is selected in the first quadrupole, fragmented in the collision cell, and a particular fragment isolated in the third quadrupole for detection. Detection at the MS-MS level is performed to take advantage of the increased signal-to-noise and the high specificity of detection. For optimal quantification, the candidate peptide should display several characteristics. It should be unique to the parent analyte protein, it should generate one or more fragments with good signal intensity, it should contain no residues with labile groups, and should not contain posttranslational modifications. After a candidate peptide has been identified, a synthetic version labeled with stable isotopes can be used as an internal standard for absolute quantification. Because the elution time of each peptide and its cognate internal standard is known, multiple analyte proteins can be quantified in one LC–MS-MS experiment using time-programmed multiple reaction monitoring (scheduled MRM).
The ABRF PRG 2007 Study
Each year, the Proteomics Research Group (PRG) of the ABRF provides its members with an opportunity to assess their analytical capabilities with a set of test samples. Previous PRG studies have addressed problems in protein identification, differentiation of protein isoforms, determination of phosphorylation sites, and de novo peptide sequencing. The 2007 study was designed to evaluate proficiency in identifying and quantifying proteins in a complex mixture (20).
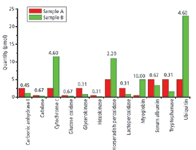
Figure 4: Components of the PRG 2007 Quantitative Proteomics sample.
The PRG 2007 sample set was designed to be representative of actual samples submitted to core facility laboratories. It consisted of three tubes (A, B, and C); each tube contained the same complex mixture of background proteins and was spiked with 12 proteins at different levels and different ratios. Participants were asked to identify the spiked proteins and to determine the relative amounts in each sample. The components of tubes A and B are shown in Figure 4 (tubes B and C were duplicates). The background proteins (E. coli lysate proteins) were present at the same amount in each tube, and the total amount of protein (background + spike proteins) was the same in all tubes.
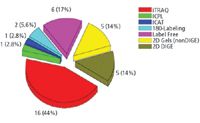
Figure 5: Quantitative methods used by participants in the PRG 2007 study. Abbreviations: iTRAC, isobaric tag for relative and absolute quantitation; ICPL, isotope coded protein label; ICAT, isotope coded affinity tag, DIGE, differential gel electrophoresis.
Of the 87 laboratories that requested samples, 43 participated in the study, and 35 labs returned quantitative data. Of these 35 labs, 26 used MS-based quantitative methods, while nine used gel-based methods (Figure 5). The study results for protein identification are presented in Figure 6, grouped according to methodology. For each participant, the number of proteins identified correctly is shown in the top panel and the number of proteins identified incorrectly is shown in the bottom panel.
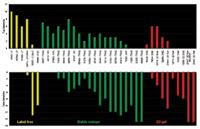
Figure 6: Results of the PRG 2007 study: true positives vs. false positives.
Quantitative results for a high-abundance spiked protein (ubiquitin) and a low-abundance spiked protein (carbonic anhydrase) are shown in Figures 7 and 8, respectively. The expected sample B:A ratio for ubiquitin was 23:5 pmol, or 4.6. The expected sample B:A ratio for carbonic anhydrase was 1.14:2.50 pmol, or 0.45.
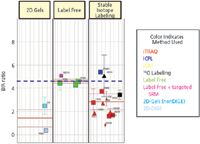
Figure 7: Results of the PRG 2007 study: true positives vs. false positives.
In the summary report of the PRG 2007 study (20), the authors conclude that quantitative proteomics experiments are complex and require many factors for success. The fact that some of the participants reported excellent results indicates that quantitative results are achievable. However, the variation in performance of participants using similar techniques indicates that expertise is a key factor in success, and therefore, direct comparison of different methods is not yet possible.
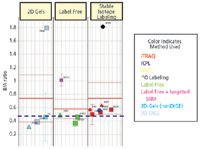
Figure 8: Quantitative results for ubiquitin. Key to symbols: size indicates level of experience (small = limited experience, large = extensive experience), shape indicates level of confidence (square = high, triangle = medium, circle = low).
Acknowledgments
The author would like to thank the Association of Biomolecular Resource Facilities for providing Figures 4–8.
Tim Wehr
"Directions in Discovery" editor Tim Wehr is staff scientist at Bio-Rad Laboratories, Hercules, California. Direct correspondence about this column to Direct correspondence about this column to "Directions in Discovery," LCGC, Woodbridge Corporate Plaza, 485 Route 1 South, Building F, First Floor, Iselin, NJ 08830, e-mail lcgcedit@lcgcmag.com
References
(1) P.H. O'Farrell, J. Biol. Chem. 250, 4007–4021 (1975).
(2) M. Unlu, M.E. Morgan, and J.S. Minden, Electrophoresis 18, 2071–2077 (1997).
(3) R. Tonge, J. Shaw, B. Middleton, R. Rowlinson, S. Rayner, J. Young, F. Pognan, E. Hawkins, I. Currie, and M. Davison, Proteomics 1, 377–396 (2001).
(4) S. Julka and F. Regnier, J. Proteome Res. 3, 350–363 (2004).
(5) S. Pan and R. Aebersold, Methods. Mol. Biol. 367, 209–218 (2007).
(6) S.E. Ong, I. Kratchmarova, and M. Mann, J. Proteome Res. 2, 173–181 (2003).
(7) B. Blagoev, S.E. Ong, I. Karchmarova, and M. Mann, Nature Biotech. 22, 1139–1145 (2004).
(8) A. Chakroborty and F.E. Regnier, J. Chromatogr. A 949, 173–184 (2002).
(9) G. Cagney and A. Emili, Nature Biotech. 20, 163–170 (2002).
(10) P.L. Ross, Y.N. Huang, J.N. Marchese, B. Williamson, K. Parker, S. Hattan, N. Khainovski, S. Pillai, S. Dey, S. Daniels, S. Purkayastha, P. Juhasz, S. Martin, M. Bartlet-Jones, F. He, A. Jacobson, and D.J. Pappin, Mol. Cell. Proteomics 3, 1154–1169 (2004).
(11) S.P. Gygi, B. Rist, S.A. Gerber, F. Turecek, M.H. Gelb, and R. Aebersold, Nat. Biotechnol. 17, 994–999 (1999).
(12) Y. Oda, T. Owa, T. Sato, B. Boucher, S. Daniels, H. Yamanaka, Y. Shinohara, A. Yokoi, J. Kuromitsu, and T. Nagasu, Anal. Chem. 75, 2159–2165 (2003).
(13) H. Zhou, J.A. Ranish, J.D. Watts, and R. Aebersold, Nature Biotechnol. 20, 512–515 (2002).
(14) S. Wang, X. Zhang, and F.E. Regnier, J. Chromatogr. A 949, 153–162 (2002).
(15) X. Yao, A. Freas, J. Ramirez, P.A. Demirev, and C. Fenselau, Anal. Chem. 73, 2836–2842 (2001).
(16) K.J. Reynolds, X. Yao, and C. Fenselau, J. Proteome Res. 1, 27–33 (2002).
(17) X. Yao, C. Afonso, and C. Fenselau, J. Proteome Res. 2, 147–152 (2003).
(18) W.M. Old, K. Meyer-Arendt, L. Aveline-Wolf, K.G. Pierce, A. Mendoza, J.R. Sevinsky, K.A. Resing, and N.G. Ahn, Mol. Cell. Proteomics 4, 1487–1502 (2005).
(19) T.D. Veenstra, J. Chromatogr. B 847, 3–11 (2007).
(20) A.M. Falik, M.J. MacCoss, W.S. Lane, K.S. Lilley, B.S. Phinney, N.E. Sherman, S.T. Weintraub, H.E. Witkowska, and N.A. Yates, "ABRF-PRG 2007: Advanced Proteomics Study," Poster TP 359, 55th ASMS Conference on Mass Spectrometry and Allied Topics, Indianapolis, 2007.
Understanding FDA Recommendations for N-Nitrosamine Impurity Levels
April 17th 2025We spoke with Josh Hoerner, general manager of Purisys, which specializes in a small volume custom synthesis and specialized controlled substance manufacturing, to gain his perspective on FDA’s recommendations for acceptable intake limits for N-nitrosamine impurities.


