Molecular Weight Analysis of Glatiramer Acetate and Related Compounds by Size-Exclusion Chromatography with Multi-Angle Light Scattering Detection (SEC-MALS)
LCGC North America
A method was developed for the molecular weight characterization of heterogeneous polymer mixtures, such as heparins and glatiramer acetate, noting that single molecular structures are not adequate for creating a molecular weight calibration curve. That limitation is overcome in this work, which demonstrates method validation and application to process samples.
The molecular weight characterization of heterogeneous polymer mixtures is complicated by the fact the molecular weight standards are often not available, or not appropriate, for a specific polymer. In cases such as heparins and glatiramer acetate, single molecular structures are not adequate for creating a molecular weight calibration curve. This work reports on the use of size-exclusion chromatography with multi-angle light scattering detection (SEC-MALS) for the accurate determination of molecular weight and distribution for the polypeptide mixture glatiramer acetate and higher molecular weight precursors. Method development is described, along with the analysis of multiple samples to demonstrate method validation and application to process samples.
Glatiramer acetate (Copaxone, Teva Pharmaceutical Industries) is approved for the treatment of relapsing forms of multiple sclerosis (MS). Recently a generic version of glatiramer acetate (Glatopa, Sandoz) was approved in the United States by the Food and Drug Administration, relying on significant analytical and bioanalytical data to demonstrate equivalence (1). One of the critical parameters used to demonstrate equivalence was the molecular weight distribution of glatiramer acetate, which is a critical attribute to ensure its safety and efficacy. Due to the complexity of the mixture of polypeptides in both molecular size and sequence, a simple size-exclusion analysis of glatiramer acetate using traditional columns and standards does not provide an accurate assessment of the average molecular weight or the molecular weight distribution. In addition, the need to monitor the molecular weight during the process of polymerization and subsequent depolymerization to produce the final product required a method that could be generally applied without the use of standards. This paper describes the development of a method that uses size-exclusion chromatography with multi-angle light scattering detection (SEC-MALS) (2) and the application to the analyses of final product and in-process samples. The application of the method for comparison of Copaxone and Glatopa samples and determination of equivalence is described. In addition, a second related SEC-MALS method was developed and used to monitor early, high molecular-weight intermediates synthesized in the process.
Methods and Materials
Copaxone was purchased through drug wholesalers as syringes containing 20 mg/mL glatiramaer acetate in a solution containing 40 mg/mL of mannitol in water. The material was either analyzed directly or demannitolized (removing the mannitol added to produce the drug product) to produce glatiramer acetate as a dry powder. Glatopa was manufactured by Momenta Pharmaceuticals and analyzed as either the drug substance glatiramer acetate or the drug product solution which contained 40 mg/mL of mannitol in water. The high molecular weight (HMW) intermediates were obtained from samples during the manufacture of the glatiramer acetate drug substance.
High performance liquid chromatography (HPLC) data were collected on an Agilent 1100 liquid chromatograph equipped with an OptiLab refractive index (RI) detector (Wyatt Technology) and MiniDawn Tristar or 18-angle Heleos light scattering detector (Wyatt Technology). Two Tosoh (Tosoh Biosciences) size-exclusion columns were used for the analysis of the glatiramer acetate–TSKgel G3000swxl (7.8 x 300 mm, 5-µm), and TSKgel G2000swxl (7.8 x 300 mm, 5-µm) along with a TSKgel SWx1 guard column (6 x 40 mm). An isocratic mobile phase of 0.1 M sodium phosphate and 0.15 M sodium chloride (pH 3.5), at a flow rate 0.5 mL/min was employed for the separation at an ambient column temperature. An injection volume of 10 µL was employed. Data were processed using both Empower 2 software (Waters) and Astra software (Wyatt Technology).
The analysis of HMW precursors used two HFIPgel (7.5 x 300 mm) columns (Agilent Polymer Labs) with an HFIPgel guard column (7.5 x 50 mm). Data were collected using a Shimadzu LC-20AD instrument with a Waters 717 plus autosampler and an OptiLab refractive index detector (Wyatt Technology) and MiniDawn TREOS light scattering detector (Wyatt Technology). The mobile phase was isocratic of hexafluoroisopropanol (HFIP) containing 0.01 M tetraethylammonium nitrate (TEAN) modifier, using a flow rate of 0.8 mL/min and a column temperature of 40 °C. A 200 µL injection volume was used for the samples. Data were processed using Astra software (Wyatt Technology).
Results and Discussion
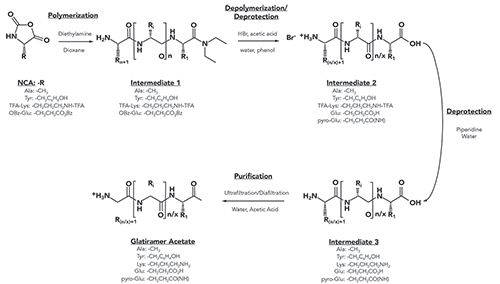
Glatiramer acetate is a complex mixture of synthetic polypeptides with a range of molecular weights (MW) and sequences. It is manufactured by a copolymerization of four amino acids (L-glutamic acid, L-alanine, L-lysine, and L-tyrosine) in a specific molar ratio. The overall process, depicted in Figure 1, results in HMW intermediates which are subsequently depolymerized and purified to result in the final product. The final product is a polymer mixture with an average molecular weight of approximately 10 kDa, but a range of from 2.5 to >20 kDa. To properly evaluate the molecular weight and distribution parameters, SEC can be employed as with most polymeric mixtures.
Figure 1: Overview of the synthesis of glatiramer acetate.
Initial SEC Analysis
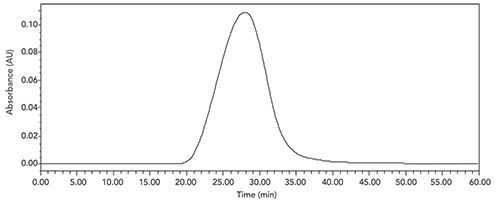
An initial attempt to measure the molecular weight and distribution was done using a Superose 12 10/300 GL (GE Healthcare) SEC column (300 Å pore size), 0.2 M ammonium acetate (pH 5.0) and ultraviolet (UV) detection at 275 nm. This column is designed for molecular weight separation from 1000 to 300,000 Da,and resulted in an acceptable profile as shown in Figure 2.
Figure 2: SEC-UV for glatiramer acetate on Superose 12 10/300 GL SEC column.
However, to accurately measure the average molecular weight and distribution, a series of seven protein standards ranging from insulin (3500 Da) to ferritin (440,000 Da) was run on the same column, and the average molecular weight was estimated to be approximately 50,000 (much higher for glatiramer acetate than was known from other methods). This was most likely due to the fact that the standard proteins were globular whereas glatiramer acetate is believed to be much more like an alpha-helix-type rod, which would appear in size-exclusion to be larger (in molecular weight) than it actually is due to its hydrodynamic radius in solution.
Another approach would be to create standards that are like glatiramer acetate over the range of the molecular weights examined (2.5 kDa to 25 kDa). However, this proved to be impossible, since every molecular weight standard would be a discrete, singular sequence, whereas in the mixture of polypeptides in glatiramer acetate, each molecular weight could contain different sequences of the four amino acids and thus different molecular sizes. Therefore, it is possible for two polypeptides of the same molecular weight to be eluted at different times because of different molecular sizes.
Overview of SEC-MALS
An alternate approach to determine the average molecular weight and distribution is the use of a combination of light-scattering and concentration detectors after the size-exclusion separation (2). This approach, commonly known as SEC-MALS or SEC-MALS-RI relies on the fact that the intensity of the scattered light in a MALS detector is proportional to the molecular weight as follows:

[1]
Where I(Ï´)scattered is the intensity of the scattered light at any point in the chromatogram; M is the molecular weight at that point in the chromatogram; c is the concentration at that point in the chromatogram (measured by any concentration sensitive detector such as RI or UV; dn/dc is a constant which is the change in refractive index as a function of concentration; and dn/dc is a quantity which must be determined for each system and is dependent on the sample and mobile phase used for the separation.
In addition to the chromatogram showing the molecular weight distribution, various molecular weight parameters can also be calculated from the entire curve. The molecular weight moments can be used to quantitatively compare different samples of the polymer.
The most obvious one is Mp, which is the molecular weight at the peak of the distribution. In addition, three other parameters can be calculated:
[2]

[3]

[4]

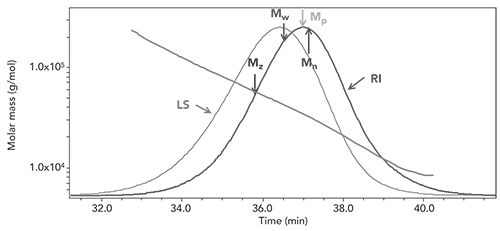
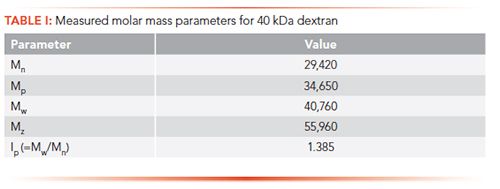
where ni is the number of molecules with molar mass Mi (g/mol), and ci is the weight concentration of molecules with molar mass Mi (as determined by the refractive index detector). Figure 3 shows an example of this for a sample of dextran with a known molecular weight of approximately 40 kDa. In this case, the measured parameters are shown in Table I, along with a calculation of polydispersity (Ip = Mw/Mn)
Figure 3: Molecular weight distribution for 40 kDa dextran as molar mass vs. time.
Application to Glatiramer Acetate
For the analysis of glatiramer acetate polypeptide samples and related in-process materials, a variety of columns and mobile phases were examined to obtain the best separation. In some systems, the retention of the sample was too short (indicating total exclusion of part of the material); in some systems, retention was too long (indicating either non-specific adsorption or other long-retention mechanisms) for part of the sample. The final separation used a combination of two size exclusion columns-TSKgel G3000swxl (7.8 x 300 mm, 5-µm), and TSKgel G2000swxl (7.8 x 300 mm, 5-µm)-and an isocratic mobile phase of 0.1 M sodium phosphate with 0.15 M sodium chloride (pH 3.5). A representative chromatogram of the final separation is shown in Figure 4.
Figure 4: Representative SEC-MALS-RI of glatiramer acetate sample as molar mass vs. time.
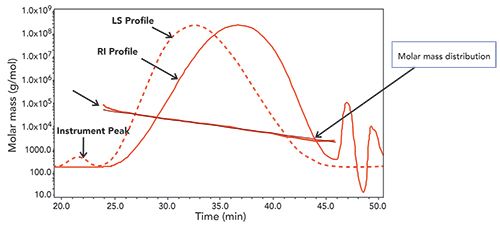
It should be noted that the light scattering profile is the dotted line, the refractive index profile is the solid line, and the almost horizontal line is the molar mass (molecular weight) calculated for each point across the chromatogram.
To achieve an accurate value of molecular weight for each point in the chromatogram according to Equation 1, the value of dn/dc needed to be determined. This value was determined by making duplicate measurements from two different samples of glatiramer acetate, measuring the refractive index of serially diluted samples from a known concentration stock solution. The dn/dc value is the slope of the line of refractive index vs. concentration. For this SEC mobile phase and glatiramer acetate, a value of 0.197 was determined. It is interesting to note that, for most proteins, the typical value is close to 0.185. While it is not completely known why this value would be higher, it may be due to the relatively high proportions of both lysine and tyrosine in glatiramer acetate.
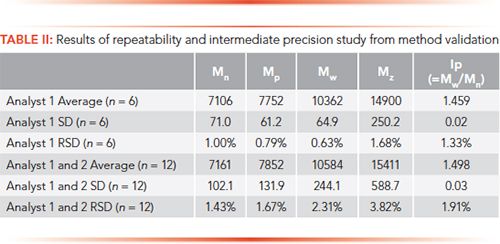
A complete validation of the method was performed for application to glatiramer acetate solutions of both drug substance and drug product (the latter contains mannitol as an excipient). The method was shown to be specific and also stability-indicating, as small changes in the distribution induced by stress conditions produced observable and quantitative differences in many of the parameters, especially Mz and polydispersity (Ip). Linearity is not appropriate for this method, since it is not determining concentration by molecular weight and distribution. Nonetheless, the acceptable range for the method was determined to be from 5 mg/mL to 15 mg/mL sample concentrations (±50% of the nominal 10 mg/mL sample concentration). Results for the repeatability (one analyst, six injections) and intermediate precision (2 analysts, 12 injections) are shown in Table II.
Once the method had been developed and validated, it was necessary to analyze multiple samples of glatiramer acetate produced at commercial scale to properly define the molecular weight parameters to monitor, in addition to the obvious Mp, which is only a measurement of the molecular weight at the peak of the chromatogram and does not contain any distribution information. A summary of this analysis is provided in Table III for 42 lots of commercial glatiramer acetate.
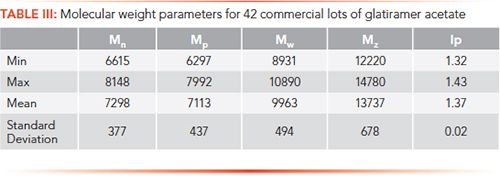
The data in Table III show that, although all of these lots were produced by the same process, there was some diversity among the lots in all molecular weight parameters, which is important to understand when trying to control the process over time.
Application to Process Depolymerization Monitoring
Although the primary use for the method was to evaluate the final product of the synthesis, it was also useful to monitor the distribution after the depolymerization step but prior to final ultrafiltration/diafiltration, which removes some reactants and small molecular weight peptides. An example of this is shown in Figure 5, where the red curve shows the molecular weight distribution prior to filtration and the blue curve shows the distribution after filtration.
Figure 5: Comparison of pre-and post-filtration solutions. The intermediate-3 solution is shown as red solid line, and the glatiramer acetate solution is shown as the blue solid line.
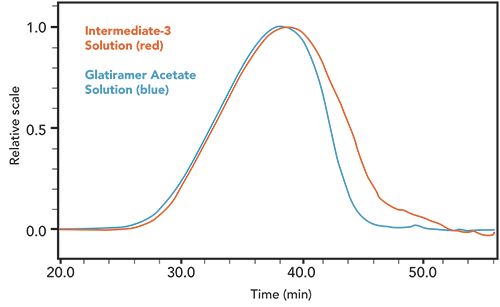
An examination of the calculated parameters in Table IV showed a very slight change in Mp, Mw, and Mz, but a significant change in both Mn and Ip, indicative of the removal of a portion of small molecular weight peptides.

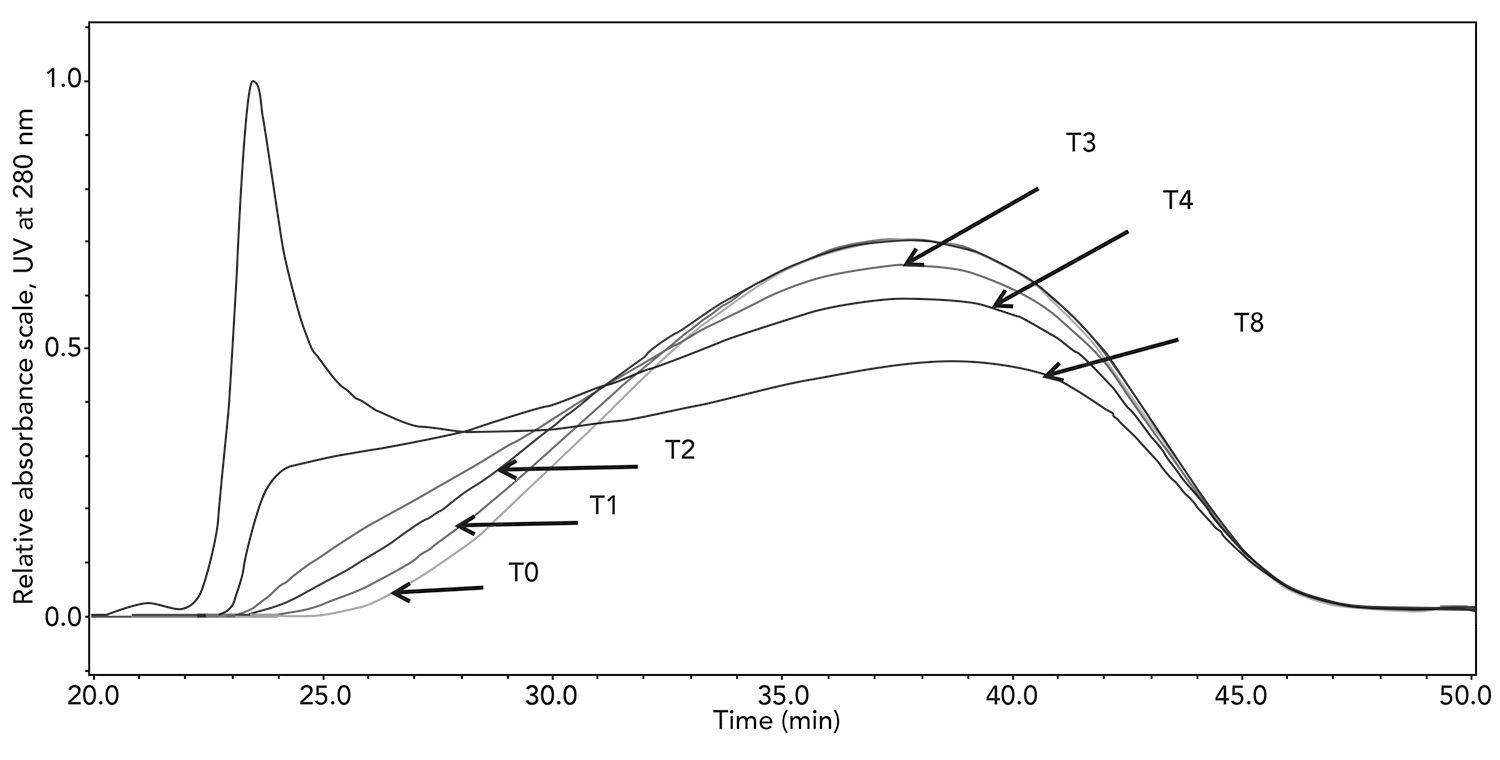
In addition to analysis of in-process and final samples, the method also has the ability to monitor changes in molecular weight distribution over time. When stored properly, glatiramer acetate is stable for many years. However, it is possible to generate higher molecular weight species when heating the material above 70 °C for a period of up to 8 ds. The molecular weight distributions are shown in Figure 6, where, after a few days, much of the distribution elutes at the totally excluded volume of the column (see T4 and T8). Even though the curve shifted only slightly from T0 to T1, the Mz value significantly changed from 14,660 to 18,530.
Figure 6: Molecular weight distribution of glatiramer acetate sample heated for up to 8 d.
Application to Synthesis of Intermediate-1
The first step in the process to manufacture glatiramer acetate (Figure 1) is to create a high molecular weight intermediate-1 through a polymerization reaction. SEC-MALS can also be used to monitor the progress and extent of this polymerization reaction. However, due to the insolubility of the high molecular weight polymer in aqueous solutions, an alternative separation mobile phase and system needed to be applied. The use of hexafluoroisopropanol (HFIP) as a solvent using a specialty polymer column (HFIPgel, Polymer Labs) is established in the field of polymer analysis (3). Due to the change in column and mobile phase, the dn/dc value for the polymer needed to be measured and it was determined to be 0.1915 mL/g.
An example chromatogram of the analysis of an intermediate-1 during process development is shown in Figure 7.
Figure 7: EC-MALS of final intermediate-1 sample. Duplicate injections (red and blue lines) of differential refractive index (dashed line) and 90° light scattering chromatograms
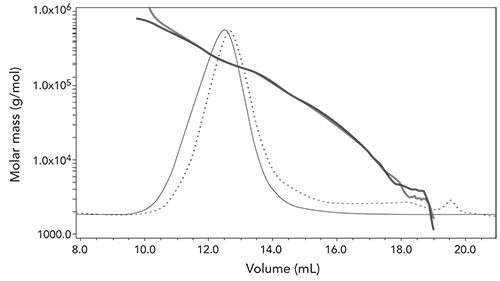
The results in Figure 7 show good reproducibility of duplicate injections, and the solid blue and red diagonal lines correspond to the Mw at each point in the chromatogram. In this case, the intermediate-1 has an Mw of 213K, an Mn of 156.2K and a polydispersity (Ip) of 1.36.
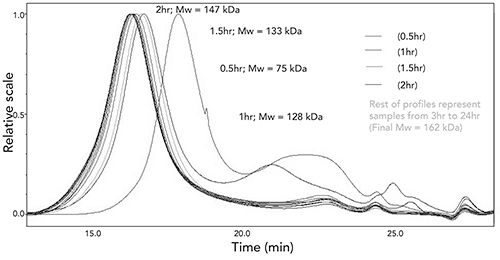
Finally, the SEC-MALS analysis using HFIP and HFIPgel column can be used to monitor the progress of the polymerization reaction and determine when the reaction has been completed. An example of this is shown in Figure 8.
Figure 8: Time analysis of polymerization reaction to produce intermediate-1.
Conclusions
A method has been developed and validated for the quantitative analysis of molecular weight and distribution of glatiramer acetate and related compounds using SEC-MALS. The method overcomes the need for calibration standards, which are not readily available, and has proven useful in the development and validation of a manufacturing process to produce glatiramer acetate. A second method has also been developed for the analysis of high molecular weight intermediate samples produced during the polymerization reaction. Both methods are useful for final product analysis as well as in-process monitoring.
Acknowledgments
Momenta Pharmaceuticals, Inc. funded the research mentioned in this article.
References
- J. Anderson, C. Bell, J. Bishop. I. Capila, T. Ganguly, J. Glajch, M. Iyer, G. Kaundinya, J. Lansing, J. Pradines, J. Prescott, B. Cohen, D. Kantor, and R. Sachleben, J. Neuro. Sci.359, 24–34 (2015).
- P. J. Wyatt, LCGC North Am. 15, 160–168 (1997).
- J. Chen, W. Radke, and H. Pasch, Macromolecular Symp.193, 107–118 (2003).



![[1].jpg [1].jpg](/_next/image?url=https%3A%2F%2Fcdn.sanity.io%2Fimages%2F0vv8moc6%2Fchroma%2Ff970d09fd9a78d8d758b609bc5555ac0efcf1f2b-1000x228.jpg%3Ffit%3Dcrop%26auto%3Dformat&w=3840&q=75)


Polysorbate Quantification and Degradation Analysis via LC and Charged Aerosol Detection
April 9th 2025Scientists from ThermoFisher Scientific published a review article in the Journal of Chromatography A that provided an overview of HPLC analysis using charged aerosol detection can help with polysorbate quantification.
Removing Double-Stranded RNA Impurities Using Chromatography
April 8th 2025Researchers from Agency for Science, Technology and Research in Singapore recently published a review article exploring how chromatography can be used to remove double-stranded RNA impurities during mRNA therapeutics production.
