Methodology for Removing Dihalomethane Carryover from Solid-Phase Microextraction Fibers
LCGC North America
Solid-phase microextraction (SPME) in conjunction with gas chromatography–mass spectrometry (GC–MS) is a simple and effective way to sample analytes. Ordinarily the coated fiber is rid of compounds during desorption in the GC, allowing for the analysis of a new sample. Carryover of the analyte between samples, however, is a problem with many chemicals. Our data shows that heating the fiber in a high temperature injection port for only 2 min between runs prevents carryover. The short heating between samples improves the linearity of the peak area versus concentration relationship over four orders of magnitude of concentration, with a limit of detection below 10-7 M in every case. Although carryover is an acknowledged problem with SPME fibers, such short conditioning steps are rarely considered as a means to eliminate it; this study suggests that they should be evaluated as an option.
Solid-phase microextraction (SPME) in conjunction with gas chromatography-mass spectrometry (GC–MS) is a simple and effective way to sample analytes. Ordinarily the coated fiber is rid of compounds during desorption in the GC system, allowing for the analysis of a new sample. Carryover of the analyte between samples, however, is a problem with many chemicals. Our data show that heating the fiber in a high-temperature injection port for only 2 min between runs prevents carryover. The short heating between samples improves the linearity of the peak area versus concentration relationship over four orders of magnitude of concentration, with a limit of detection below 10-7M in every case. Although carryover is an acknowledged problem with SPME fibers, such short conditioning steps are rarely considered as a means to eliminate it. This study suggests that they should be evaluated as an option.
Solid-phase microextraction (SPME) is a rapid and solvent-free extraction technique for concentrating a volatile or semivolatile analyte. Developed in the 1990s (1,2), this technique has seen rapid adoption and widespread use. The analyte in the headspace of a closed and equilibrated vial is allowed to equilibrate with a coated silica fiber. The sample is then thermally desorbed from the SPME fiber while in the injection port. For certain compounds, carryover on the SPME fiber is a problem that increases the limit of detection. The issue of carryover is discussed in major texts on the SPME technique (3–5), but the approaches taken to eliminate it in the literature are varied and usually do not include validation data. Frequently carryover is eliminated by blank runs in between samples or an extension of the desorption step, but these approaches are not always sufficient to remove sticky compounds. Previous work has established that a long (30-min or 10-min) high-temperature conditioning of the fiber between samples can remove carryover for certain analytes (6,7). Shorter (5-min) runs in a separately operated conditioning instrument have also proven to be effective (8). This work explores the effect of an even shorter (2-min) high-temperature conditioning in a second injection port. This approach is effective in removing persistent carryover of iodinated dihalomethanes. The short length of the conditioning run is an asset in large batch processing of these compounds, which are not stable over long time periods.
Halogens play an important role in the oxidative capacity of the atmosphere, so quantifying atmospherically abundant halogenated compounds and their precursors in seawater and marine aerosols is of significant interest (9–13). Wastewater treatment from nuclear power plants produces halogenated compounds, also necessitating measurements in aqueous solutions (14). The concentration ranges in which diiodomethane (CH2I2) and chloroiodomethane (CH2ICl) are found in these venues tend to be in the parts-per-billion (ppb) (~10-9 M) range for seawater and the parts-per-trillion (ppt) (~10-12 M) range for wastewater.
These dihalogenated methane compounds are difficult to measure over a large range of concentrations using standard spectroscopic techniques. Although some studies have successfully used atomic emission spectrometry (15), most research groups have settled upon various types of chromatography and mass spectrometry (MS) to quantify CH2ICl and CH2I2 levels. Most of these methods require a preconcentration or extraction step from aqueous samples to increase sensitivity enough to test field samples and avoid saturating the mass spectrometer with water signal. These methods include adsorbent cold traps coupled with gas chromatography-mass spectrometry (GC–MS) (16,17), purge-and-trap methods followed by GC with electron-capture detection (ECD) (14,17), as well as GC–MS (10), and cryogen-free cooling traps linked to GC with various detection methods (18). The equipment needed to perform several of these preconcentration steps is not widespread commercially.
SPME, coupled to both MS and ECD, has also been used with success to measure dihalomethanes (19–21) as well as trihalomethanes (22,23). This simple and widely accessible technique can be effectively used for laboratory studies of these compounds. It can also be combined with preconcentration techniques to test very low concentration field samples. However, iodine-containing compounds exhibit a significant problem with carryover on the SPME fiber. Iodinated compounds are generally acknowledged to adsorb to surfaces and be difficult to remove from materials (24,25), but there is little literature data that explicitly studies relative rates of adsorption and desorption under realistic conditions (26). A method is presented here for eliminating carryover on the fiber during GC-MS measurements of iodinated dihalomethanes with SPME sample preparation that is shorter than previous literature methods used with commercial fibers.
Experimental
Instrumentation and Reagents
The concentrations studied ranged from 1 × 10⁻⁴–1 × 10⁻⁹ M chloroiodomethane in either water or aqueous 0.5 M sodium chloride solutions, and 1 × 10⁻⁴–1 × 10⁻⁹ M diiodomethane in aqueous 0.5 M sodium chloride solutions. These concentration ranges equate to 17.6 mg/L–1.76 µg/L for chloroiodomethane and 26.8 mg/L–2.68 µg/L for diiodomethane.
Samples were prepared through serial dilutions of 1 × 10⁻³ M stock solutions. Sodium chloride (99+%), chloroiodomethane (98%), and diiodomethane (99+%) were all purchased from ACROS. All solutions used 18 mΩ Barnstead E-Pure water (Thermo Fisher Scientific). Sodium chloride was dissolved, then filtered through sterile Millex syringe driven filters with a 0.45-μm pore size and a membrane of mixed cellulose esters from EMD Millipore. Samples, in 0.50-mL aliquots, were stored in amber glass sample vials with silicone-polytetrafluoroethylene (PTFE) septa (Fisher Scientific). The halogenated organics are light sensitive, so amber glass vials were necessary. Each concentration series was run in triplicate during every headspace SPME GC–MS sequence. Solutions were always run on the same day they were made because it was determined that the samples degraded significantly over longer periods of time. Each bottle took approximately 25 min to analyze and an entire run took about 15 h to complete, including blanks. Samples were run from lowest to highest concentration in multiple replicate sets, with two blank runs between samples. One blank held the temperature at the highest point of the ramp (200 °C) for 11 min, and the other replicated the normal temperature ramp.
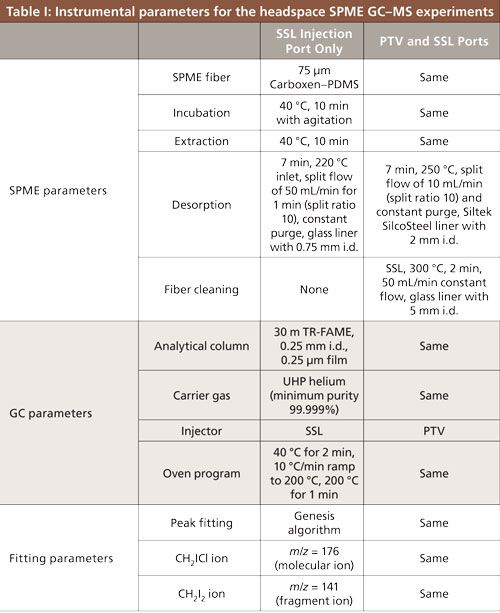
Measurements were performed on a Thermo Fisher Trace GC Ultra gas chromatograph and DSQ II mass spectrometer with samples introduced via a Triplus autosampler (Thermo Electron North American LLC). The ability to do a conditioning run was obtained when an additional programmable temperature vaporizing injector (PTV) port was added to the system, changing the instrument configuration. Thus, measurements were done under two conditions: early measurements used a constant temperature split-splitless (SSL) injection port and later measurements used a programmable variable temperature (PTV) port for injection and the SSL port for cleaning between runs. Parameters for both sets of runs are listed in Table I. In all cases, new SPME fibers underwent a 1-h factory-recommended initial conditioning run at 300 °C before the first use.
Data for the full concentration ranges of chloroiodomethane in water, chloroiodomethane in 0.5 M sodium chloride, and diiodomethane in 0.5 M sodium chloride were collected with and without the conditioning runs between each sample. Peak area at selected masses was determined using the genesis function of the XCalibur Qual Browser program. The molecular ion peak at 176 m/z was used to quantify chloroiodomethane content in samples and the fragment ion peak at 141 m/z was used to determine diiodomethane concentration in samples. Retention times were about 6.5 min and 10.5 min for chloroiodomethane and diiodomethane, respectively. Samples at 1 × 10⁻⁸ M and 1 × 10⁻⁹ M concentration were collected, but are not included in the fits because they were under the statistical limit of detection. Peak identities were regularly checked through spectral matching with the National Institute of Standards and Technology (NIST) database. These matches always confirmed that the peaks under examination belonged to chloroiodomethane and diiodomethane.
The GC–MS signal was plotted versus concentration and fit to the power law y = mxa in Microsoft Excel. Hierarchical mixed model analysis using random intercepts was performed on the data to determine significance using SPSS Premium Campus Edition software.
Methods
Several parameters were examined to arrive at the method listed above. Both 100-µm polydimethylsiloxane (PDMS) and 75-µm Carboxen–PDMS fibers from Supelco (Sigma-Aldrich Corp.) were tested, and the latter were found to consistently give at least double the signal over the entire concentration range presented here. This agrees with a study of trihalomethanes that compared the same fibers (20). Cancho and colleagues found even higher signal for trihalomethanes from Carbowax–divinylbenzene fibers, which were not tested here (23). The TR–FAME column was found to give a higher signal of CH2ICl and CH2I2 than the TR–5 column.
Extraction temperatures of 40 °C and 70 °C were tested, and the 40 °C temperature was found to give approximately seven times higher signal at the lower end of the concentration range. This temperature is similar to the optimized temperature of 37.5 °C used for trihalomethanes from a test range of 30–45 °C (20), but in contrast to the results of Yoshizawa (21), who found that higher temperatures, up to 80 °C, gave better signal for the same dihalogenated compounds examined here in measurements using a PDMS fiber. Here, 12 extraction times between 1 and 30 min were tested in multiple runs, and an extraction time of 10 min was chosen. The extraction time was not fully maximized for the highest signal because of the need for a quick method that would be applicable to a large numbers of samples. The compounds were observed to experience a slight decay over time, limiting the number of samples possible for longer run times. The decay was negligible on the time scale of the experiments presented here. An extraction time of 10 min yielded 89–99% of the equilibrium signal, depending on the concentration tested. To consistently improve the fraction of the equilibrium signal captured, the extraction time would have needed to be doubled because of an unexplained but reproducible dip in the signal at intermediate extraction times above 10 min (see Figure 1 for a representative run). This longer extraction time would substantially slow the measurement, thus limiting the number of samples possible before decay becomes an issue. Yoshizawa tested extraction times ranging from 15 to 60 min and also got variable results, observing a decrease in the CH2I2 signal with increased extraction time (21).
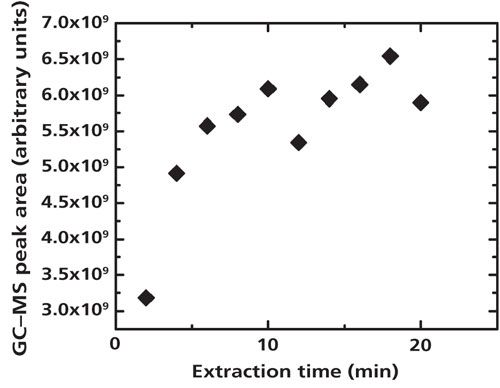
Figure 1: Extraction time variation for 1 × 10⁻⁴ M CH2ICl in water. A 10-min extraction time was used for the experiments. Only signal from the molecular ion of CH2ICl at m/z = 176 is used.
Results and Discussion
Automated GC–MS of CH2I2 and CH2ICl with SPME sample preparation was observed to produce carryover on the sample fiber following the highest concentration runs of 1 × 10⁻⁴ M dihalomethane (Figure 2a). This carryover persisted despite the addition of two blank runs between samples, one in which the temperature was held at the highest point of the ramp (200 °C) for 11 min. It was determined that a higher temperature conditioning of the fiber was necessary to eliminate the carryover signal. The installation of a new PVT injector, used as the analytical inlet, allowed for a 2 min conditioning run at 300 °C in the second, split-splitless, injector following each sample. The split-splitless injector was connected to a short piece of open-ended column ending in the oven and was maintained with a constant helium flow. Since the conditioning was done in a separate port, it did not add additional analyte into the column. In situations where contamination of the oven and outer column surface is a concern, the conditioning port could be directly connected to the detector vent outlet. Performing the 2-min conditioning step was successful in eliminating the carryover problem (Figure 2b). It is common to retain both ports after upgrades and this approach is practical for any instrument with two injection ports. A similar conditioning step could also be performed in the main injection port if only one port is available. This approach is less desirable because it would add to the run time and would also put unwanted material into the analytical column.
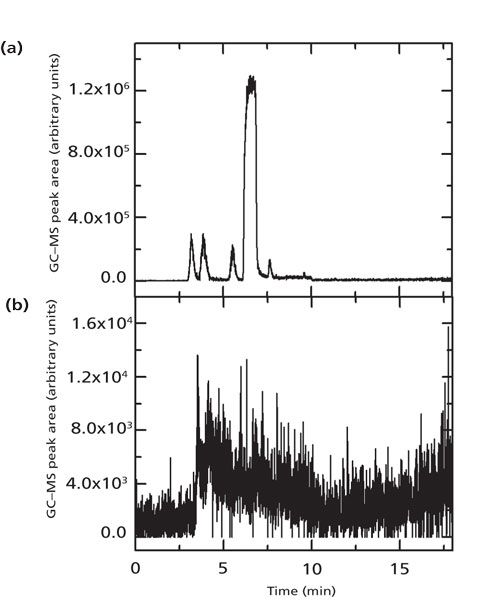
Figure 2: (a) Gas chromatogram of blank sample run after a 1 × 10⁻⁴ M CH2ICl sample in water without a conditioning run. Only signal from the molecular ion of CH2ICl at m/z = 176 is shown. The largest peak at 6.5 min is consistent with the retention time of CH2ICl, indicating that there is carryover on the fiber. (b) Gas chromatogram of blank sample run after a 1 × 10⁻⁴ M CH2ICl in water sample is followed by the conditioning run. There is no distinct peak at 6.5 min, signifying that carryover has been eliminated. Note that the scale is changed from (a) to show the lack of signal clearly.
To gauge the effectiveness of the cleaning step, standard curves were compared with and without the fiber conditioning step for three types of systems: CH2ICl in water, CH2ICl in 0.5 M NaCl solution, and CH2I2 in 0.5 M NaCl solution (see example in Figure 3). Dihalomethane concentrations varied from 1 × 10⁻⁴ to 1 × 10⁻⁷ M in all runs. The different calibration curves are denoted as different trials with “no conditioning” and “conditioning.” As shown in Table II, 14 solutions had three replicates taken on the same day, while two solutions had only two replicates taken. Different solutions were tested as separate trials on different days. All data shown for the standard calibration curves were collected within a 14-month period. The temperature runs described later were performed an additional 12 months after the initial data.
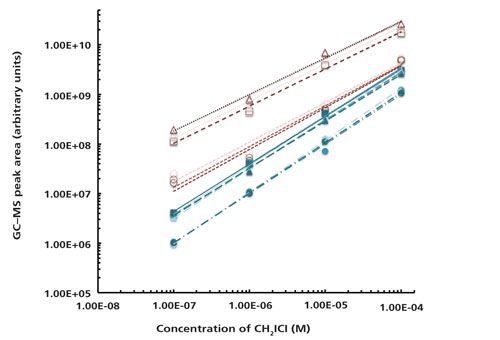
Figure 3: Standard curves of 1 × 10⁻⁴ to 1 × 10⁻⁷ M CH2ICl in 0.5 M NaCl shown on a log–log scale. Peak area is from signal at m/z = 176. Trials with no conditioning of the fiber are shown in red open symbols and lines while trials with conditioning runs are shown in blue solid symbols and lines. Different replicates of the same trial are distinguished by shading of the markers and lines, although in some cases they overlap. Lines show fits to the equation y = mxa for each trial and replicate, for which the corresponding fit parameters are given in Table II. Specifically, for the fiber without conditioning, trial 1 is given by open triangles and dotted lines, trial 2 is given by open squares and medium dashed lines, and trial 3 is given by open circles and short dashed lines. For the fiber with conditioning, trial 1 is given by solid circles and dash-dotted lines, trial 2 is given by solid squares and thin solid lines, and trial 3 is given by solid triangles and long dashed lines.
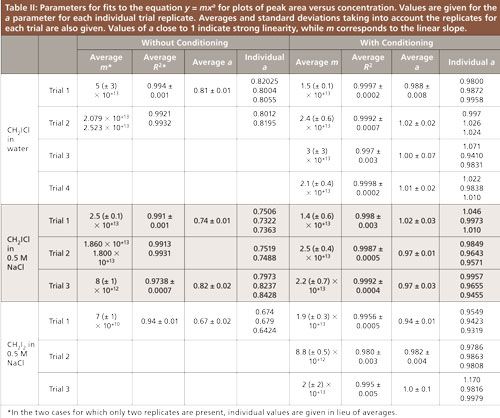
Fits to the power law y = mxa were performed in Microsoft Excel on plots of peak area versus concentration for each individual replicate. A representative graph of these fits is shown in Figure 3 for CH2ICl in 0.5 M NaCl solution. The wide data range was conducive to a power law fit to fully investigate the behavior of the low concentration data points. A basic linear fit of the data gave an R2 value very close to 1 (0.99 or higher) in all cases since the higher concentration data were very linear even without the conditioning step. The resultant fit parameters are found in Table II. For each solution tested, including CH2ICl in water, CH2ICl in 0.5 M NaCl, and CH2I2 in 0.5 M NaCl, values of the parameter a were plotted using the mean and standard deviation of each sample set (Figure 4).
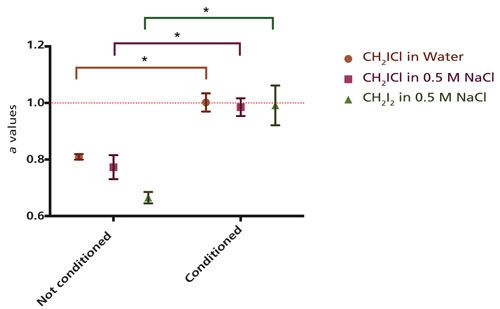
Figure 4: Mean and standard deviation values for the parameter a from fits of calibration data to the equation y = mxa are shown with and without the 2-min conditioning step. Values are given for the three different sets of solutions tested: CH2ICl in water, CH2ICl in 0.5 M NaCl, and CH2I2 in 0.5 M NaCl. Organic concentrations varied from 1 × 10⁻⁴ to 1 × 10⁻⁷ M in all runs. Stars indicate that the conditioned data was significantly different from the unconditioned data in all cases (p <0.05) when compared with a hierarchical mixed model analysis. The dotted lined indicates an a value of 1, which corresponds to perfect linearity between peak area and concentration.
The exponents of the power law fit were analyzed using hierarchical mixed model analysis using random intercepts to determine significant differences between runs with and without the conditioning step. This analysis places trial replicates from an individual experiment into a hierarchy, which is visualized for our study in Figure 5. Level one designates whether or not the fiber conditioning took place, level two separates the independent trials, and level three consists of the trial replicates. The hierarchical mixed model was chosen because of the limited number of independent trials for some chemical mixtures. The analysis can be used in cases where there is missing data because parameters can be successfully estimated using the available data. Thus the trial replicates from a single trial can be used in a “weighted manner” (the replicates are nested within the trial) to determine significance between a conditioned and not conditioned fiber. The Wald score between trial replicates and independent trials was <0.05 for all solutions tested, indicating that the hierarchical model was necessary to analyze the data.

Figure 5: A schematic showing the design of the hierarchical mixed model.
The model showed that, in each case, the runs using the conditioning step had an a value that was significantly higher than those without a conditioning step (p < 0.05). The p values were p = 1.7 × 10⁻⁹ for CH2ICl in water, p = 0.002 for CH2ICl in 0.5 M NaCl, and p = 0.035 for CH2I2 in 0.5 M NaCl. The average exponent was well within the standard deviation of 1 (indicative of perfect linearity) for each trial in which the extra cleaning step was included. In contrast, the average exponent was not within the standard deviation of 1 in any of the cases without a conditioning step (Table II and Figure 4). This clearly demonstrates increased linearity of the standard curves with conditioning. Trials containing no conditioning step showed a lower average a value for CH2I2 than for CH2ICl. This result is likely caused by the larger number of iodine atoms in CH2I2, since iodine is the portion of the molecule most associated with carryover. The slope of the linear relationship (corresponding to the m parameter) does vary depending on instrumental conditions as can been seen in Table II. This behavior was expected. The m value relates to the absolute signal strength, which is affected by conditions that vary over time such as the filament age and cleanliness of the ion source. As with many GC–MS experiments, calibration curves for this system need to be done close in time to the measurement for which they will be used. The consistency within a run can be seen in the lack of variation in peak area at a given concentration between replicates of a single trial. The peak area, when averaged over replicates within a run, had a relative standard deviation that was never more than 0.4% and was usually less than 0.2%.
The two injection ports have different designs and geometries, requiring some injection parameters to be changed (Table I). In the process of making these changes, the inlet temperature for desorption was changed from 220 °C to 250 °C. Because this change could affect the signal, checks were run to make sure that the degree of linearity was not attributable to the increase in temperature. Control experiments were performed in which consecutive replicates of the same sample alternated between 220 °C and 250 °C while including the conditioning step. The 220 °C runs and the 250 °C runs did not exhibit any statistically significant difference in the a values after hierarchical mixed model analysis using random intercepts (p = 0.081). The average a values for the different temperatures agreed within their standard deviations.
The limit of detection (LOD) for the method including the cleaning step was determined through measurement of blank runs (n = 17) coupled with the measured calibration curves. It was calculated assuming a signal-to-noise ratio of 3. For CH2ICl in water the LOD was 2.3 × 10⁻⁸ M. For CH2ICl in 0.5 M aqueous NaCl the LOD was 6.2 × 10⁻⁸ M. For CH2I2 in water the LOD was 9.2 × 10⁻⁸ M. As mentioned previously, the calibration curves do vary with instrumental conditions, which in turn affect the exact value of the limit of the detection. The LOD values given here are averages determined from the multiple calibration curves listed as different trials in Table II.
The result found here is of particular interest because of the short time used for conditioning. There is precedent in the literature for a longer (30- or 10-min) conditioning step used with other compounds (6,7). A medium length (5-min) conditioning step in a free-standing conditioner has also been examined in the literature (8), but that instrument was also shown to be more effective than an injection port so the times may not be comparable. The example shown here with dihalogenated methanes is effective even at very short times. In automated runs, the autosampler begins incubation of one sample while the previous one is still moving through the GC system. The 2-min conditioning step used here was sufficiently short so as to finish before the incubation step began and did not increase the total run time. Thus, it was possible to eliminate carryover without adding any additional analysis time. As mentioned before, this possibility is advantageous with samples where degradation over time is a concern.
There is another very recent example in the literature exploring a short conditioning step that complements our study. Attari and colleagues (27) used a homemade sol-gel single-walled carbon nanotube–silica composite instead of a commercial fiber for the SPME. The focus of that study was to test the new fiber, so the temperature used and validation data for the cleaning step are not explicitly given. However, the paper confirms that a 2-min conditioning step cleaned the fiber of benzotrichloride, chloromethyl methyl ether, and trichloroethylene (27). These data suggest that the result described here is more generally applicable to halogenated compounds, and not limited to dihalogenated methanes.
Even with a conditioning step, the limits of detection are determined here to be in the 10-8 M range, and lie above the concentration range at which these dihalogenated methanes occur in natural systems. Seawater concentrations, as mentioned previously, tend to be in the 10-9 M range for these compounds, and wastewater from nuclear power plants shows concentrations in the 10-12 M range. The improvement discussed here, however, could be coupled with a preconcentration step for improved analysis of environmental samples of dihalogenated methanes and other similar compounds. Headspace SPME GC–MS analysis has been used to examine broader classes of halogenated organic compounds for a wide variety of applications. For example, a recent study used headspace SPME GC–MS analysis to look for several halogenated compounds (including the two studied here and many others) that function as potential allelopathic metabolites of a marine benthic diatom (28). The method has also been used in a medical application to track halogenated organic compounds used as inhalation anesthetics in urine samples (29). Many chemically complex halogenated pesticides exhibit severe carryover on SPME fibers and are good candidates for a conditioning step (30). More generally, our result suggests that very short conditioning steps should be evaluated as a method of decreasing the limit of detection in SPME sample preparation of other, nonhalogenated compounds exhibiting carryover.
Conclusion
The addition of a short, high temperature conditioning step was sufficient to eliminate carryover of CH2I2 and CH2ICl, two environmentally important compounds, on a Carboxen–PDMS SPME fiber. SPME GC–MS coupled with short conditioning times was an effective way to quantify dihalomethanes over a concentration range spanning four orders of magnitude. Calibration curves that included a conditioning step showed significantly more linearity than those performed without this step. Because of the short length (2 min) of the conditioning step and the presence of a second injector, this change added no additional analysis time to automated sample processing. The new methodology allowed for carryover reduction similar to that seen in longer conditioning steps, while also facilitating rapid sample throughput.
Acknowledgments
The authors are grateful for a Camille and Henry Dreyfus Foundation Faculty Start-up grant, and a Research Corporation Cottrell College Science Award for equipment funding. We acknowledge student funding from the Trinity College Student Research Program and the Frank Fellowship at Trinity College.
The authors thank Lisa Yamada for her translation of the article by T. Yoshizawa (reference 21) from Japanese to English and Andres Delgadillo for his assistance with some of the sample preparation. We are grateful to Dr. Dan Cox of the Sackler School of Biomedical Sciences for his assistance in choosing the most appropriate statistical test for our data.
References
- C.L. Arthur and J. Pawliszyn, Anal. Chem.62, 2145–2148 (1990).
- Z.Y. Zhang and J. Pawliszyn, Anal. Chem65, 1843–1852 (1993).
- Handbook of Solid Phase Microextraction. J. Pawliszyn, Ed. (Chemical Industry Press, Beijing, 2009).
- Solid Phase Microextraction: A Practical Guide, S.A. Scheppers Wercinski, Ed. (Marcel Dekker, Inc., New York, 1999).
- Applications of Solid Phase Microextraction, J. Pawliszyn, Ed. (Royal Society of Chemistry, Cambridge, UK, 1999).
- Á. Keszler, K. Héberger, and M. Gude, Chromatographia48, 127–132 (1998).
- Y. Yang, D.J. Miller, and S.B. Hawthorne, J. Chromatogr. A800, 257–266 (1998).
- J.A. Koziel, B. Shurmer, and J. Pawliszyn, J. High Resolut. Chromatogr.23, 343–347 (2000).
- L.J. Carpenter, D.J. Wevill, C.J. Palmer, and J. Michels, Mar. Chem.103, 227–236 (2007).
- A. Ooki and Y. Yokouchi, Mar. Chem. 124, 119–124 (2011).
- A.L. Chuck, S.M. Turner, and P.S. Liss, Journal of Geophysical Research-Oceans, 110, Doi: 10.1029/2004JC002741 (2005).
- M.K. Kurihara et al. Mar. Chem.118, 156–170 (2010).
- R.M. Moore and R. Tokarczyk, Geophys. Res. Lett.19, 1779–1782 (1992).
- L. LÄpine and J.F. Archambault, Anal.Chem. 64, 810–814 (1992).
- S. Slaets, F. Laturnus, and F.C. Adams, Fresenius' J. Anal. Chem.364, 133–140 (1999).
- D.J. Wevill and L.J. Carpenter, Analyst129, 634–638 (2004).
- A. Ekdahl and K. Abrahamsson, Anal. Chim. Acta357, 197–209 (1997).
- B.C. Sive et al., Anal. Chem.77, 6989–6998 (2005).
- B.D. Page and G. Lacroix, J. Chromatogr. A873, 79–94 (2000).
- M. Aguirre-Gonzalez, G. Taborda-Ocampo, C. Dussan-Lubert, C. Nerin, and M. Rosero-Moreano, J. Braz. Chem. Soc.22, 2330–2336 (2011).
- T. Yoshizawa, Annual Report- Chiba Prefectural Laboratory of Water Pollution, 131–134 (1998).
- S. Allard, J.W.A. Charrios, C.A. Joll, and A. Heitz, J. Chromatogr. A1238, 15–21 (2012).
- B. Cancho, F. Ventura, and M.T. Galceran, J. Chromatogr. A841, 197–206 (1999).
- M. Martino, G.P. Mills, J. Woeltjen, and P.S. Liss, Geophys. Res. Lett.36, Doi: 10.1029/2008GL036334 (2009).
- J.L. Jimenez et al., Journal of Geophysical Research-Atmospheres108, Doi: 10.1029/2002JD002452 (2003).
- B. Clément et al., “State of the Art Report on Iodine Chemistry,” Nuclear Energy Agency: Committee on the Safety of Nuclear Installations (2007).
- S.G. Attari, A. Bahrami, F.G. Shahna, and M. Heidari, Journal of Environmental Health Science and Engineering12, 123 (2014).
- B. Vanelslander et al., Proc. Natl. Acad. Sci. U. S. A.109, 2412–2417 (2012).
- D. Poli, E. Bergamaschi, P. Manini, R. Andreoli, and A. Mutti, J. Chromatogr. B732, 115–125 (1999).
- R. Young, V. Lopez-Avila, and W.F. Beckert, J. High Resolut. Chromatogr.19, 247–256 (1996).
Christina M. McGuire is with Tufts University Sackler School of Graduate Biomedical Sciences in Boston, Massachusetts. Edward Harrington Jr. is with the Center for Transplantation Sciences at Massachusetts General Hospital in Boston, Massachusetts. Ashira Anderson is with Mercersburg Academy in Mercersburg, Pennsylvania. All authors, including Maria J. Krisch, were with the Trinity College Chemistry Department in Hartford, Connecticut at the time this research was conducted. Direct correspondence to: chem.krisch@gmail.com

Thermodynamic Insights into Organic Solvent Extraction for Chemical Analysis of Medical Devices
April 16th 2025A new study, published by a researcher from Chemical Characterization Solutions in Minnesota, explored a new approach for sample preparation for the chemical characterization of medical devices.
Sorbonne Researchers Develop Miniaturized GC Detector for VOC Analysis
April 16th 2025A team of scientists from the Paris university developed and optimized MAVERIC, a miniaturized and autonomous gas chromatography (GC) system coupled to a nano-gravimetric detector (NGD) based on a NEMS (nano-electromechanical-system) resonator.
Miniaturized GC–MS Method for BVOC Analysis of Spanish Trees
April 16th 2025University of Valladolid scientists used a miniaturized method for analyzing biogenic volatile organic compounds (BVOCs) emitted by tree species, using headspace solid-phase microextraction coupled with gas chromatography and quadrupole time-of-flight mass spectrometry (HS-SPME-GC–QTOF-MS) has been developed.
A Guide to (U)HPLC Column Selection for Protein Analysis
April 16th 2025Analytical scientists are faced with the task of finding the right column from an almost unmanageable range of products. This paper focuses on columns that enable protein analysis under native conditions through size exclusion, hydrophobic interaction, and ion exchange chromatography. It will highlight the different column characteristics—pore size, particle size, base matrices, column dimensions, ligands—and which questions will help decide which columns to use.

