HPLC Teaching Assistant: A New Tool for Learning and Teaching Liquid Chromatography, Part II
LCGC North America
Part II of this series describes additional features of the HPLC Teaching Assistant software, including the possibility to simulate the impact of the mobile phase temperature on HPLC separations; understand the chromatographic behavior of a mixture of diverse compounds in both isocratic and gradient elution modes; show the influence of instrumentation (injected volume and tubing geometry) on the kinetic performance and sensitivity in HPLC; and demonstrate the impact of analyte molecular weight on thermodynamic (retention and selectivity) and kinetic (efficiency) performance.
Part II of this series describes additional features of the HPLC Teaching Assistant software, including the capability to simulate the impact of the mobile-phase temperature on high performance liquid chromatography (HPLC) separations, understand the chromatographic behavior of a mixture of diverse compounds in both isocratic and gradient elution modes, show the influence of instrumentation (injected volume and tubing geometry) on the kinetic performance and sensitivity in HPLC, and demonstrate the impact of analyte molecular weight on thermodynamic (retention and selectivity) and kinetic (efficiency) performance.
In part I of this series (1), some of the capabilities offered by the high performance liquid chromatography (HPLC) spreadsheet were described, such as the opportunity to
- illustrate the concept of chromatographic resolution, including the impact of retention, selectivity and efficiency;
- understand the plate height (van Deemter) equation and kinetic performance in HPLC;
- recognize the importance of analyte lipophilicity (log P) on retention and selectivity in reversed-phase liquid chromatography (LC) mode; and
- handle reversed-phase LC retention, taking into account the acid-base properties (pKa) of compounds and the mobile-phase pH.
Some additional features of this software are described here, including the capability to simulate the impact of the mobile-phase temperature on HPLC separations, understand the chromatographic behavior of a mixture of diverse compounds in both isocratic and gradient elution modes, show the influence of instrumentation (injected volume and tubing geometry) on the kinetic performance and sensitivity in HPLC, and demonstrate the impact of analyte molecular weight on thermodynamic (retention and selectivity) and kinetic (efficiency) performance.
Understanding the Impact of Mobile-Phase Temperature in Reversed-Phase LC
Theoretical Background
The mobile-phase temperature impacts both the kinetic (shape of the van Deemter curve, optimal linear velocity, and column pressure drop) and the thermodynamic performance (modification of the retention and selectivity).
In terms of kinetic performance, the optimal linear velocity (uopt) of the van Deemter curve is given by the following equation:

The diffusion coefficient, Dm, of solute A in solvent B can be expressed using the Wilke-Chang equation:

where MB is the molecular weight of solvent B, T is the absolute temperature (K), ηB is the viscosity of solvent B (cP) at T, VA is the molar volume of solute A at its normal boiling temperature, and ΦB is the association factor (the association parameter was introduced in the above equation to define the effective molecular weight of the solvent with respect to the diffusion process [2]) of solvent B (dimensionless). Wilke and Chang recommended a value of Φ at 2.6, 1.9, and 1.37 (3) when the solvent was water, methanol, and acetonitrile, respectively. The organic solvent selected for the calculation was acetonitrile. The mobile-phase viscosity was determined from reference 4 and depends on the nature of the organic solvent and the mobile-phase composition and temperature.
The column pressure drop was calculated using Darcy’s law (see equation 9, in part I [1]). It depends on the mobile-phase viscosity and therefore also varies with temperature.
Log k increases linearly as a function of 1/T (K), according to the van’t Hoff equation:

However, the slopes of the van’t Hoff curves vary depending on the compound. On average, the retention factor is divided by a factor of 2 every 30 °C to 40 °C, depending on the compound (this is an empirical value, observed in reference 4). Three compounds were arbitrarily selected. For the first compound (log P of 2.0), the k value was divided by a factor of 2 every 40 °C, for the second compound (log P of 2.5), k was divided by a factor of 2 every 30 °C, and for the third compound (log P of 2.8), k was divided by a factor of 2 every 38 °C.
In the spreadsheet entitled “temperature,” the impact of the column dimensions (Lcol, dcol, and dp), flow rate (F), percentage of organic solvent, compound molecular weight (MW), and mobile-phase temperature on the kinetic and thermodynamic performance can be directly visualized. The first graph shows the kinetic performance (N versus F), the second one illustrates the thermodynamic behavior (log k versus 1/T) of three compounds, and a simulated chromatogram with the three compounds shows the chromatographic behavior when modifying the mobile-phase temperature.
Using the “Temperature” Spreadsheet
Figure 1 illustrates the impact of the mobile-phase temperature on the chromatographic separation of three species with different log P values. The retention decreases with increasing temperature from 30 °C to 150 °C because of the reduction of the mobile-phase polarity with temperature. The total analysis times were 33 min, 10 min, and 5.3 min at 30 °C, 100 °C, and 150 °C, respectively, and t0 remained constant. This result confirms that the percentage of organic solvent has to be decreased to achieve similar retention factors at different temperatures. For example, at 1% acetonitrile, the retention at 150 °C was equivalent to the retention at 30 °C and 20% acetonitrile (data not shown). In addition to retention, the selectivity was also modified, and the elution order of the first two peaks was reversed at approximately 100 °C. This result proves that temperature is an effective parameter to tune selectivity, provided that a sufficiently wide range of temperatures is investigated and the solute structures vary significantly.
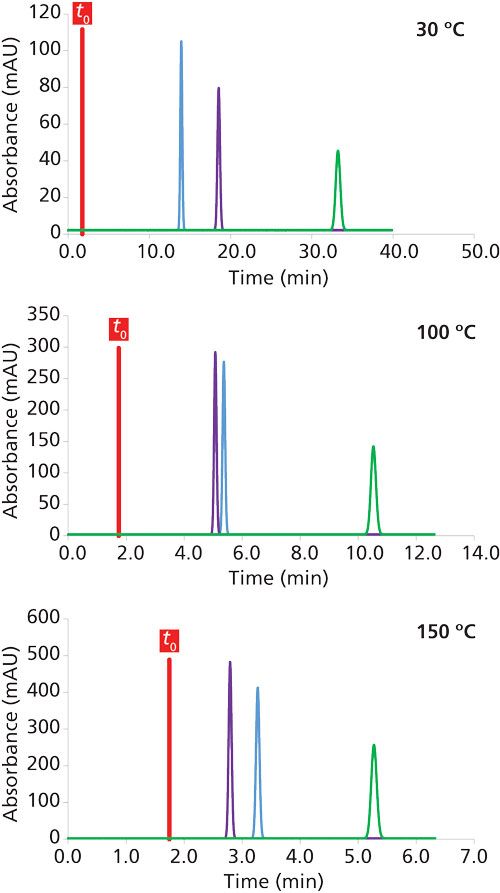
Figure 1: Impact of mobile phase temperature on the retention and selectivity in reversed-phase LC. The chromatograms were simulated at 20% acetonitrile. Column dimensions: 150 mm × 4.6 mm, 5 µm; flow rate: 1 mL/min; compound molecular weight: 100 g/mol.
The plate count and column pressure drop were also calculated for the three conditions reported in Figure 1. The column pressure was reduced from 39 to 11 bar between 30 °C and 150 °C, and the plate count decreased from 14,276 to 12,817. This reduction in efficiency occurs because the van Deemter curve is shifted toward a higher linear velocity at an elevated temperature. Therefore, it would be useful to increase the flow rate to 5 mL/min at 150 °C to achieve the same plate count as observed at 30 °C and 1 mL/min. Under these conditions, the analysis time would be reduced to only 1 min at 150 °C, and the pressure would remain acceptable (53 bar).
Understanding Isocratic Mode in Reversed-Phase LC
Theoretical Background
Retention in LC can be described by linear solvent strength (LSS) theory (5), which shows that the log k value of a given compound is inversely proportional to the proportion of organic modifier in the mobile phase.
This linear behavior can be used to optimize the resolution and develop a reversed-phase LC method. Retention models (log k = f[%methanol]) can be drawn for several compounds contained within a mixture. Then, when considering a given methanol percentage, where the curves do not overlap, the corresponding selectivity is high. In this spreadsheet, the retention models of five compounds with log P values between 2.2 and 2.8 and S values between 4 and 6.3 are presented. Based on these values, the minimal resolution for each methanol percentage was plotted as a function of methanol percentage and the corresponding chromatogram was shown. This procedure can be used to optimize a reversed-phase LC method. Because the LSS curves are linear, only two experimental runs are required to determine the intercepts and slopes of the curves and optimize the chromatographic separation under isocratic conditions. This approach is how optimization software, such as Drylab (Molnar-Institute), Chromsword (Iris Tech), LC & GC simulator (Advanced Chemistry Development), and Osiris (Datalys), optimizes HPLC separations.
Using the “Isocratic Mode” Spreadsheet
A chromatographic separation of five substances can be simulated for any mobile-phase composition. As shown in Figure 2, the retention decreases at high percentages of methanol, which is in line with LSS theory. In addition, the selectivity is also modified. Even though the analysis time was longer at 35% methanol, the separation was not improved compared to 52% methanol. However, the separation obtained at 70% methanol was the worst in terms of selectivity because of the too low retention of the five substances under these conditions (k < 1).
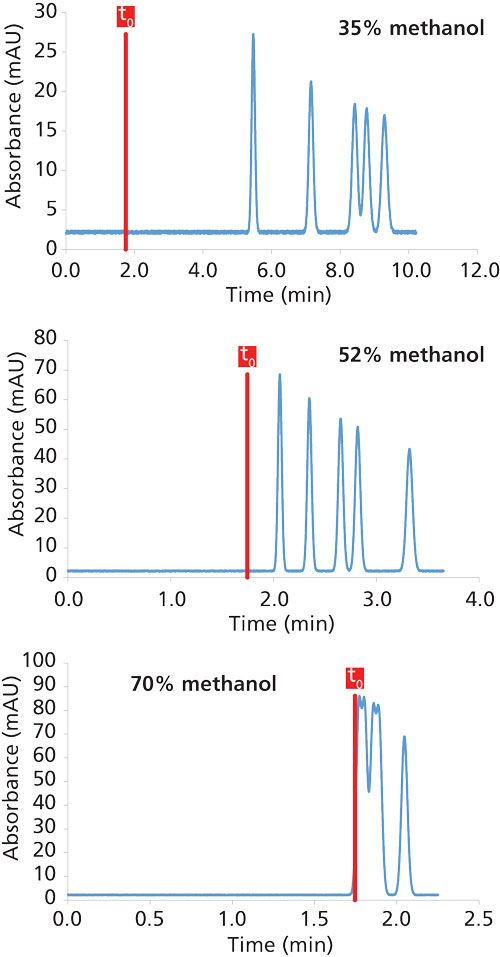
Figure 2: Impact of isocratic mobile phase composition on the retention and selectivity in reversed-phase LC mode. The chromatograms were simulated at 30 °C. Column dimensions: 150 mm × 4.6 mm, 5 µm; flow rate: 1 mL/min.
Users can also set a minimal resolution value (for example, 1.5, which corresponds to a baseline separation of five compounds), and the optimal corresponding methanol percentage is calculated based on the graph representing the minimal resolution as a function of methanol percentage.
Understanding Gradient Mode in Reversed-Phase LC
Theoretical Background
Gradient elution mode is often used in reversed-phase LC to elute compounds of diverse hydrophobicity from a chromatographic column. A chromatogram of five substances eluted under gradient conditions was simulated, and the following procedure was used to construct the chromatogram.
First, five substances of different lipophilicity (log P values ranging from 1.4 to 3.4) were selected. The S values of these five compounds were arbitrarily fixed between 4.0 and 6.3, respectively.
Second, based on the gradient profile (% initial, % final, and gradient time), column dimensions (Lcol, dcol, and dp) and mobile-phase flow rate (F) set by the user, the corresponding elution composition (Ce) of each compound was calculated. Then, the Ce values were transformed into tR under the gradient conditions.
Third, the peak widths (W) in gradient mode were simulated using the following equation:

where N is the plate count and t0 is the column dead time (both calculated based on the column dimensions and mobile-phase flow rate), ke is the elution retention factor, which is calculated from the elution composition, the log kw value obtained from the log P value (using equation 11 from part I) and the S value, using the following equation:

Finally, the corresponding peak capacity (npeaks) was calculated using the equation proposed by Neue (6):

where b is the gradient steepness, which can be expressed as follows:

where tgrad is the gradient time and ΔΦ is the change in solvent composition during the gradient, ranging from 0 to 1.
Using the “Gradient Mode” Spreadsheet
This spreadsheet allows the simulation of chromatograms for various column dimensions, mobile-phase flow rates, and gradient conditions. Figure 3 shows four simulated chromatograms, for which the column dimensions and mobile-phase flow rates were fixed and only the gradient conditions were modified (initial and final compositions, as well as gradient time). The first chromatogram shown in Figure 3a was obtained with a gradient from 5% to 40% methanol in 20 min and allows baseline separation of the five substances with a peak capacity of 63 and minimum resolution (Rs,min) of 3.3. For the second chromatogram, the initial methanol percentage was modified from 5% to 30%. As shown in Figure 3b, the separation was faster, which is logical because the initial composition of the mobile phase had more eluent, and the selectivity was also modified, which is in agreement with theory because the initial methanol percentage and gradient slope are the two most important parameters for tuning the selectivity under gradient conditions. In Figure 3b, the peak capacity was 63 and Rs,min decreased to 1.3. Between Figures 3a and 3c, only the final methanol percentage was modified from 40% to 80%. Under these conditions, all the peaks were eluted in approximately 10 min, showing that there is no need to greatly increase the final methanol percentage. Indeed, the investigated molecules were not sufficiently lipophilic to require such an elevated methanol proportion. Finally, between Figures 3a and 3d, only the gradient time was modified, from 20 to 60 min. The increase of the gradient time improves the peak capacity (equal to 91) and Rs,min (equal to 4.6). However, it could be beneficial to reduce the final methanol percentage in Figure 3d because all the peaks were eluted in only 22 min.
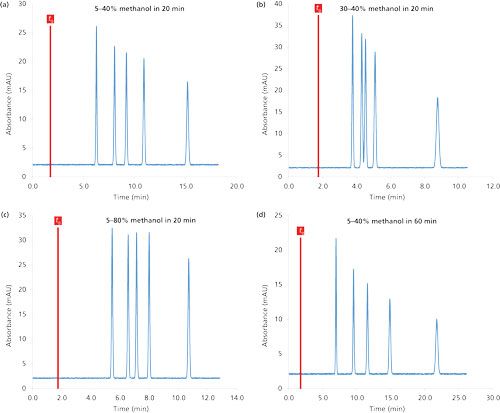
Figure 3:Relationship between the gradient conditions and the retention–selectivity in reversed-phase LC mode. The chromatograms were simulated at 30 °C. Column dimensions: 150 mm × 4.6 mm, 5 µm; flow rate: 1 mL/min.
In this example, only the gradient profile was modified, but the user can also easily visualize the impact of the column dimensions and mobile-phase flow rate on the chromatogram obtained under gradient conditions. For example, for a constant gradient time, a higher mobile-phase flow rate often improves the resolution and peak capacity while simultaneously reducing the elution time. This improvement occurs because the column dead time is lower at elevated mobile-phase flow rates; therefore, the ke values are enhanced, leading to better overall performance (7).
Understanding the Impact of the Injected Volume in Reversed-Phase LC
Theoretical Background
The injected volume in reversed-phase LC has two effects on the separation, which are simulated under isocratic conditions in the spreadsheet entitled “injected volume.” First, a higher sensitivity (Cmax) is expected when increasing the injected volume (Vinj) based on equation (8):

However, it is not possible to inject a volume as large as is possible in reversed-phase LC, so a compromise has to be found. Peaks become much broader and the plate count is reduced at high Vinj values for the following reason: In HPLC, the observed peak variance (σ²tot) is the sum of the chromatographic column dispersion (σ²col), the dispersion related to the injection system (σ²inj) and the dispersion related to the rest of the equipment (tubing and detector, σ²ext). It can be expressed as follows:

For the sake of simplicity, σ²ext was neglected.
Dispersion linked to the chromatographic column itself (σ²col) can be obtained by the following equation, when a very small volume of sample is injected:

where σ²col is the column variance (in units of µL²), N is the number of plates, and VR is the retention volume, which is a function of the column dead volume V0 and retention factor k.
The dispersion related to the injection (σ²inj) can be expressed as shown in equation 11 (9):

where Kinj is a constant (generally between 1 and 3) that depends on the injection mode. In our case, this value was set to 2.
The observed plate number (Nobs) could then be estimated by the equation below:

where Ncol is the theoretical number of plates of thechromatographic support.
The impact of Vinj on chromatographic performance (sensitivity and plate count) was assessed. Users can set the column dimensions (Lcol, dcol, and dp), mobile-phase flow rate, log P values of three model compounds, percentage of methanol in the mobile phase, injected volume, and compound concentration. Then, a chromatogram is simulated under the conditions set by the user, and a graph representing the column volume versus the injected volume is shown. All the chromatographic calculations and simulations were made for a sample diluted in a mixture of solvent strictly equivalent to the mobile phase itself.
Using the “Injected Volume” Spreadsheet
In reversed-phase LC, the injected volume should be between 0.5% and 5% of the column volume to achieve a good compromise between sensitivity and peak broadening. Figure 4 shows the effect of the injected volume on the chromatographic performance for three compounds with k values between 2 and 8. In Figure 4a, a chromatogram was simulated for an injected volume of 20 µL on a 150 mm × 4.6 mm, 5-µm column (Vinj equal to 1.1% of Vcol). Under these conditions, the peaks were narrow (average efficiency of 11,700 plates), but the sensitivity was also poor, particularly for the last eluted peak, because of the dilution effect in the mobile phase. Therefore, the injected volume was increased 20-fold in Figure 4b (400 µL), and better sensitivity was achieved. However, the peaks were also much broader in this chromatogram (N = 2500 plates, compared to a theoretical N value of 11,700), and strong differences were observed between the first eluted peak (N = 1050 plates) and the last one (N = 5300 plates), according to equations 10 and 12. Under these new conditions, Vinj is equal to 23% of Vcol, which is too high. In Figures 4c and 4d, a column of reduced volume was selected (50 × 2.1 mm, 5 µm). A volume of 20 µL was injected in Figure 4c (Vinj equal to 16% of Vcol), which is relatively high. The efficiency was poor (1200–2500 plates), but the sensitivity was relatively good. When decreasing Vinj to only 1 µL (Vinj equal to 0.8% of Vcol), no loss in plate count was observed for the column (approximately 3000 plates), but the sensitivity was too low for the last eluted peaks.
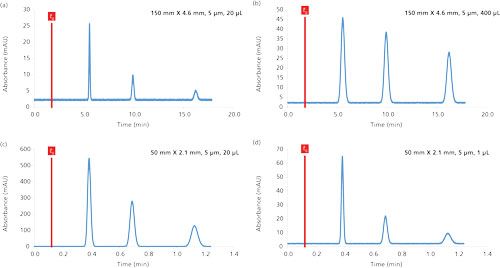
Figure 4:Impact of the injected volume on the sensitivity and kinetic performance in reversed-phase LC conditions. The chromatograms were simulated at 30 °C. Mobile phase: 30 methanol; flow rate: 1 mL/min; injected concentration (Cinj): 20 mg/L; compound log P values: 1.6, 2.0, and 2.3.
These examples illustrate the impact of the injected volume on the chromatographic performance and the compromise that needs to be made to achieve sufficient sensitivity and reasonable band broadening.
Understanding the Impact of the Tubing Geometry in Reversed-Phase LC
Theoretical background
In HPLC, the volume between the injector and detector contributes to band broadening. Therefore, the tubing between the injector and the column inlet, as well as the tubing between the column outlet and the detector, should be optimized in terms of dimensions to limit peak broadening and efficiency loss under isocratic conditions.
Similar to what was previously described for the injected volume, the dispersion related to the tubing (σ²tube) can be expressed as a function of the tubing radius, rtube, and its length, ltube (9):

Here, the dispersion related to the injection and detector was neglected for simplicity.
The tubing volume affects the plate count according to the following relationship:

The pressure generated by the tubing itself is also modified by changing the tubing diameter (dtube) or length (Ltube), according to the Hagen-Poiseuille equation:

The impact of the tubing geometry (dtube and Ltube) on chromatographic performance (generated pressure and chromatographic dispersion) was assessed. Users can set the column dimensions (Lcol, dcol, and dp), mobile-phase flow rate, log P values of the three model compounds, the methanol percentage in the mobile phase, and the tubing geometry (Ltube and dtube). Users have a choice of four conventional tubing diameters that are widely used in HPLC, namely 65, 127, 250, and 500 µm. A chromatogram is simulated under the selected conditions, and a graph representing the column volume versus tubing volume is shown. The pressure generated by the tubing is also provided to determine the best compromise between pressure and band broadening.
Using the “Tubing Geometry” spreadsheet
Figure 5 shows the impact of the tubing geometry on chromatograms simulated under various analytical conditions. In Figure 5a, the column dimensions were standard (150 mm × 4.6 mm, 5 µm) and the tubing had a relatively low volume corresponding to only 1% of the column volume. Under these conditions, the impact of tubing on the efficiency was negligible (theoretical efficiency of 11,700 plates and observed efficiency for compounds with k values between 2 and 8, equal to 11,500–11,600 plates), and the pressure generated by the tubing itself was reasonable (37 bar). After changing the tubing geometry to a length of 2 m and a diameter of 500 µm, the impact on the kinetic performance was drastic. In Figure 5b, the peaks were much broader and the efficiency was in the range of 1500–6600 plates. The efficiency was strongly decreased because of the modification of the tubing geometry, in agreement with equations 13 and 14. In Figures 5c and 5d, the column dimensions were modified and the volume was strongly decreased (50 mm × 1 mm, 5 µm). The impact of the tubing volume was obviously more critical, and the peaks were particularly broad when using this column on a system with approximately 1 m of tubing with a 127-µm diameter. The tubing volume represented 46% of the column volume, and efficiency was in the range of 190–930, and the column should produce 1870 plates at this flow rate. Based on this observation, the tubing diameter was reduced to 65 µm and the length was reduced to 50 cm. Under these conditions, the efficiency was much better because the tubing represented only 6% of the column volume, but the tubing pressure was too large (270 bar), in agreement with equation 15.
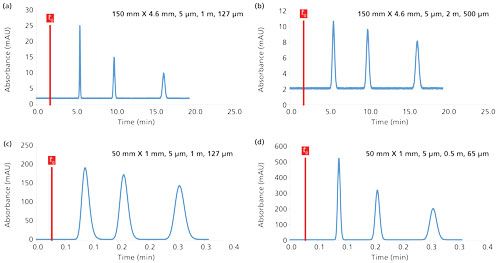
Figure 5:Impact of the injected volume on the sensitivity and kinetic performance in reversed-phase LC conditions. The chromatograms were simulated at 30 °C. Mobile phase: 30 methanol; flow rate: 1 mL/min; injected concentration (Cinj): 20 mg/L; compound log P values: 1.6, 2.0, and 2.3.
In conclusion, a compromise has to be made between plate count and pressure when selecting the optimal tubing geometry for plumbing a HPLC system. A chromatographic system cannot be easily used with a wide range of column internal diameters. Currently, even the best HPLC and ultrahigh-pressure liquid chromatography (UHPLC) systems on the market are not adapted to 1 mm i.d. columns, and the performance reported in Figure 5d cannot be achieved. Therefore, it would be relevant to develop a technical solution to limit the use of tubing in isocratic mode.
Understanding the Impact of Compound Molecular Weight in Reversed-Phase LC
Theoretical Background
As shown in equation 2, the diffusion coefficient (Dm) of an analyzed compound is directly proportional to the analyte molecular weight (MW). In addition, there is a direct relationship between the optimal linear velocity (uopt) and Dm, according to equation 1. Therefore, the kinetic performance, and particularly the van Deemter curve shapes, is modified when analyzing compounds of different molecular weights. The achieved plate count at a given flow rate might change depending on the compound molecular weight. In most cases, a decrease in performance (broader peaks) is observed in reversed-phase LC when increasing the molecular weight of the analyzed substances because experiments are often conducted at flow rates higher than the van Deemter optimum.
In addition to the kinetic performance, the size of the analyzed compound also impacts the slope of the LSS curve (log k versus % organic solvent), which corresponds to the S parameter in equation 12 of part I (1). It has been empirically demonstrated that the relationship between S and MW can be expressed by the following empirical equation (5):

Therefore, for a high S value (large molecules), the retention factor may vary strongly with the mobile-phase composition (methanol percentage). In some cases (for example, with large peptides and proteins), it is impossible to find isocratic conditions to analyze several large molecules, and gradient elution is mandatory.
In the spreadsheet, the user can set the column dimensions (Lcol, dcol, and dp), mobile-phase flow rate, acetonitrile percentage in the mobile phase and the molecular weight of the three model compounds. Using these values, kinetic curves for the three different model compounds are drawn, showing the efficiency versus mobile-phase flow rate. In addition, the LSS curves (log k versus %acetonitrile) are provided to illustrate the slopes of the curves and how the retention factors varies with %acetonitrile. Finally, a chromatogram is also simulated for the three model compounds. Here, a color code (blue, purple, or green) was used to distinguish between the three analytes. In this spreadsheet, the three selected compounds have log P values of 2.2, 2.3, and 3.5, respectively, and the S values were estimated using equation 16 based on the compound molecular weights. Equation 12 of part I (1) was used to calculate the log k of each substance and their corresponding retention times.
Using the “Molecular Weight” Spreadsheet
Figure 6 shows the impact of the compound molecular weight on the chromatographic performance, considering three compounds with constant log P values of 2.2 (blue trace), 2.3 (purple trace), and 3.5 (green trace). Between Figures 6a and 6b, only the molecular weights were changed, leading to modification of the S values.
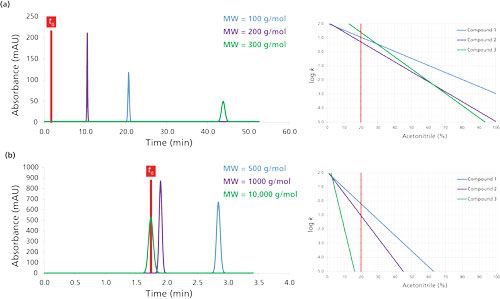
Figure 6:Impact of the compound molecular weight in reversed-phase LC mode. The chromatograms were simulated at 30 °C. Column dimensions: 150 mm × 4.6 mm, 5 µm; mobile phase: 20% acetonitrile; flow rate: 1 mL/min.
In Figure 6a, the molecular weights were comparable (between 100 and 300 g/mol); therefore, the three compounds can be eluted under isocratic conditions with sufficient retention (k values between 5 and 24). This behavior is in line with the three LSS curves (log k versus acetonitrile percentage) because the slopes were comparable. From a kinetic point of view, the observed plate count varies from 14,700 (MW of 100 g/mol) to 11,300 (MW of 300 g/mol) when using a 150 mm × 4.6 mm, 5-µm column at a constant flow rate of 1 mL/min. Therefore, the flow rate should be decreased to 0.45 mL/min to attain a plate count of approximately 15,000 plates for a 300 g/mol molecule.
In Figure 6b, the three model compounds have molecular weights ranging from 500 to 10,000 g/mol with the same log P values as in Figure 6a. This example illustrates that molecules with very different molecular weights cannot be easily eluted under isocratic conditions at 20% acetonitrile with a reasonable retention. In this example, the retention factors were between 0 and 0.6. This chromatographic behavior can be explained by the LSS curves on the right side of Figure 6b. The curves have relatively different (but also very steep) slopes, which makes the separation incompatible with isocratic conditions. In addition to the retention behavior, the plate count was quite low for these larger molecules (2200–9500 plates) because the flow rate was much higher than the optimal flow rate. For the largest molecule of 10,000 g/mol, the flow rate should be 60 µL/min to achieve a plate count of approximately 15,000 plates. However, these conditions are impractical because the column dead time would be 29 min.
Conclusion
This spreadsheet provides an understanding of the basic principles of liquid chromatography using virtual (simulated) chromatograms obtained under various analytical conditions.
Acknowledgments
The authors wish to thank Dr. Szabolcs Fekete from the University of Geneva for his critical review of the manuscript and his suggestions to improve the spreadsheet.
References
- D. Guillarme and J.L. Veuthey, LCGC North Am.34(10), 804–811 (2016).
- R. Sitaraman, S.H. Ibrahim, and N.R. Kuloor, J. Chem. Eng. Data8, 198–201 (1963).
- K. Miyabe, J. Sep. Sci.34, 2674–2679 (2011).
- D. Guillarme, S. Heinisch, and J.L. Rocca, J. Chromatogr. A1052, 39–51 (2004).
- L.R. Snyder and J.W. Dolan, High Performance Gradient Elution: The Practical Application of the Linear-Solvent-Strength Model (Wiley, Hoboken, New Jersey, 2007).
- U.D. Neue, J. Chromatogr. A1184, 107–130 (2008).
- D. Guillarme, E. Grata, G. Glauser, J.L. Wolfender, J.L. Veuthey, and S. Rudaz, J. Chromatogr. A1216, 3232–3243 (2009).
- L.R. Snyder, J.J. Kirkland, and J.W. Dolan, Introduction to Modern Liquid Chromatography, 3rd edition (Wiley, Hoboken, New Jersey, 2010).
- D. Guillarme, D. Nguyen, S. Rudaz, and J.L. Veuthey, Eur. J. Pharm. Biopharm. 66, 475–482 (2007).
Davy Guillarme and Jean-Luc Veuthey are with the School of Pharmaceutical Sciences at the University of Geneva, University of Lausanne in Geneva, Switzerland.
Direct correspondence to: davy.guillarme@unige.ch

Polysorbate Quantification and Degradation Analysis via LC and Charged Aerosol Detection
April 9th 2025Scientists from ThermoFisher Scientific published a review article in the Journal of Chromatography A that provided an overview of HPLC analysis using charged aerosol detection can help with polysorbate quantification.
Removing Double-Stranded RNA Impurities Using Chromatography
April 8th 2025Researchers from Agency for Science, Technology and Research in Singapore recently published a review article exploring how chromatography can be used to remove double-stranded RNA impurities during mRNA therapeutics production.

