Metabolite Identification Using Multiple Mass Defect Filters and Higher Energy Collisional Dissociation on a Hybrid Mass Spectrometer
Special Issues
In this article, the authors evaluate the use of multiple mass defect filters on metabolite identification data from a hybrid mass spectrometer. The study also investigates the use of higher energy collisional dissociation for structural elucidation in metabolite identification experiments.
An integral part of drug discovery and development is the identification of drug metabolites formed through phase I and phase II metabolic reactions. These metabolites may either have intrinsic pharmacological activity or display specific toxicity. Liquid chromatography coupled with mass spectrometry (LC–MS) has become the cornerstone in drug metabolite identification because of its sensitivity and ability to analyze complex mixtures. In particular, LC–MSn employing linear ion-trap MS has become widely used because of its speed, sensitivity, and robustness in generating rich structure information. However, challenges still remain in detecting and identifying metabolites in the presence of highly complex biological matrices.
Coupling a mass analyzer to a linear ion trap greatly facilitates the task of metabolite identification because it not only enables parallel data acquisition with high mass accuracy and resolution, but also provides ion manipulations that occur after the linear ion trap. High resolution and accurate mass help to resolve and identify metabolite peaks from background matrix ions and also allow the use of post-acquisition data processing tools such as the mass defect filter (MDF) to reduce the number of false positives by removing the vast majority of matrix-related background ions. Higher energy collisional dissociation (HCD) was introduced recently on the Thermo Scientific LTQ Orbitrap XL hybrid mass spectrometer (Thermo Fisher Scientific, San Jose, California) as an alternative dissociation method by adding a new collision cell behind the C-trap region (Figure 1). HCD can be used to generate low mass diagnostic ions in MS-MS mode, and can be used in combination with collision induced dissociation (CID) in the linear ion-trap mass spectrometer for MSn experiments.
MMDF is a new feature in MetWorks software (Thermo Fisher Scientific). This postacquisition data processing tool allows the user to combine the results from as many as six MDFs. To explain MMDF, one needs to first understand the terms mass defect and MDF.
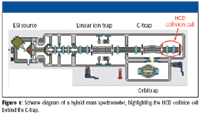
Figure 1
The term mass defect originates from the fact that only the monoisotopic element 12C has an integer value for atomic weight, that is, 12.000000. Mass defect refers to the difference between the exact mass of an element (or a compound) and its closest integer value. It can be positive (larger than the nominal mass) or negative (smaller than the nominal mass). MDF refers to a postacquisition data filtering technique based on the mass defect of the parent drug and its metabolites. To use MDF, it is critically important to use high mass accuracy data from high-resolution analyses.
Each parent compound has a mass defect, which will be associated with its metabolites because a large portion of the parent compound structure usually remains unchanged during biotransformation. In other words, the mass defect of metabolites will lie within a relatively narrow range. Based upon the molecular weight of the parent compound, estimation also can be made regarding the range of molecular weight in which these metabolites will occur. MDF can be applied to filter out all ions that fall outside of the expected molecular weight range, as well as those ions that are within the expected molecular weight range but exceed the expected mass defect range. This data reduction technique allows users to focus on the analysis of species that are potential drug metabolite candidates.
Irinotecan (CPT-11; 7-ethyl-10-[4-(1-piperidino)-1-piperidino] carbonyloxy-camptothecin) is a water-soluble carbamate prodrug of camptothecin and is activated in vivo to SN-38, a potent topoisomerase I inhibitor (1,2). Currently, irinotecan, combined with 5-fluorouracil and leucovorin, is approved by the U.S. Food and Drug Administration as first-line therapy in the treatment of metastatic carcinoma of the colon or rectum (2). In this study, MMDF and HCD on a hybrid mass spectrometer were used to study the biotransformations of irinotecan in hepatocyte incubation and identify its metabolites.
Experimental
Rat hepatocyte incubation samples of irinotecan were analyzed using an LTQ Orbitrap XL mass spectrometer with HCD functionality. Both collision-induced dissociation (CID) MS-MS and HCD MS-MS spectra were acquired for the potential metabolites. MMDFs were then used to process the acquired raw file.
Samples
Incubation was carried out using rat hepatocytes pooled from one male and one female rat with a cell density of 0.5 million/mL and 10 μM of irinotecan in the final 1 mL incubation solution. The solution was shaken overnight and quenched by cooling down on dry ice, followed by the addition of 200 μL of chilled acetonitrile. The solution was then vortexed and centrifuged. The supernatant (~1 mL) was taken out, and 10 μL from such solution was injected directly for each LC–MS-MS run.
HPLC System
Accela High Speed LC system (Thermo Fisher Scientific).
Column
Hypersil GOLD column, 100 mm × 1 mm, 1.9-μm particle size (Thermo Fisher Scientific).
Gradient
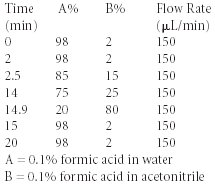
Mass Spectrometer
LTQ Oribitrap XL with HCD collision cell (Thermo Fisher Scientific).
Data Processing
MetWorks 1.1.0 Metabolite Identification software (Thermo Fisher Scientific).
Results and Discussion
The software facilitated automated acquisition, processing, and reporting of LC–MSn data in support of biotransformation studies and fully leveraged the high resolution accurate mass data from the mass spectrometer. The software includes tools that facilitate distinguishing xenobiotic components from endogenous biological matrix interferences in LC–MSn chromatograms and spectra. One of these features — MMDF — has the flexibility to apply as many as six MDFs, which are based upon high-resolution, exact mass, and mass deficiencies of the parent drug and its putative metabolites.
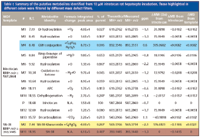
Table I: Summary of the putative metabolites identified from 10 μM irinotecan rat hepatocyte incubation. Those highlighted in different colors were filtered by different mass defect filters.
Through the use of MMDF and the combination of HCD and CID MS-MS, 13 irinotecan metabolites were identified from the incubation sample using the mass spectrometer with less than 3 ppm mass accuracy. Table I summarizes the 13 metabolites identified, while Figure 2 identifies their corresponding structures.
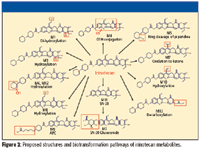
Figure 2
As shown in Table I, all 13 metabolites were found with peak areas less than 1% of that of the parent. Figure 3 shows how the base peak chromatogram from the same LC–MS-MS run changed after a single MDF and after MMDF processing. Because of the low abundance of the metabolites, in all of these chromatograms, the intensity (y axis) for retention time 5.7–11.2 min, and 12.5–16.1 min was expanded by 50 times to better illustrate the effectiveness of MMDF. While all the peaks from the irinotecan metabolites were well buried in the original chromatogram (Figure 3a), the most abundant metabolite peaks (for example, M2 at 7.44 min, M5 at 8.84 min, M7 at 9.92 min) start to show up after applying a single MDF (Figure 3b). However, even with a single MDF, peaks from background matrix ions that are unrelated to the metabolite were still prominent (for example, peaks at 6.55 min, 7.85 min, and 11.1 min). This is because to use only one single MDF to capture all the phase I and II metabolites, including those from the hydrolysis product SN-38, a relatively wide mass defect range must be used (-150 mmu, +70 mmu). Therefore, a portion of the background ions remains after the MDF.
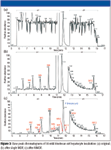
Figure 3
When MMDF was applied to the original data (Figure 3c), four different mass defect filters were used, whose corresponding metabolites identified were highlighted using different colors in Table I: phase I metabolites of irinotecan are shown with white background; phase II metabolites of irinotecan are shown in light blue; phase I metabolites of SN-38 are shown in yellow; and phase II metabolites of SN-38 are shown in pink. Compared to the results using a single MDF (Figure 3b), results from MMDF (Figure 3c) are cleaner and more specific to the metabolites related to irinotecan, and therefore easier to interpret.
Figure 4 further illustrates the power of MMDF by showing an example of how the full MS spectrum changed after the same single MDF and MMDF were applied. The peak at 603.2805 m/z is a hydroxylation metabolite, M3, that is eluted at 8.45 per min. The original full-scan MS spectrum is dominated by background ions, and the M3 peak has less than 15% relative abundance. After a single MDF was applied, the M3 peak becomes the base peak; however, there are still many background peaks remaining in the spectrum. After MMDF was applied, only the M3 peak and trace of the parent remained in the spectrum while all of the background ions were gone. After MMDF processing, HCD and CID MS-MS spectra of irinotecan and its potential metabolites were analyzed, and their corresponding structures were elucidated.
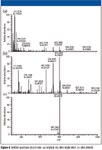
Figure 4
Figure 5a shows the CID MS-MS spectrum of irinotecan from the linear ion trap, and Figure 5b shows the HCD MS-MS spectrum from the orbitrap. While all the major fragment ions in the CID spectrum also were observed in the HCD spectrum, the HCD spectrum contains additional fragment ions and has no low mass cutoff. A portion of the parent ions still remains in the HCD spectrum. These are characteristics similar to those from a quadrupole collision cell. Less than 2 ppm mass accuracy and high resolution were obtained on the fragment ions in the HCD MS-MS spectrum because it was acquired in the orbitrap. Mass Frontier software (HighChem, Ltd., Bratislava, Slovakia) was used to assist with spectrum interpretation. Structures of the fragment ions were assigned accordingly. The fact that HCD spectra display rich fragment ions, especially in the low mass region, as well as high mass accuracy on these product ions, facilitates the MS-MS interpretation greatly.
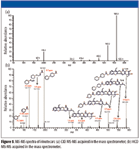
Figure 5
Conclusions
With the help of MMDF and the combination of HCD and CID MS-MS, 13 irinotecan metabolites whose peak areas were less than 1% of that of the parent were identified using LC–MS.
This article demonstrates that MMDF is more effective than a single MDF to uncover phase I and II metabolites specifically and concurrently. It also allows the detection of metabolites from hydrolysis or N-dealkylation, even when the products from such processes have mass defects that differ significantly from the parent. MMDF allows users to use low threshold values during data processing so that metabolites at very low levels can be identified easily. The resulting chromatogram from MMDF is accurate and specific because it is based upon exact mass and mass deficiencies, which are highly specific to the parent drug compound. It provides speed, sensitivity, and accuracy to facilitate the identification of drug metabolites in drug discovery and development.
HCD provides an alternative fragmentation method on the LTQ Orbitrap XL in addition to the CID in the linear ion trap. HCD spectra display characteristics similar to those from a quadrupole collision cell: rich in product ions, with no low mass cutoff, and typically a portion of the parent ions still remains. The fragment ions in HCD spectra have high mass accuracy and resolution. These characteristics of HCD spectra complement the power of ion-trap MSn and allow easy spectrum interpretation and high confidence in structural elucidation.
Yingying Huang and Patrick M. Jeanville are with Thermo Fisher Scientific, San Jose, California. Shirley Liu and Shichang Miao are with ChemoCentryx, Mountain View, California.
References
(1) M.C. Haaz, C. Riché, L.P. Rivory, and J. Robert, Drug Metab. Dispos. 26(8), 769–774 (1998).
(2) S.P. Sanghani, S.K. Quinney, T.B. Fredenburg, W.I. Davis, D.J. Murry, and W.F. Bosron, Drug Metab. Dispos. 32(5), 505–511 (2004).

Understanding FDA Recommendations for N-Nitrosamine Impurity Levels
April 17th 2025We spoke with Josh Hoerner, general manager of Purisys, which specializes in a small volume custom synthesis and specialized controlled substance manufacturing, to gain his perspective on FDA’s recommendations for acceptable intake limits for N-nitrosamine impurities.


