Laser Diode Thermal Desorption Tandem Mass Spectrometry for Simultaneous Quantitation of Metformin and Sitagliptin in Mouse and Human Dried Blood Spots
LCGC North America
An exploration of LDTD-MS-MS and how it compares to HPLC–MS-MS techniques in terms of sensitivity, robustness, and speed in an in-vivo drug discovery application
This article explores the use of laser diode thermal desorption tandem mass spectrometry (LDTD-MS-MS) for accurate, simultaneous measurements of metformin and sitagliptin concentrations in mouse and human dried blood spots. An experiment is explained in detail to demonstrate the sensitivity, robustness, and speed of the method compared to conventional high performance liquid chromatography tandem mass spectrometry (HPLC–MS-MS) techniques. Following the application of the method to spiked mouse and human dried blood spot samples, intra-assay and interassay accuracy and precision across the analytes and species deviated by less than 30% at all calibration levels and less than 20% at all quality control levels.
Metformin, originally marketed as Glucophage by Bristol-Myers Squibb (New York, New York), is an oral antihyperglycemic drug in the biguanide class that improves glucose tolerance in patients with type II diabetes. The drug lowers both basal and postprandial plasma glucose and improves insulin sensitivity by increasing peripheral glucose uptake and utilization (1). It is this triple action of metformin that makes it the first-line drug of choice for the treatment of type II diabetes.
Sitagliptin, developed and marketed as Januvia by Merck and Co. (Whitehouse Station, New Jersey), is the first in a new class of diabetic drugs called dipeptidyl peptidase-4 (DPP-4) inhibitors. This orally active, enzyme-inhibiting drug is approved as an adjunct to diet and exercise to improve glycemic control in adults with type II diabetes mellitus (2). Sitagliptin can be used either alone or in combination with other oral antihyperglycemic agents. Merck also markets sitagliptin in combination with metformin in a single dosage form known as Janumet.
Metformin and sitagliptin are typically used in drug discovery in-vivo models to assess the antidiabetic potential of new chemical compounds. Most commonly, they are used as comparison compounds in oral glucose tolerance tests (OGTT) or other pharmacokinetic or pharmacodynamic studies (3). Metformin toxicity occurs in concentrations of more than 5000 mg, leading to lactic acidosis as a result of the accumulation of lactic acid in the bloodstream. Excess concentrations of sitagliptin can also cause serious side effects, including severe allergic reactions and pancreas inflammation. As a result, accurate measurement of metformin and sitagliptin concentrations is of vital importance for therapeutic drug monitoring of diabetic patients, as well as to prevent toxicity (4).
Limitations of Conventional Analysis Methods
Drug exposure is often measured by analyzing plasma or whole blood samples, but the storage and shipping of such samples can be problematic and expensive. Dried blood spots (DBS) have been routinely used to test for inherited metabolic disorders in neonates (5). Recently, the use of a DBS assay was investigated for the therapeutic drug monitoring of metformin as a monotherapy using high performance liquid chromatography (HPLC) with UV detection (6).
Because metformin is a highly polar molecule, it is difficult to measure using reversed-phase HPLC in combination with mass spectrometry (MS). Electrospray ionization (ESI)-MS-MS using hydrophilic interaction liquid chromatography (HILIC) adequately assays metformin within 2 min per injection with a lower limit of quantification of 0.5 ng/mL from 50 μL of human plasma (7). Sitagliptin is a moderately polar molecule. Tradtionally, LC–MS-MS has been used to measure sitagliptin in plasma samples; however, the reported methodology uses complex extraction schemes and HPLC anaylsis results in analytical cycle times of 2–2.5 min per sample.
Laser Diode Thermal Desorption
Laser diode thermal desorption (LDTD) atmospheric pressure chemical ionization (APCI) tandem mass spectrometry (LDTD-MS-MS) has emerged as a powerful alternative to conventional analysis techniques. LDTD is a direct sample introduction source that does not require HPLC separation before tandem mass spectrometry detection. The technique is capable of introducing multiple analytes to a tandem mass spectrometer (8), although quantitative cassette analysis of multiple analytes from DBS or pharmacokinetic samples has not yet been reported. LDTD effectively reduces analytical cycle times to ~20 s per sample (9).
LDTD uses an infrared laser to thermally desorb analytes coated onto the metallic surface of specially designed plates (for example, LazWell plates, Phytronix Technologies Inc., Québec, Canada) by evaporation of an organic solvent, usually the methanolic final product of an analytical extraction scheme. Each desorption releases neutral gas phase molecules that can be efficiently ionized in combination with an APCI interface. The ions produced are then detected by tandem MS (10). The laser is applied to the plates in a power gradient, giving rise to an MS response similar to a chromatographic peak (Figure 1). Any subsequent quantitation can be done through standard peak integration software.
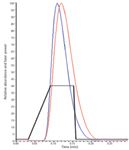
Figure 1
A perceived challenge regarding LDTD is that ion suppression may occur because it is a direct injection technique. When using LC–MS for the analysis of biological fluid samples, sample preparation is required to remove any undesired components that could interfere with results, while trying to retain the target analyte. Without sample preparation before LC–MS analysis, the presence of matrix components in biological fluids can either cause suppression (underestimation) or enhancement (overestimation) of the target analyte response. This results in compromised or invalid data and the selection of drug candidates based on erroneous data. However, LDTD is very robust with regard to ion suppression. A solution with a high salt content (10 mg/mL in water) can be analyzed in LDTD without observing ion suppression. During the thermal desorption process, the salt material stays on the well while the analytes go into the gas phase to undergo APCI, leading to an optimal ionization.
An experiment was performed to demonstrate the efficiency of an LDTD-MS-MS method for the optimized measurement of metformin and sitagliptin concentrations in mouse and human DBS.
Experimental
An LDTD source (manufactured by Phytronix Technologies and licensed to Thermo Fisher Scientific, Waltham, Massachusetts) was used for this experiment. Dried samples were loaded into the LDTD sample manager on specially designed 96-well plates (Phytronix Technologies). The LDTD source was mounted on a mass spectrometer (TSQ Quantum Ultra, Thermo Fisher Scientific, San Jose, California) that was operated in positive-ion selected reaction monitoring (SRM) mode.
An ultrahigh-pressure liquid chromatography (UHPLC) pump (Accela, Thermo Fisher Scientific) and an autosampler (CTC Analytics HTC PAL, Presearch Ltd, Basingstoke, UK) were used to introduce samples to the mass spectrometer for the comparison of metformin concentrations by UHPLC–MS. The chromatographic system comprised a UHPLC column (Kinetix HILIC, Phenomenex, Macclesfield, UK) kept at a constant temperature of 50 °C. A mass spectrometer (LTQ Orbitrap XL, Thermo Fisher Scientific) was used for the UHPLC–MS metformin analysis in mouse blood samples.
An HPLC pump (Surveyor MS Pump Plus, Thermo Fisher Scientific) and an autosampler (CTC Analytics HTS PAL, Presearch Ltd.) were used to introduce the samples to the mass spectrometer for the HPLC comparison of sitagliptin. Chromatography was performed on an HPLC column (Max-RP, Phenomenex). A mass spectrometer (TSQ Quantum Ultra, Thermo Fisher Scientific) was used for the HPLC–MS-MS determination of sitagliptin from mouse blood samples.
Method development
Four separate aliquots of a methanolic standard of each compound (10 μg/mL) were spotted (2 μL) onto a plate and evaporated to dryness in an incubation chamber thermostatically controlled to a constant 37 °C. Each sample was then systematically desorbed by LDTD into the mass spectrometer. To ensure maximum sensitivity and extraction of metformin and sitagliptin from the DBS, several different spot sizes, extraction solution mixtures, and volumes were compared.
Stock solutions of metformin, sitagliptin, and phenformin (internal standard) were prepared in methanol to a final concentration of 1 mg/mL. An extraction solvent was prepared using the phenformin stock solution diluted to a concentration of 0.1 μg/mL in 80:20 (v/v) methanol–water. Samples were prepared by spiking control blood with the appropriate metformin or sitagliptin working solution. The calibration standards were prepared at 5, 10, 50, 100, 500, 1000, 2000, and 5000 ng/mL and the quality controls at 25, 250, and 2500 ng/mL.
Blood (30 μL) was spotted directly onto FTA DMPK-C cards (GE Healthcare UK Limited, Little Chalfont, Bucks, UK). This volume filled the entire sample spot area and ensured that samples did not contaminate each other on the cards. The cards were then left at room temperature for 24 h or heated at 37 °C in an incubation chamber for 2 h before extraction. A 6-mm disk was punched from each DBS and was placed in a fresh sample tube; each tube was then extracted using 200 μL of the phenformin extraction solvent, and the samples were mixed for 90 s. The extraction solvent from each sample was then directly applied to the plates (2 μL per sample) and was allowed to evaporate to dryness in an incubation chamber at 37 °C.
One set of calibration standards from each species was used to construct calibration curves and quantify the subsequent calibration samples and quality controls. All calibration standards and quality controls were used to calculate intra-assay accuracy and precision at each level in each matrix to establish the calibration range for each matrix.
Method Application
Metformin and sitagliptin were co-administered orally to two C57Bl/6 strain mice at a dose level of 50 mg/kg and 5 mg/kg, respectively. The dose formulation was HPMC/Tween (1% w/v polysorbate). Blood samples (20 μL) were taken at 0.25, 0.5, 1, 2, 3, 6, 12, and 24 h post administration; blood was spotted directly from the capillary onto fresh FTA DMPK-C cards that were subsequently stored in a desiccated plastic bag at room temperature.
For the analysis of the mouse pharmacokinetic DBS samples, quality control samples (in duplicate) were interspersed throughout the unknowns. The analytical batch was considered acceptable if the accuracy of each calibration standard used to construct the calibration curve was ±30% of nominal concentration, with the curve constructed from no less than five points. The accuracy of at least 75% of the quality controls was within ±30% of nominal concentration. The linearity of the calibration curve was not less than 0.9801. These acceptance criteria values are deemed acceptable within a drug discovery bioanalytical environment.
The blood concentration time results generated for metformin and sitagliptin by LDTD-MS-MS were compared to results generated by LC–MS methods (UHPLC–MS for metformin and HPLC–MS-MS for sitagliptin). Analytes were extracted for comparison from whole blood (50 μL) by protein precipitation with 200 μL of acetonitrile containing internal standard and subsequent centrifugation. Supernatant (50 μL) was diluted with 300 μL of water before analysis by HPLC–MS-MS. UHPLC–MS analysis comprised direct injection of 50 μL of the supernatant onto the chromatographic system.
Results and Discussion
Extraction with a 200-μL volume of solvent gave the greatest metformin and sitagliptin response (Figure 2). The respective calibration curve did not show any ion suppression effects in terms of reduced internal standard response at the higher calibration levels. Figure 3 shows the area response given by the 100-ng/mL calibration standard from each mouse DBS calibration curve. The recoveries obtained were relatively close between the different percentages of methanol, although 80% methanol gave the greatest response for both metformin and sitagliptin.
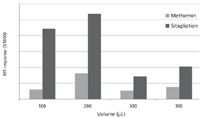
Figure 2
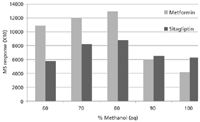
Figure 3 The assay was specific for both metformin and sitagliptin in both mouse and human DBS samples. Figure 4 shows representative raw data obtained upon desorption of an extracted mouse DBS blank sample compared to desorption of a calibration standard in the same matrix at the LLOQ. No significant response was observed for sitagliptin in the blank DBS samples. A response was observed for metformin and sitagliptin in the blank DBS samples, although comparison with the response at the LLOQ revealed that the "blank" response was about 16-fold less for metformin and 20-fold less for sitagliptin.
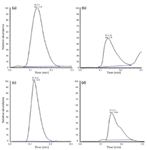
Figure 4Both accuracy and precision were acceptable for use in a drug discovery metabolism and pharmacokinetics environment (Tables I and II). Table III summarizes the inter-assay accuracy (and precision) of quality control samples at three concentrations spanning the calibration range and taken from different analytical batches assayed on different days (n = 6).

Table I

Table II
The stability of metformin and sitagliptin in DBS samples is summarized in Table IV. Mouse and human DBS samples containing metformin and sitagliptin at 25, 250, and 2500 ng/mL (n = 3) were stored for 40 days at room temperature in a sealed plastic bag containing silica gel desiccant before extraction and analysis by LDTD-MS-MS. The % bias of metformin and sitagliptin was less than ±30% of nominal concentration at all levels, indicating the samples were suitable for storage under these conditions for 40 days.
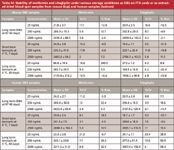
Table IV

Table III
The stability of metformin and sitagliptin was also assessed after storage of extracted quality control DBS samples (n = 3 at each level) at 4 °C in sealed sample tubes both short term and long term. The % bias of metformin and sitagliptin was less than ±30% of nominal concentration at all levels after seven days of storage, indicating short term stability. However, after 40 days of storage the % bias was greater than ±30% for metformin at 25 ng/mL and 2500 ng/mL in mouse and human DBS samples, respectively; and greater than ±30% for sitagliptin at 250 ng/mL in mouse DBS samples and at 25, 250, and 2500 ng/mL in human DBS samples, indicating that the storage of extracts for this length of time was not possible. The increase in % bias between seven and 40 days probably resulted from the highly organic nature of the extraction solvent evaporating over time.
Samples from a cassette oral pharmacokinetic study of metformin dosed at 50 mg/kg and sitagliptin dosed at 5 mg/kg to male C57Bl/6 mice were evaluated by LDTD-MS-MS. The mean blood concentration time profiles for the analytes are shown in Figure 5. The pharmacokinetic parameters derived from the analysis are listed in Table V. The maximum sample concentration (Cmax) was calculated to be 3.6 ± 0.343 μg/mL and 0.4 ± 0.043 μg/mL for metformin and sitagliptin, respectively. The time at which the maximum concentration occurs (Tmax) was reached at 1 h post-dose for both compounds. The oral half-life of metformin (T1/2) was 4.4 ± 0.346 h with an area under the blood concentration time curve (AUC0–∞) of 25.6 μg∙h/mL. Sitagliptin had an oral half-life of 3.4 ± 0.147 h and an area under the blood concentration-time curve of 3.6 ± 0.250 μg∙h/mL.
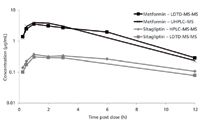
Figure 5
The DBS concentration time profiles for metformin and sitagliptin were compared to data from fresh whole blood taken from the same animals as the DBS samples but analyzed by conventional LC–MS (UHPLC–MS for metformin and HPLC–MS-MS for sitagliptin). The % bias between the LDTD-MS-MS results and those generated by LC–MS was less than ±30% at all time points, further validating the LDTD-MS-MS results. The comparative pharmacokinetic parameters are listed in Table V and show good agreement between LDTD-MS-MS and the more conventional LC–MS approach.

Table V
The data generated for metformin and sitaglitin from this pharmacokinetic study was subsequently used to predict efficacious doses for a mouse acute efficacy test.
Conclusion
LDTD-MS-MS is a powerful method for the therapeutic drug monitoring of metformin and sitagliptin concentrations in mouse and human DBS samples. The technique provides high throughput and is sensitive and robust, enabling simultaneous quantitation of the two drugs. Analytical run times are considerably reduced and the ability of LDTD-MS-MS to quantify multiple analytes in a single desorption increases the overall efficiency. When modern high resolution instruments are operated in full scan mode, the need to optimize compounds for parent and product ion transitions is eliminated, further improving efficiency.
Acknowledgment
The authors thank Jim Koers of Thermo Fisher Scientific (San Jose, California) as well as Mark Harrison and Sarah Horsley from Thermo Fisher Scientific (Hemel, Hempstead, UK) for their support throughout this work and for the loan of the LDTD interface.
The data in this article are discussed at length in the Journal of Pharmaceutical and Biomedical Analysis (11).
References
(1) Food and Drug Administration, NDA 21-178/S-007, GLUCOVANCE (Glyburide and Metformin HCl Tablets), http://www.accessdata.fda.gov/drugsatfda_docs/label/2004/21178se5-007_glucovance_lbl.pdf.
(2) Food and Drug Administration, Sitagliptin (marketed as Januvia and Janumet) Information, http://www.fda.gov/Drugs/DrugSafety/PostmarketDrugSafetyInformationforPatientsandProviders/ucm183768.htm.
(3) J.B. O'Sullivan and C.M. Mahan, Diabetes 13, 278–285 (1964).
(4) UK Prospective Diabetes Study Group, Lancet 352, 854–865 (1998).
(5) J.H. Dussault, P. Coulombe, C. Laberge, J. Letarte, H. Guyda, and K.J. Khoury, Pediatr. 86, 670–674 (1975).
(6) S. AbuRuz, J. Millership, and J. McElnay, J. Chromatog. B 832, 202–207 (2006).
(7) A. Liu, and S.P. Coleman, J. Chromatogr. B 877, 3695–3700 (2009).
(8) J. Wu, C.S. Hughes, P. Picard, S. Letarte, M. Gaudreault, J.F. Levesque, D.A. Nicoll-Griffith, and K.P. Bateman, Anal. Chem. 79, 4657–4665 (2007).
(9) J.G. Swales, R.T. Gallagher, and R.M. Peter, J. Pharm. Biomed. Anal. 55(3),740–744 (2010).
(10) P. Picard and P. Tremblay, "Real Paquin, E.," Presented at the 57th ASMS Conference on Mass Spectrometry and Allied Topics, Philadelphia, Pennsylvania, 2009.
(11) J.G. Swales, R.T. Gallagher, M. Denn, R.M. Peter, and N. Duczak, J. Pharma. Biomed. Anal. 55(3), 544–551 (2011).
John G. Swales, Richard T. Gallagher, Mark Denn, and Raimund M. Peter are with AstraZeneca, Discovery Drug Metabolism and Pharmacokinetics, Cardiovascular & Gastrointestinal Research Area, in Macclesfield, Cheshire, UK. Direct correspondence to: john.swales@astrazeneca.com.
Nick Duczak is with Thermo Fisher Scientific in San Jose, California.
Regulatory Deadlines and Supply Chain Challenges Take Center Stage in Nitrosamine Discussion
April 10th 2025During an LCGC International peer exchange, Aloka Srinivasan, Mayank Bhanti, and Amber Burch discussed the regulatory deadlines and supply chain challenges that come with nitrosamine analysis.


