Headspace Sampling
LCGC North America
A clear understanding of the chemical system of the sample in headspace - and how temperature and peak volume affect peak areas, sensitivities, and repeatability - will improve headspace analysis.
Headspace sampling for gas chromatography (HSGC) prevents nonvolatile residue accumulation in the inlet and column entrance while simplifying sample preparation. This installment of "GC Connections" addresses some of the details of static HSGC theory and practice for conventional liquid-phase headspace samples, with the goal of better understanding and controlling the analytical process.
Many samples for gas chromatography (GC) contain significant amounts of non-analyte materials in the sample matrix. With direction injection, very strongly retained solutes and nonvolatile residual materials will remain in the GC system post-analysis and may accumulate to a degree that eventually interferes with ongoing separations. Typical symptoms of this situation include loss of peak area, peak tailing, formation of more-volatile breakdown products, increased column bleed, and a greater number and size of ghost peaks. The introduction of large amounts of extraneous material may eventually compromise the instrumentation itself. Remedies include inlet liner replacement, trimming off the beginning of the column, installation and regular replacement of an uncoated precolumn, column bakeout, column solvent washing, and column replacement.
It is better to prevent such difficulties in the first place. In cases where contaminants are volatile enough to be eluted after the peaks of interest, column backflushing may remove the residues by purging the column with reversed carrier gas flow. A recent "GC Connections" installment described the basics of column backflushing (1). Backflushing will not work when nonvolatile materials are present. The contaminating substances are permanently entrained inside the column and no amount of reverse carrier flow or increased column temperature will remove them.
Classical wet sample preparation provides an obvious route to cleaner injections via derivatization, extraction, filtration, and related techniques that preseparate analytes from contaminating sample matrix material. Chemically active procedures may involve hazardous materials, which detract from the usefulness of derivatization by imposing material safety and disposal requirements. In addition, recoveries and reproducibilities of a multistep procedure might not be as good as more direct methods that have fewer steps.
Simpler methods for managing difficult sample matrices are sometimes better than extensive sample preparation. Direct sample injection accompanied by inlet liner replacement every few injections can turn out to be easier and less expensive than a complex sample preparation procedure. I have seen this many times. In one example, a laboratory technician once described to me a very satisfactory direct-injection analysis of whole blood carried out with single-use inlet liners. Of course, such an expedient does not lend itself well to automation, at least not without a liner-changing robotic arm.
Headspace Sampling
Headspace sampling (HS) keeps sample residues from entering the GC inlet by holding the entire sample matrix in a vial while transferring volatile components into the GC inlet and column. Nonvolatile contaminants remain behind in the headspace vial and do not accumulate in the inlet or the column. Chromatographers generally divide headspace sampling into two main subgenres: static and dynamic. These terms refer to how gaseous analytes are removed from the sample: either dynamically, by sweeping with inert gas, or statically, by allowing analytes to enter the gas phase driven only by thermal and chemical means.
In static HSGC, the sample is sealed in a gas-tight enclosure — such as the standard 22-mL headspace vial used in many laboratories — and held under controlled temperature conditions. Volatile material from a condensed (liquid or solid) sample enters the headspace, the enclosed gas phase above the sample, of the vial. After a period of time a portion of the accumulated sample gas is transferred onward to the GC column.
In equilibrium static HSGC, sufficient time is allowed for the concentrations of the gaseous components to become steady and reach equilibrium before sample extraction and transfer. For certain samples, such as polymers or solids, the equilibrium state may be difficult to attain. In such cases, multiple sample extraction steps may be used, followed either by multiple GC analyses, one per extraction step, or by accumulation of the products of each discrete extraction in a concentrating trap followed by desorption for a single GC analysis.
In dynamic headspace sampling, sample is contained in a vessel through which gas can flow in a controlled manner. Inert gas, usually carrier gas, passes through or around the sample continuously during the sampling period. Volatile compounds released from the sample are swept into the gas stream, exit the sample container, and subsequently are retained in an adsorptive trap.
After a sufficient amount of sample has accumulated, the trap is heated to desorb the trapped volatiles onto the GC column. Dynamic headspace sampling is the basis for purge-and-trap analysis of volatiles in water. Volatiles emitted from difficult materials such as hard-disk media, for example, can be sampled by the technique as well with specialized sampling vessels.
Static and dynamic HSGC are both versatile sampling techniques; many types of sample can be handled by either technique. Often the choice of headspace sampling technique is mandated by regulatory requirements. The analysis of volatiles in pharmaceutical intermediates and products, for example, is performed with static headspace sampling according to the United States Pharmacopeia National Formulary (USP–NF) General Chapter <467> on Organic Volatile Impurities/Residual Solvents, or with similar methods that exist in Europe and other areas of the world. In the United States, determination of low-solubility volatiles in drinking water is performed by dynamic headspace sampling as described in the United States Environmental Protection Agency (USEPA) Method 524.2 for purge-and-trap sampling and capillary GC analysis.
Static Headspace Sampling
A major difference between headspace and direct injection lies in the behavior of the volatile analytes. When a sample is injected directly into a GC inlet, essentially all of the sample material enters the inlet system. For the sake of discussion, we will ignore well known vaporizing inlet effects such as mass discrimination, thermolysis, and adsorption.
In static headspace sampling, the chemical system of the sample in the headspace vial directly affects the transfer of volatiles into the GC column. A clear understanding of this chemical system and its effects on the chromatographic results provides analysts with an opportunity to improve the quality of their analyses.
At equilibrium, the chemical system inside a sealed static headspace vial can be characterized with a conventional theoretical treatment. Figure 1 illustrates such a system for a two-phase sample system and names its more important physico–chemical characteristics, such as the volumes of the liquid phase, VS, and the gaseous phase, VG, and the concentrations at equilibrium of individual analytes in the liquid phase, CS, and in the gas phase, CG. Figure 1 shows conceptually the migration of solute molecules into and out of the liquid and gas phases.

Figure 1
The gas-phase concentration of each analyte is the quantity measured by a GC analysis, not their concentrations in the liquid sample phase. We want to know what the analyte concentrations were in the sample phase before migration into the gas phase commenced. The headspace vial chemical system has two characteristics that determine the relationships between the original solute concentrations in the sample and their measured gas-phase concentrations.
First, to determine the original analyte concentrations, C0, in the liquid phase before headspace sampling starts, we need to consider the partition or distribution coefficient at equilibrium, K, which is the ratio of a compound's concentration in the liquid phase to that in the gaseous phase:

The distribution coefficient is strongly influenced by the temperature and the chemical nature of the liquid phase in relation to the solutes. Generally, K will decrease as the temperature increases, signifying a rise in gas-phase concentrations. Conversely, K will increase for liquid-phase compositions in which analytes are more soluble. Good solubility control is essential. As we will see, both the temperature and the chemical composition of the sample strongly influence measured gas-phase analyte concentrations.
Second, the ratio of the gaseous to liquid-phase volumes in the vial plays a secondary but crucial role in determining analyte concentrations in the two phases at equilibrium. This ratio is termed the phase ratio, β:

With a bit of mathematical derivation, which I will omit for the sake of brevity (see http://wiki.hrgc.com for a more complete treatment of headspace theory), it can be shown that the original solute concentration in the liquid phase is related to its concentration in the gas phase, the distribution coefficient, and the phase ratio by this relationship, sometimes termed the headspace equation:

Note that the sum of K and β controls the gas and liquid phase concentrations, not either parameter separately.
For static HSGC, control of K and β via stringent temperature regulation and precise volume measurement, along with consistent sample preparation, are paramount to obtaining the best results. If the analytical conditions are well controlled, then K and β will remain essentially constant across a series of analyses. Calibration by standard addition or external standard methods using the same sample matrix system as the analytical samples is then easily performed. The K and β terms become part of the instrumental calibration coefficient for each analyte along with other factors such as the sample gas volume transferred to the column and the detector response itself.
Take Control of the System
The relative magnitudes of K and β influence how analytes' gas-phase concentrations are affected by temperature and sample volume, and by the sample phase composition. With a little knowledge about how the enclosed chemical system in a headspace vial works, chromatographers can understand and, if the situation permits, take control of these aspects of their headspace analyses.
The equilibrium gas-phase concentration in the headspace, measured by the GC, can be expressed from equation 3 in this manner:

So, as the sum of K and β decreases, gas-phase concentrations increase, and peaks become correspondingly larger. K is a function of the temperature and the closed-system chemistry in the vial, and β is a function of the volumes of sample and gas in the vial. We'll examine how different situations for these factors affect both the sizes of peaks and their repeatability for a highly soluble analyte, ethanol, and a not-so-soluble analyte, n-hexane, both in water.
Temperature Effect
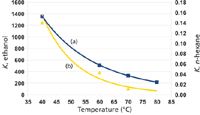
The distribution coefficient of both analytes in water depends on temperature in a logarithmic relationship. Figure 2a graphs the distribution coefficient of ethanol in water as a function of temperature. The ethanol distribution coefficient is large, on the order of 200–1350 across a temperature range of 80–40 °C. Unlike ethanol, n-hexane is relatively insoluble in water. Its distribution coefficient changes with temperature by about the same relative magnitude as for ethanol, as shown in Figure 2b, but the absolute values only range from 0.01 to 0.15 across the same temperature range.

Figure 2
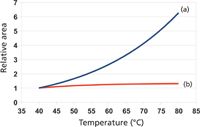
For compounds with high solubility in the liquid phase, like ethanol in water, where K >> β, the distribution coefficient dominates gas-phase concentrations in the relationship of equation 4, so small changes in vial temperature can cause large changes in the gas-phase concentrations and consequently in the measured peak areas. Figure 3a graphs the changes in relative peak areas as temperatures increase for the ethanol–water system with constant liquid sample volume in the headspace vial. The relative ethanol areas increase 6.3-fold, going from 40 °C to 80 °C. For soluble compounds like ethanol, peak areas are very sensitive to even small temperature changes. A shift from 60 °C to 62 °C will increase the ethanol peak area by nearly 10%.

Figure 3
Conversely, for low-solubility compounds like n-hexane in water, where K << β, the influence of the distribution coefficient on gas-phase concentrations is small, and temperature shifts have little effect. The relative areas increase by about 1.3-fold going from 40 °C to 80 °C, much less than for ethanol but still a healthy increment. For a 2 °C increase, though, the effect is negligible, at about 0.1%.
Sample Volume Effect
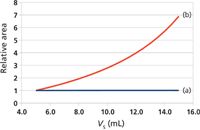
The liquid sample volume, in the form of the phase ratio (equation 2), influences the gas-phase concentration strongly for compounds that are less soluble. In the case of n-hexane, where K ≈ 0.04 at 60 °C, β >> K across a full range of sample volumes, so changes in the sample volume can be expected to strongly influence the gas-phase solute concentration. Figure 4b shows a relative n-hexane area increase of 6.8-fold when going from 5 mL to 15 mL of liquid sample at a constant 60 °C temperature. An incremental change in volume of 0.2 mL would increase peak areas by around 5%.

Figure 4
For ethanol in water, where K ≈ 500 at 60 °C, changes in the comparatively small phase ratio have essentially no influence on the gas-phase concentration. Figure 4a graphs a nearly straight line for relative ethanol areas across the entire 5–15 mL sample volume range, where the areas increase by only 0.5%. The effect of a 0.2-mL volume increment is negligible.
Higher Sensitivity
Some samples may not deliver as much method sensitivity, in the form of sufficient lower limits of quantitation (LOQ), as may be desired. Headspace system sensitivity is a function of solubilities as well as phase ratios. Assuming there is some latitude in the methodology, sensitivity can be increased by taking steps to reduce both K and β.
With direct injection sampling techniques, larger sample sizes will produce larger peaks for all the compounds in equal proportion. It would seem intuitive that the same is true for headspace sampling, but in fact this is only partially true. Take a look at the relative areas for ethanol and n-hexane shown in Figure 4. The data are for increasing volumes of the same concentration in water of each component, yet only the n-hexane exhibits areas that increase with the sample volume.
There is little net gain to be had from increasing the sample volume for highly soluble analytes such as ethanol in water. With a very large distribution ratio, the smaller phase ratios that result from larger sample volumes will not influence the sum of K and β, and so areas will not increase.
Keep in mind that headspace samplers have a limit for sample volume as imposed by the sampling needle's bottom-most position. It is imperative to avoid any possibility of the needle contacting the liquid sample phase, as this will contaminate the needle and cause sample carryover.
Higher vial thermostating temperatures do have a strong influence on the distribution constant and can be used to advantage, with a limit. For soluble compounds such as ethanol in water, higher temperatures will produce higher sensitivities, but this is not so with low solubility compounds like n-hexane where areas are largely independent of the temperature.
A cautionary note is required here: the vapor pressure of water increases exponentially with temperature, as do the vapor pressures of other common solvents. If too-high vial thermostating temperatures are used, the risk of a vial explosion becomes a real possibility. For this reason, always use headspace vials with pressure-relieving septum caps, and avoid excessively high vial temperatures. Some samples may begin to decompose at higher temperatures with concomitant degradation of results.
As an alternative to increasing the temperature of aqueous HSGC samples, adding a salt such as NaCl or K2CO3 will shift the distribution of highly soluble components toward the gas phase, much as if the temperature had increased. Generally, a large amount of salt is required for a significant effect in aqueous samples, on the order of 25–50% w/v. Such salting-out has been applied successfully to biological samples, where the ionic strength of the sample, which influences solubility, may vary considerably; the added salt obliterates any ionic-strength effects. The salt itself may be a source of interferant peaks and should be baked out and stored under controlled sealed conditions to avoid uptake of volatiles in ambient air.
Better Quality
Large changes in headspace sample volumes and thermostating temperatures may not lie within the permitted discretionary range in some regulated situations. Even in such cases, however, there may be room for improvement in the quality of the results by paying more attention to technique and to instrument condition and calibration.
As noted above, area counts in headspace sampling are influenced strongly by both temperature and sample volume. Temperature effects dominate highly soluble compounds, while volume effects dominate less-soluble compounds. Analytes that are intermediate in their solubility will experience a blended effect from both temperature and volume.
Temperature instabilities of as little as 2 °C will produce nearly a 10% shift in peak areas for compounds like ethanol, while a volumetric uncertainty of as little as 0.2 mL will move peak areas by something like 5% for low-solubility materials. Therefore, precise and repeatable measurement of the sample volume and total dry vial volume become very important for attaining the best repeatability of the results.
Accuracy, stability, and consistency in the headspace thermostating temperature are critical as well. Most modern headspace samplers have excellent thermostatting oven performance, but some older units may fall short. The manufacturer should provide a procedure for testing and validating the vial-to-vial temperature variability, which can be accomplished with a solution of 0.1% v/v aqueous ethanol.
For the best cross-instrument results repeatability, calibrate each headspace sampler's thermal zones regularly with a certified probe. Again, the manufacturer can provide an appropriate procedure.
The use of the correct vial type also is extremely important with respect to temperature. Each manufacturer will specify the type of vials that are certified with their headspace system. Vials that fit poorly or too tightly will not only have variable temperatures but also will not heat at the same rate, which can affect the thermostating time. Seriously misfitting vials may break inside the thermostated zone, resulting in unwanted down time for clean-up.
So, even within the parameters of a mandated headspace method, careful attention to the details of sample preparation and headspace temperature can help improve the quality of results. Careful calibration of volumetric devices and headspace sampler temperatures will help ensure better method reproducibility across multiple laboratory locations.
Conclusion
This first foray into headspace sampling has touched upon the fundamental physico–chemical effects that give rise to the basic characteristics of static equilibrium headspace sampling of liquids. We've examined how temperature and sample volume affect peak areas, sensitivities, and repeatability for two quite different compounds, and have touched briefly on some instrumental considerations. Future installments will address a long list of additional important headspace topics including equilibration time, solvent composition, sample transfer into the GC column, sample pressure, and many more.
References
(1) J.V. Hinshaw, LCGC North America 29(7), 576–582 (2011).
(2) B. Kolb and L.S. Ettre, Static Headspace–Gas Chromatography: Theory and Practice (J. Wiley & Sons, Hoboken, New Jersey, 2006).

John V. Hinshaw John V. Hinshaw "GC Connections" editor John V. Hinshaw is Senior Scientist at BPL Global, Ltd., Hillsboro, Oregon, and a member of LCGC's editorial advisory board. Direct correspondence about this column to the author via e-mail: lcgcedit@lcgcmag.com.

New Method Explored for the Detection of CECs in Crops Irrigated with Contaminated Water
April 30th 2025This new study presents a validated QuEChERS–LC-MS/MS method for detecting eight persistent, mobile, and toxic substances in escarole, tomatoes, and tomato leaves irrigated with contaminated water.

.png&w=3840&q=75)

.png&w=3840&q=75)


.png&w=3840&q=75)


.png&w=3840&q=75)


