It’s Qualification, But Not As We Know It?
Qualification and calibration of high performance liquid chromatography (HPLC) chromatographs is a regulatory requirement, but how proscriptive should guidance be?
This column has discussed the qualification of chromatographs several times, particularly following the update of the United States Pharmacopeia (USP) General Chapter <1058> on Analytical Instrument Qualification (1–5). USP <1058> describes qualification in a number of stages:
- User requirements specification (URS)—writing a laboratory URS to define the intended use of the chromatograph;
- Design qualification (DQ) or the fit of the selected instrument to the laboratory URS;
- Installation qualification (IQ)—installation and integration of the components including any software to control the instrument;
- Operational qualification (OQ) to demonstrate that the instrument meets the requirements in the laboratory URS;
- Performance qualification (PQ) to monitor the operational use of the instrument including checks that a chromatograph can still meet the requirements in the URS. PQ also includes repairs, maintenance, and requalification.
The overall process is shown in Figure 1. The key element is the laboratory URS, which should not be a copy of the supplier’s specification, and which is critical to define the intended use as required by USP <1058> (1) and EU GMP Annex 15 (6).
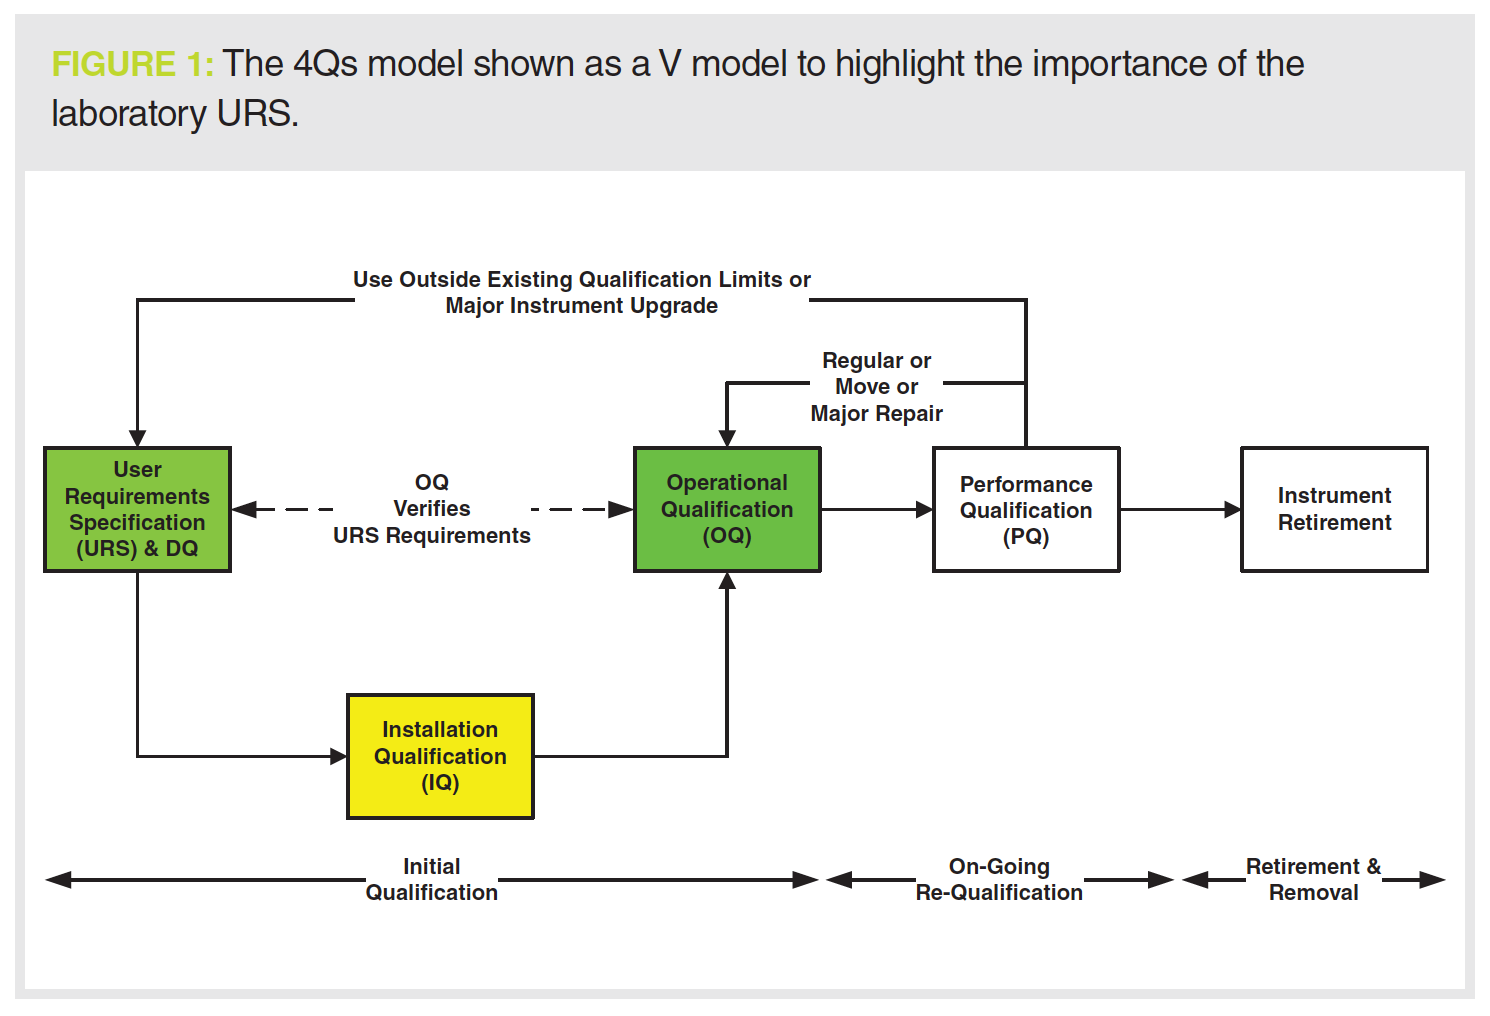
Put simply, it is not possible to qualify a chromatograph without a URS.
The reason is that the intended use is not defined and this is a noncompliance with 21 CFR 211.63 (7), EU GMP Chapter 3.34 (8), and Annex 15 clause 3.2 (6).
A Qualification Protocol Dissected
You may wonder why we have quoted that well-known analytical instrument qualification (AIQ) expert, Commander Spock, in the title of this column. We have found a qualification protocol for high performance liquid chromatography (HPLC), but it is called Calibration of HPLC. In this column, we will discuss a selection of the tests from the perspective of scientific soundness and usefulness to industry and then reveal the source.
Qualification or Calibration?
The title of the protocol is Calibration of HPLC. The title of USP <1058> is Analytical Instrument Qualification. Is there a difference between qualification and calibration? The definitions below are from the EU GMP glossary (9):
- Calibration: The set of operations which establish, under specified conditions, the relationship between values indicated by a measuring instrument or measuring system, or values represented by a material measure, and the corresponding known values of a reference standard.
- Qualification: Action of proving that any equipment works correctly and actually leads to the expected results. The word validation is sometimes widened to incorporate the concept of qualification.
- Validation: Action of proving, in accordance with the principles of Good Manufacturing Practice, that any procedure, process, equipment, material, activity, or system actually leads to the expected results (see also qualification).
From these definitions, calibration is essentially modular, focused on components of equipment, and qualification and validation are holistic, focused on the whole system. However, there is a complication in that US GMP uses the term calibration as originally issued in 1978 (10) and the term qualification in USP <1058> effective 2018 (1).
Where’s the URS?
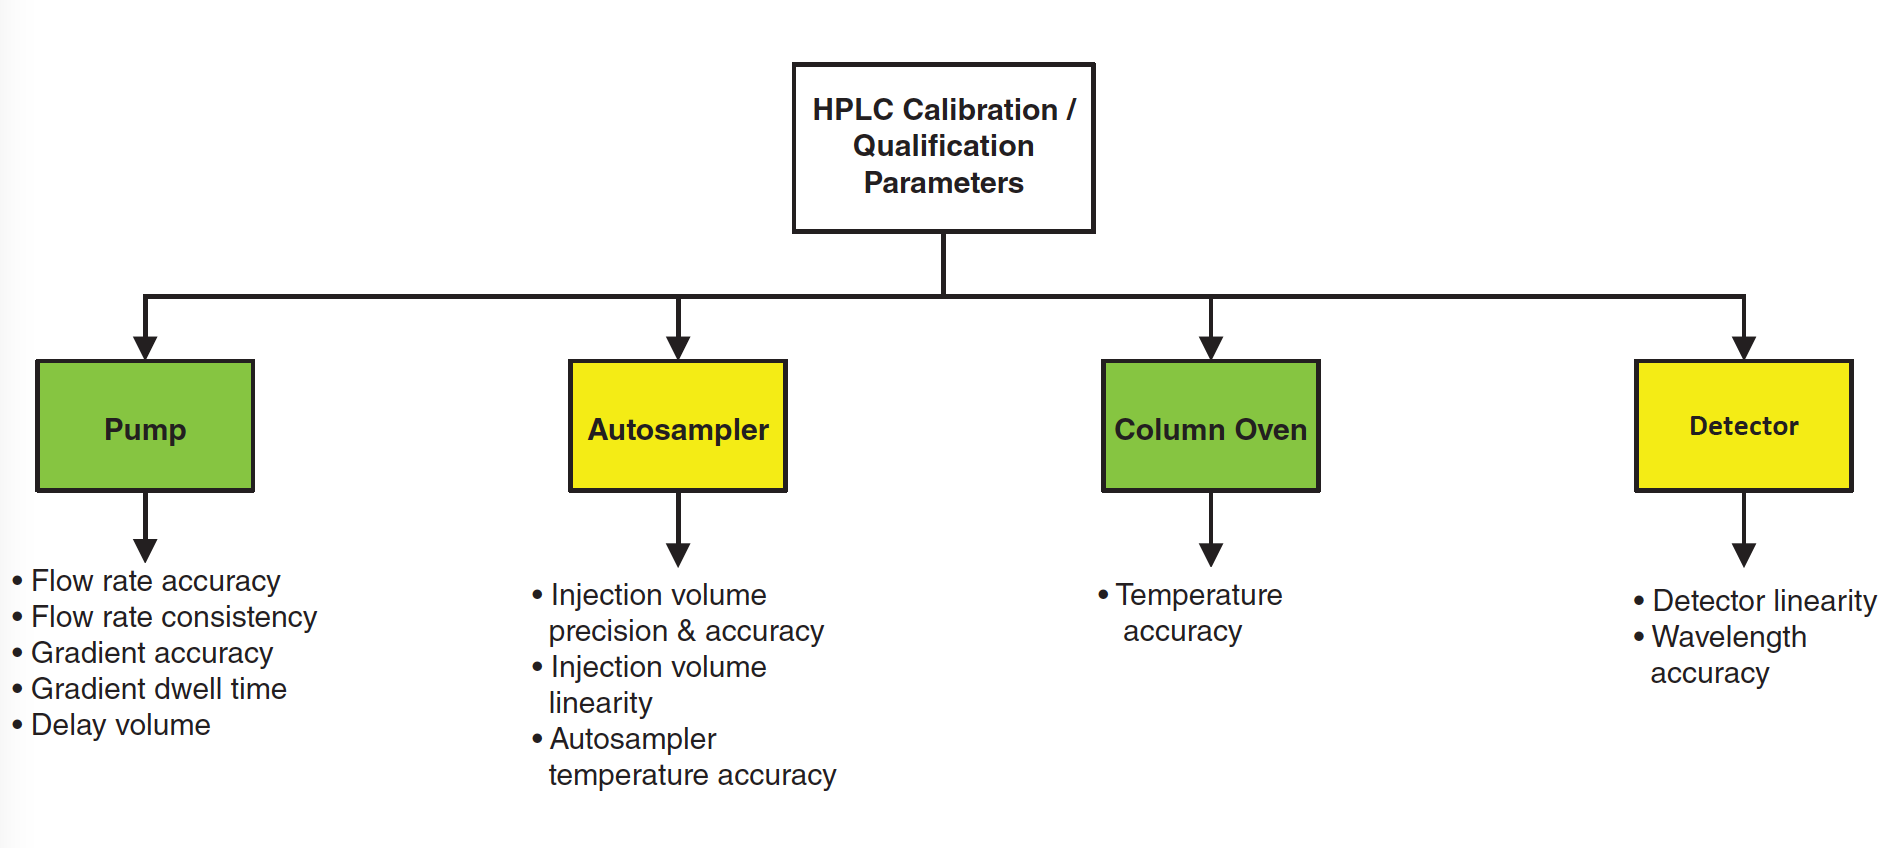
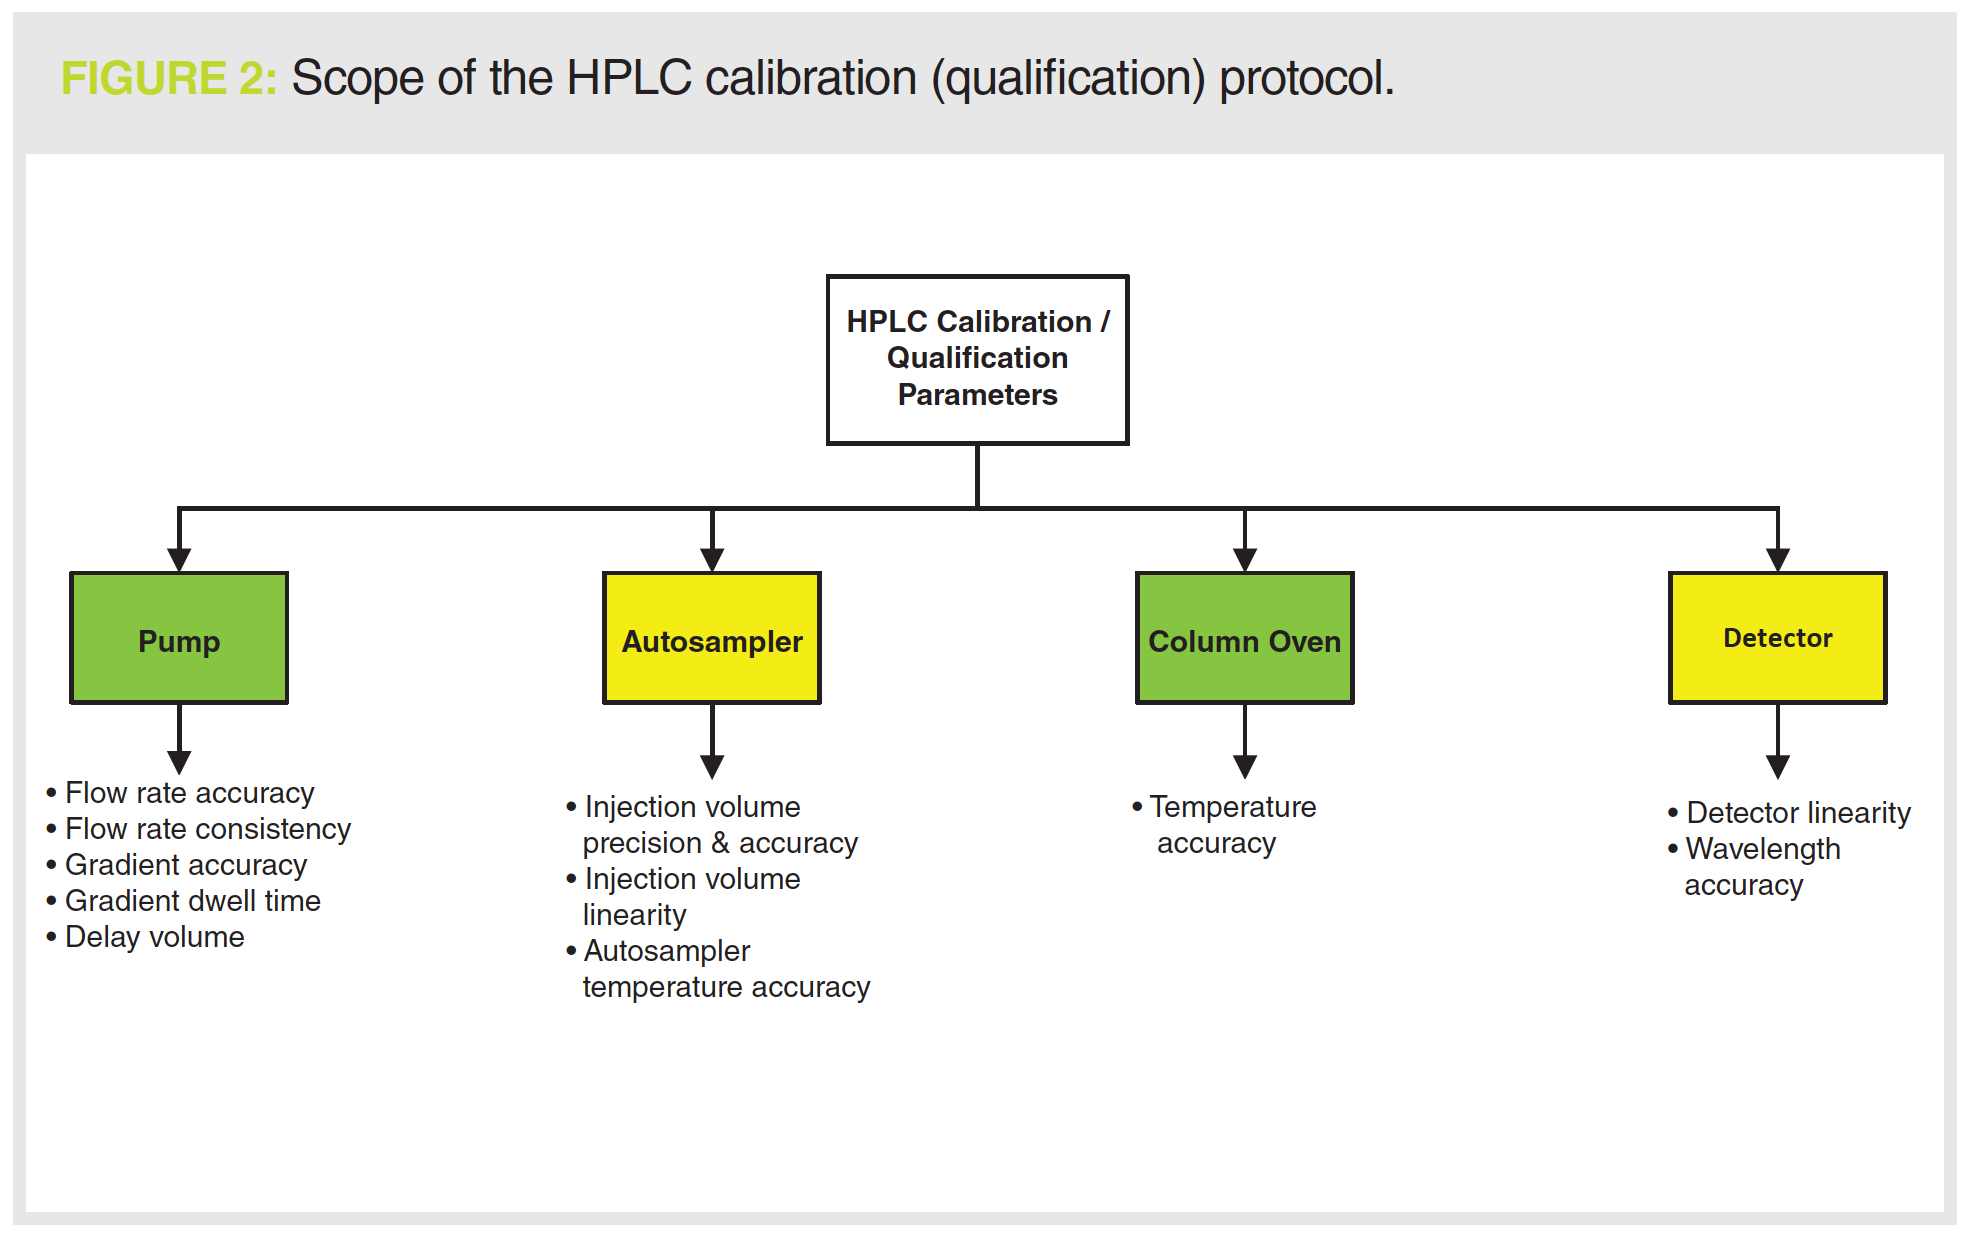
Reading through the protocol shown in Figure 2, there is no mention of a URS for the instrument, which should define the operational parameters of the instrument, together with the range and tolerances for each. Suggestions for how to write a URS for an HPLC system were discussed in an earlier Questions of Quality column (11). The problem is that without a cross‑reference to the URS you can’t qualify or calibrate the chromatograph as the intended use has not been defined (1,6–8). To be fair to the protocol, there are acceptance criteria for the tests being performed, but there is no mention of review, authorship, or quality oversight of the protocol before testing.
Documenting the Work
At the back of the protocol, there is a one-page summary report form for documenting the work. To misquote Commander Spock: it’s a report, but not as we know it. There are many problems:
- An uncontrolled blank form! Several regulatory guidance documents (12–16) require blank forms to be uniquely numbered and reconciled, and this column has featured our discussion on this topic previously (17). How many attempts will be made before passing results are obtained?
- No space to write results! There is no space to enter the replicate values for measuring pump flow rate. This is a classic design error and is a noncompliance with EU GMP chapter 4.6, which requires that handwritten entries have sufficient space for entry. Also, there is no space to calculate the mean flow rate from the two measurements performed at each flow rate (18).
- Where are the electronic records? There is no mention that some of the records generated when executing some tests will be electronic as a chromatography data system (CDS) is required to operate the chromatograph. This will acquire, process, and store the electronic records generated.
- No traceability! There is no space to record any of the reference materials (for example, source and batch number of caffeine standard and its preparation details) or document the digital thermometer and calibrated probe used to measure the column oven temperature.
- No space for deviations! Will all tests be executed as planned? Will all results be within acceptance criteria? If the answer to either question is no, then where is the deviation recorded?
- No release statement! There is no statement that the chromatograph passes all tests and is released for operational use. Also, there are only performed by and verified by signatures for completion of the work, with no quality oversight. The second person verification process must include a critical review of the recorded values and documented evidence.
In the current data integrity environment, correction of all these mistakes is essential.
Pump Flow Rate Accuracy
Keep in mind that the regulatory requirement is to show an instrument is fit for intended use. You would think that when qualifying the pump in isocratic mode, you would use a column to provide sufficient back pressure on the pump. Not with this protocol! We remove the column and measure the time to fill a 10 mL volumetric flask twice at 1.0, 2.0, and 3.0 mL/min and use the time to fill the flask to determine the flow rate. There are one or two problems:
- No column = no pump qualification: As there is no back pressure as found in operational use, this test does not reflect intended use.
- Inaccurate timing: Timing should stop when the water reaches the meniscus of the volumetric flask. However, this approach is inaccurate and error-prone, especially at 3.0 mL/min with water cascading into a flask like Niagara Falls. The acceptance criteria are ±2.0%, but how much error is generated by the manual time measurement and looking at a meniscus?
- Right flow rates? The other issue is how many laboratories run at 3 mL/min? Not many in our experience. If you want a flow rate <1.0 mL/min, there is no test available (with or without a column).
- Where’s the documented evidence? Where are the timings recorded of the two determinations recorded?
If you analyze samples without a column this test is great. If not, this test should be flushed down the toilet bowl of scientific nonsense. Now can you see the reason for the title of this column? But wait, there’s more!
Flow Rate Consistency
This test uses a column! It uses the retention time consistency from six injections of a caffeine solution at a flow rate of 1.0 mL/min. Problems with this test are:
- No mention how data should be stored in the CDS;
- The blank form only has space for the final result with no linkage to the source data;
- There is no mention of how the relative standard deviation (RSD%) is calculated by the CDS, spreadsheet (don’t!) (19,20), or calculator.
This is a data integrity nightmare waiting to happen.
Redesign the Flow Rate Tests
We suggest condensing the two tests into one. Use a calibrated digital flow meter and do the test at the upper and lower flow rates used by your laboratory. Measure each six times and obtain both a better measure of accuracy and precision. Oh, and make sure you connect a column before you start.
Testing the Gradient Profile
This test occupies nearly three pages of the protocol and goes into much—probably too much—detail, with multiple changes in gradient mixing using acetone in one of the mobile phase components. Except there is no column and consequently no back pressure! There are two tests for gradient mixing:
- A combination of channels A and B versus channels C and D
- Channel A versus C
The problem with this proscriptive approach is that most laboratories do not use a quaternary gradient system this way. Channels A and B are used for mixing an isocratic mobile phase or the gradient, and channels C and D are used for post-analysis flushing of the system and preparing the column for storage. At the risk of boring you, test the system as you intend to use it!
Column Oven
The test is described in four bullet points. Forget any specification for intended use. You will test the column oven at 60 ºC, 50 ºC, 30 ºC, 20 ºC, and 10 ºC. Where to start with this litany of unscientific rubbish?
No probe placement: There is no instruction where to place the calibrated probe, you could end up measuring the air in the oven. What really matters is the column temperature, not the air temperature!
No column (again): As there is no column or flow rate defined, this is another meaningless test.
Death by compliance: The basic principle of qualification and calibration is that you test at the limits of the documented operating range and interpolate. Here, there are single measurements at 10˚C intervals over the range of testing.
Single measurement: There is only a single measurement lasting 10 min after setting the temperature. Most sequences last much longer than this and there is no attempt to assess the consistency of the oven temperature over time.
Are You Lazy?
Rather than death by compliance, why not run tests in parallel to save time and effort? For example, by combining meaningful and scientifically sound flow uncertainty and oven temperature tests you can get a better understanding of how the oven temperature works over a longer time, with several measurements at intervals and the top and bottom of the predefined temperature range with a column. This will be closer to intended use than a single measurement of oven temperature.
Detector Wavelength Accuracy
Houston, we have a problem. The detector wavelength accuracy is measured using caffeine. What do we need from a wavelength standard? Needle sharp peaks and traceability of measurement is fine with a holmium solution.
Caffeine? No.
Traceable? Even with a pharmacopoeial standard, read the certificate of analysis. Does it say wavelength standard and traceability of measurement? No.
It also fluoresces, which is not good news for absorbance-based detectors.
Two advantages of including caffeine in a wavelength accuracy check are the 205 nm peak and that the broad shape of each peak will be closer in shape to the materials being tested. However, this needs to be offset by the need to also include a suitable metrology standard, such as a traceable rare earth solution.
The wavelength accuracy limits for a variable wavelength detector are ±2 nm, but the stated limits for HPLC detectors in USP <621> are ±3 nm (21). Testing a detector with tighter criteria than the pharmacopoeial requirement is not recommended.
Furthermore, there is no sensitivity specification for a diode array detector (DAD). The practice of injecting solutions at different detector wavelengths is an attempt to automate the measurement. It should be noted that variation in the peak area will include contributions from both the autosampler and any wavelength dependent measurements.
Killing Three Birds With One Stone
Are you even lazier? Why do three experiments when one will do? Why use water and make approximations when it is not necessary? This combined test will check autosampler precision, linearity, and accuracy:
- Prepare a 1 mg/mL caffeine solution as directed.
- Prepare a 10 ppm caffeine solution by dilution with the mobile phase (1:100 dilution) at laboratory temperature (1 mg/mL is 1000 ppm).
- Weigh a 25.0 mL aliquot of the mobile phase used and calculate the density, PMP.
- Place the 10 ppm caffeine solution into a HPLC vial then seal and cap it.
- Weigh the vial, w1g, on a 4 place analytical balance and put into the autoinjector.
Then perform the following injection sequence:
1. Six 20 µL injections as a system suitability test (SST) for precision determination of peak area (total 120 µL)
2. Two injections each at 5, 10, 50, and 100 µL (total 370 µg/mL)
3. Perform linear least squares regression on mean peak areas:
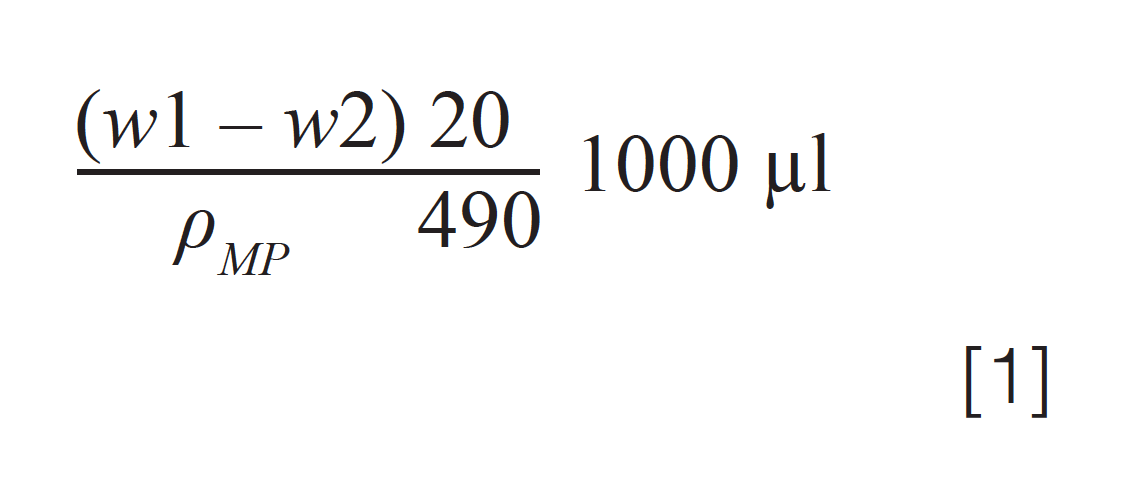
4. Reweigh the autosampler vial after the total injection volume of 490 µL, w2g
5. Calculate from the weight difference (w1-w2)g. From the density of the mobile phase, calculate the average volume of a 20 µL injection and compare with the acceptance criteria:
Modular Versus Holistic Qualification
The major failures of this protocol are that there is no holistic test of the chromatograph as discussed in an earlier column (5), and that calibration of modules is not considered from the intended use and appropriate SSTs for the analytical methods used (for example, defining appropriate retention windows for peak labelling). The tests in the protocol are modular tests on chromatograph components, but there is no overall holistic test of the instrument to show that the whole works as expected.
In the classic article on HPLC qualification, Furman et al. (23) presented the case for both qualification of the chromatograph modules and a holistic test for the whole instrument. The argument is that although individual modules may pass, the instrument may fail due to the sum of errors. This has also been our experience in practice (24).
Qui Sunt Auctores?
We now come to the source of this protocol. This was published by the Indian Pharmacopoeia Commission in September 2021 (25). Usually, any pharmacopoeial general chapter describes what is required in broad terms to allow an individual laboratory flexibility in interpretation. In this instance, it is proscriptive, and, even worse, it is not entirely scientifically sound. It is puzzling that the authors appear to lack understanding of current best practices for requirements for analytical instrument qualification and its adequate documentation.
Summary
It is concerning that an important source of information for the Indian pharmaceutical industry can publish such an error-strewn and unscientific approach to the qualification of liquid chromatographs. We hope that they revise and reissue the guidance to ensure that laboratories define their operating parameters together with the ranges tested with acceptance criteria. The tests must be scientifically sound as well as allow traceability of work. However, in the current format, it is magnificent training material to teach analysts what not to do when qualifying a liquid chromatograph.
Acknowledgement
We would like to thank Paul Smith for constructive comments during preparation of this column.
References
- United States Pharmacopeia General Chapter <1058> “Analytical Instrument Qualification” (United States Pharmacopeial Convention, Rockville, Maryland, USA).
- R.D. McDowall, LCGC Europe 31(1), 36–41 (2018).
- P. Smith and R.D. McDowall, LCGC Europe 31(7), 385–389 (2018).
- P. Smith and R.D. McDowall, LCGC Europe 31(9), 504–511 (2018).
- P. Smith and R.D. McDowall, LCGC Europe 32(1), 28–32 (2019).
- EudraLex, Volume 4 Good Manufacturing Practice (GMP) Guidelines, Annex 15 Qualification and Validation (European Commission, Brussels, Belgium, 2015).
- 21 CFR 211, Current Good Manufacturing Practice for Finished Pharmaceutical Products (Food and Drug Administration, Silver Spring, Maryland, USA, 2008).
- EudraLex, Volume 4 Good Manufacturing Practice (GMP) Guidelines, Chapter 3 Premise and Equipment (European Commission, Brussels, Belgium, 2014).
- EudraLex, Volume 4 Good Manufacturing Practice (GMP) Guidelines, Glossary (European Commission, Brussels, Belgium, 2004).
- Part 211, Current Good Manufacturing Practice for Finished Pharmaceuticals (Federal Register, 43(190), pp. 45014–45089, 1978).
- R.D. McDowall, LCGC Europe 33(5), 257–263 (2020).
- MHRA, GXP Data Integrity Guidance and Definition (Medicines and Healthcare Products Regulatory Agency, London, UK, 2018).
- WHO, Technical Report Series No.996 Annex 5 Guidance on Good Data and Records Management Practices (World Health Organization, Geneva, Switzerland, 2016).
- US Food and Drug Administration, Guidance for Industry Data Integrity and Compliance With Drug CGMP Questions and Answers (FDA, Silver Spring, Maryland, USA, 2018).
- PIC/S, PI-041 Good Practices for Data Management and Integrity in Regulated GMP / GDP Environments Draft (Pharmaceutical Inspection Convention / Pharmaceutical Inspection Cooperation Scheme, Geneva, Switzerland, 2021).
- OECD Series on Principles of Good Laboratory Practice (GLP) and Compliance Monitoring, Number 22, Advisory Document of the Working Party on Good Laboratory Practice on GLP Data Integrity (Organization of Economic Cooperation and Development, Paris, France, 2021).
- C. Burgess and R.D. McDowall, LCGC Europe 29(9), 498–504 (2016).
- EudraLex, Volume 4 Good Manufacturing Practice (GMP) Guidelines, Chapter 4 Documentation (European Commission, Brussels, Belgium, 2011).
- R.D. McDowall, LCGC Europe 33(9), 468–476 (2020).
- R.D. McDowall, Spectroscopy 35(9), 27–31 (2020).
- United States Pharmacopeia General Chapter <621> “Chromatography” (United States Pharmacopeial Convention, Rockville, Maryland, USA).
- C. Burgess, Pharmaceutical Technology 39(7), 52–55 (2015).
- W.B. Furman, T.P. Layloff, and R. Tetzlaff, JOAC International 77, 1314–1317 (1994).
- C. Burgess, D.G. Jones, and R.D. McDowall, Analyst 123, 1879–1886 (1998).
- Guidance Document Calibration of HPLC (IPC/GD/05) 2021; Available from: https://thehealthmaster.com/wp-content/uploads/2021/09/IPC-dt-16-09-2021-Guidance-document-on-Calibration-of-HPLC.pdf
About The Author
Chris Burgess is Managing Director of Burgess Analytical Consultancy Limited, in Barnard Castle, UK. He is also a member of Pharmaceutical Technology Europe’s editorial advisory board.
About The Column Editor
Bob McDowall is Director of R.D. McDowall Limited, Bromley, UK. He is also a member of LCGC Europe’s editorial advisory board. Direct correspondence to: amatheson@mjhlifesciences.com
What Goes in a CDS IT Service Level Agreement?
Published: April 7th 2025 | Updated: April 7th 2025Protecting your network chromatography data system (CDS) data is critical and a service level agreement (SLA) with your IT provider is vital. What should be included? Are SLAs for in-house IT and SaaS (software as a service) similar?
ISC 2024: An Interview with Amarande Murisier
October 8th 2024As part of our ISC 2024 coverage, we recently interviewed Amarande Murisier of the University Hospital of Lausanne, Switzerland (CHUV) about her winning the Rising Stars of Separation Science Award for Biopharmaceutcal Analysis and her scientific background.


