Putting the Sample into Sample Prep
There are three aspects regarding samples that are of the highest importance in an analytical scheme: sample homogeneity (the distribution of an analyte in a matrix), the size distribution of the sample particles, and related physical considerations. Grinding, milling, mixing, and related techniques are used to improve sample homogeneity for statistical considerations. The sample size is also related to sampling accuracy and precision. Generally, larger samples improve precision and can generate more representative samples. Previously, we’ve discussed both sample size and homogeneity. However, sample collection is just as important. Too often, analysts are dependent on clients bringing the sample to the laboratory. This month, we take a look at devices and processes for obtaining samples outside of the laboratory.
Sample preparation is (obviously) dependent on the sample. However, in many cases, we do not collect our own samples but are dependent on clients to bring them to us (along with less than helpful requests like, “tell us what’s in here”, as opposed to engaging the analytical laboratory as a true partner in helping solve the issue at hand). Two years ago, we reported that sampling (and sample preparation, for that matter) is typically not a part of the training for most analysts (1). Key sample attributes for analysis include sample heterogeneity (which dictates sample treatment and sample size) and sample collection, both of which are addressed in this column. Sampling and the quality of analytical data go together, so the validity of the conclusion drawn from an analytical process are directly related to sample quality.
Types of Samples
Not only does the analyst rarely get involved with collecting the sample for analysis, but the sample collected in the field, pipeline, or tissue is rarely the sample that gets analyzed. Hence, there are several types of samples, and different regulatory agencies and standard-issuing bodies may use different terminology. These sample types may include gross samples, random samples, systematic samples, representative samples, composite samples, laboratory subsamples, and passively collected samples.
Gross samples are one or more increments of material taken from a larger quantity (lot) of material.
Random samples are collected when there is an unknown body of data and unbiased information is needed. For example, an applicable scenario where a random sample would be collected is to access the distribution of contaminants across a field. As a result, random samples are useful when the system is unknown. Collecting random samples can be performed by establishing a grid pattern across the system under study and using a random number generator to establish which grids to sample. Random samples are most valuable when several samples are taken and analyzed individually.
Systematic samples are collected to test hypotheses on effects of changes in a system, such as before and after a treatment. For example, a systematic sample would be taken upstream and downstream of a point source of pollutant. One precaution is to avoid adding bias to the samples as they are taken. These samples are used when some information is known about the system.
Representative samples indicate when a single sample represents the properties of an entire system. They should represent not only the chemical composition but also the particle size distribution and other physical properties as well. Because truly representative samples are difficult to obtain, they are often defined by relevant regulatory and trade organizations, including the U.S. Environmental Protection Agency (EPA), the U.S. Geological Survey (USGS), the U.S. Food and Drug Administration (FDA), American Society for Testing and Materials (ASTM) International, Association of Official Analytical Collaboration (AOAC) International, National Grain and Feeds Association (NGTA), Technical Association of the Pulp and Paper Industry (TAPPI), and others.
Composite samples are when two or more subsamples are obtained, combined, and mixed in an attempt to obtain a reasonably representative sample.
Laboratory subsamples are what is generally used in the analytical procedure because only small samples are typically needed for analysis. The laboratory subsample is usually what is mixed, ground, diluted, or concentrated for uniformity. Care must be taken with solids to avoid sample segregation because of particle size or density.
The general rule is that the more heterogeneous a substance is, the larger the sample amount needed to ensure a representative sample for a given level of precision. The laboratory subsample must contain the composition of the gross sample. Particle size reduction is often necessary when generating the laboratory subsample.
Passively collected samples, which are samples based on the flow of analyte from the system to a collection medium because of a difference in chemical potentials, will not be discussed in this column because, although this sampling mode is simple and inexpensive, it is limited to providing information like time-weighted exposure averages.
Sample types and sampling protocols are often specific to a given regulatory or industry situation, as noted above. However, one treatment that is described in the U.S. EPA Guidance in the literature (2) presents an interesting discussion on judgmental sampling compared to probabilistic sampling. In judgmental sampling, personal opinion is used regarding where to take samples and statistical analysis cannot be used to draw conclusions about the system under study. Probabilistic sampling provides a quantitative basis for conclusions to be drawn from the analysis, and is discussed in the following sections.
Sampling Design
Several experts have developed the theoretical and statistical basis for sampling, notably Byron Kratovil (University of Alberta), John Taylor (National Institute of Standards and Technology), and Pierre Gy (French industrial consultant). Gy, especially, attempted to account for the effects of particle shape and size, composition, solute liberation from the sample matrix, heterogeneity, analyte loss, and myriad other factors in developing his sampling theory over about four decades (3). Several LCGC articles have summarized the statistical uncertainties associated with sampling (1,4–8).
Perhaps the major treatments of sampling concern the appropriate sample size to be collected to maintain a given level of uncertainty. The well-established Horwitz curve (9) demonstrates that, to achieve increasingly smaller measurement uncertainties, the sample size must increase exponentially. Although Horwitz was primarily concerned with food analysis, his findings appear to have broad applicability. Ingamells (10–12) developed approaches and applied sampling constants to geochemical analysis. Generally, the sample amounts to be collected can be determined by derivations of the Benedetti-Pichler equation:

where n is the number of particles to be sampled; p and 1-p are the fractions of the two kinds of particles (analyte and nonanalyte); d1 and d2 are the densities of each particle; P1 and P2 are the percent of the desired component in each sample; Pave is the overall composition of the sample; and σs is the sampling error (13,14). If we assume homogeneous particle size distribution and spherical particle sizes, the mass of sample to be collected can be determined as (4/3)pr3dn where r is the radius of a sample particle.
On a more practical note, once a sufficient sample size is collected, if we assume the variance of sample is larger than the variance of analysis (generally a safe assumption with modern instrumental methods), the overall results of a method are generally better when multiple samples are pooled, mixed, and replicate subsamples analyzed, which leads us back to the concept of composite sampling. With composite sampling, the individual samples should be approximately equal size and shape, and if two or more composite samples are to be compared, the number of samples comprising each composite should be equal.
Sampling design strategies not only provide a sound statistical basis for making comparisons or drawing conclusions, they have the added benefit of minimizing resource use during the sampling and analysis procedures. The U.S. EPA Guidance (2) describes six types of sampling design protocols: judgmental design, simple random sampling, stratified sampling, systematic and grid sampling, ranked set sampling, and adaptive clustering.
Judgmental design is predicated on knowledge of the features or conditions under study and on professional judgment. Conclusions are limited to the validity of the professional judgment.
Simple random sampling uses random number generators and treats all possible sampled subunits equally, which is most useful when the system is fairly homogenous and random sampling can provide statistically unbiased determinations.
Stratified sampling separates the system into nonoverlapping subpopulations, called strata, thought to be homogeneous, which is helpful for providing estimates when the target population is heterogeneous, but the system can be subdivided.
Systematic and grid sampling collects samples at regularly spaced times or geometric intervals in an attempt to determine the distribution of analyte across a system of interest.
Ranked set sampling is a two‑phase method that identifies a set of field locations, screens to rank locations within each set, and then selects one location from each set for sampling, which provides more representative samples than simple random sampling. The ranking method and the analytical method should be strongly correlated. This design is useful when the cost of ranking locations in the field is low compared with the laboratory measurements.
Adaptive clustering results from a number of samples using simple random sampling, then collecting additional samples where the measurement exceed a threshold value. This is used to evaluate rare characteristics in a population and is appropriate with rapid, inexpensive measurements.
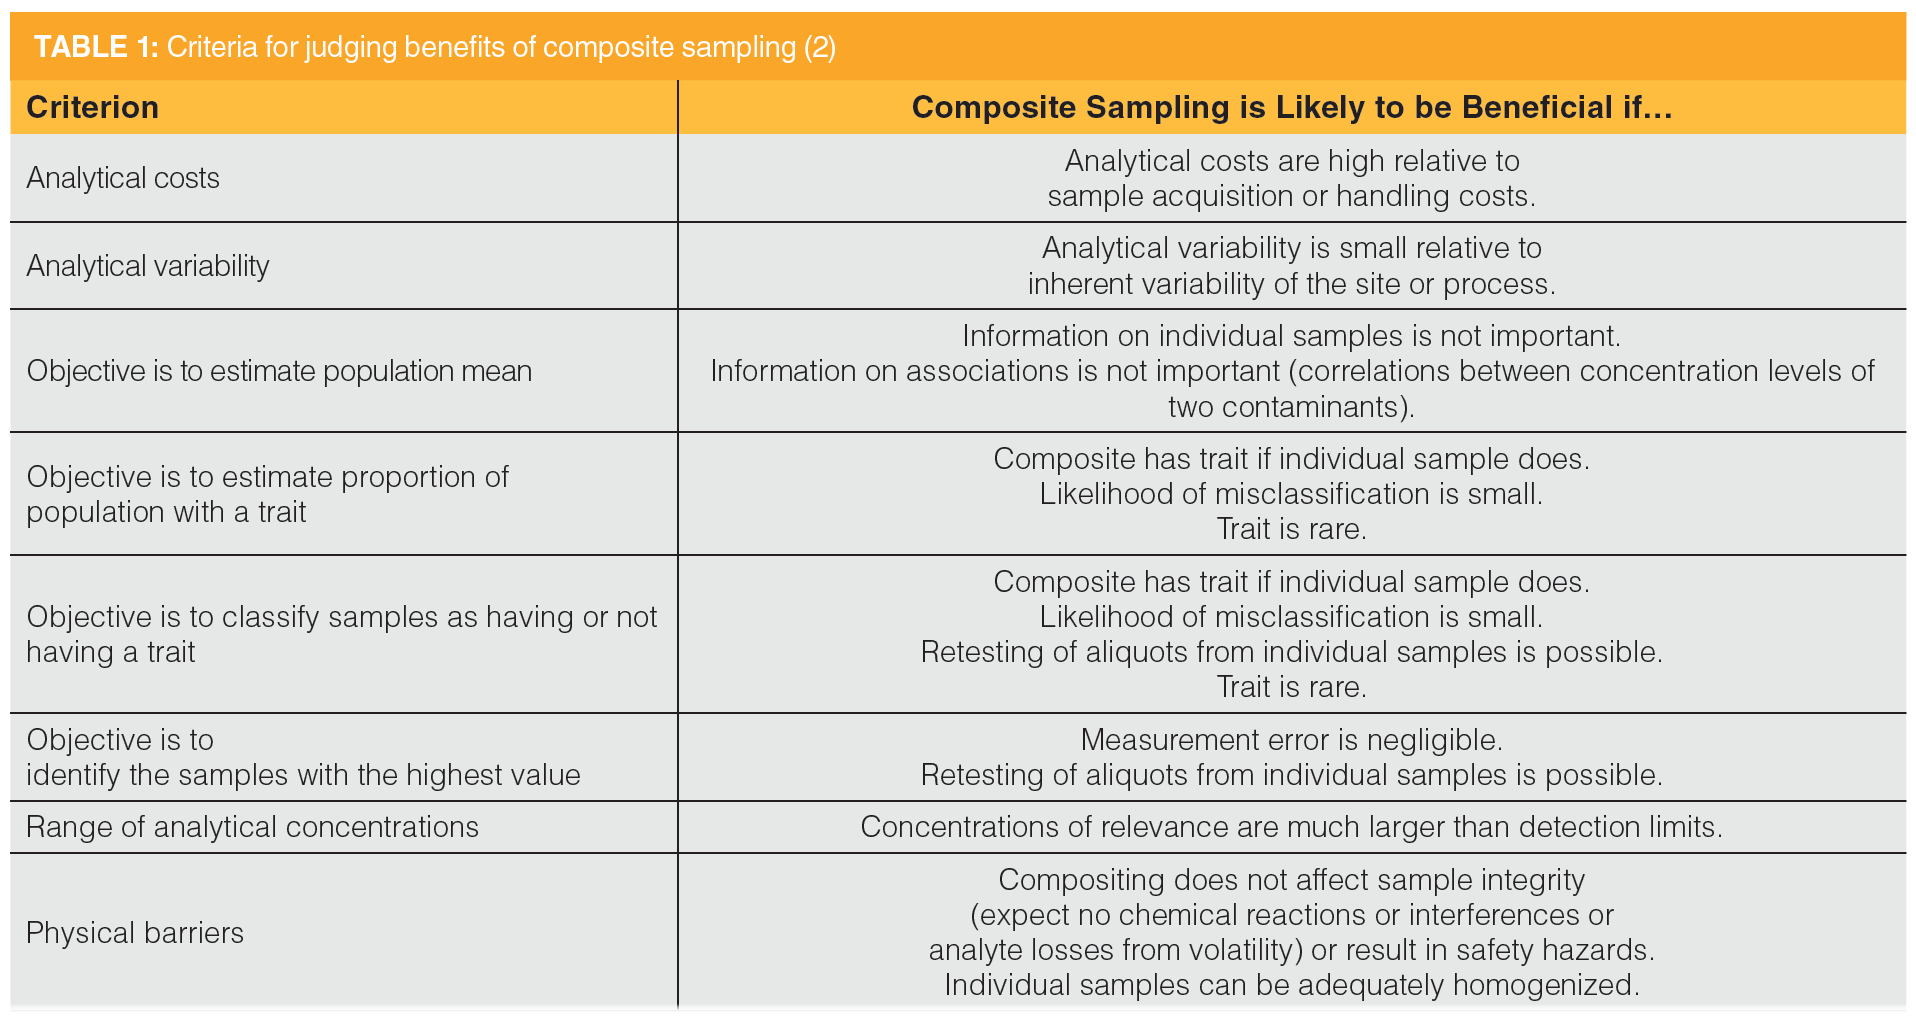
Composite sampling, as previously mentioned, physically combines and mixes individual samples in an attempt to form a single homogenous sample. It reduces the number of analyses needed. The individual samples to be composited should be of equal size and the number of individual samples in each composite should be the same. Table 1 from the EPA Guidance shows when composite sampling is beneficial (2).
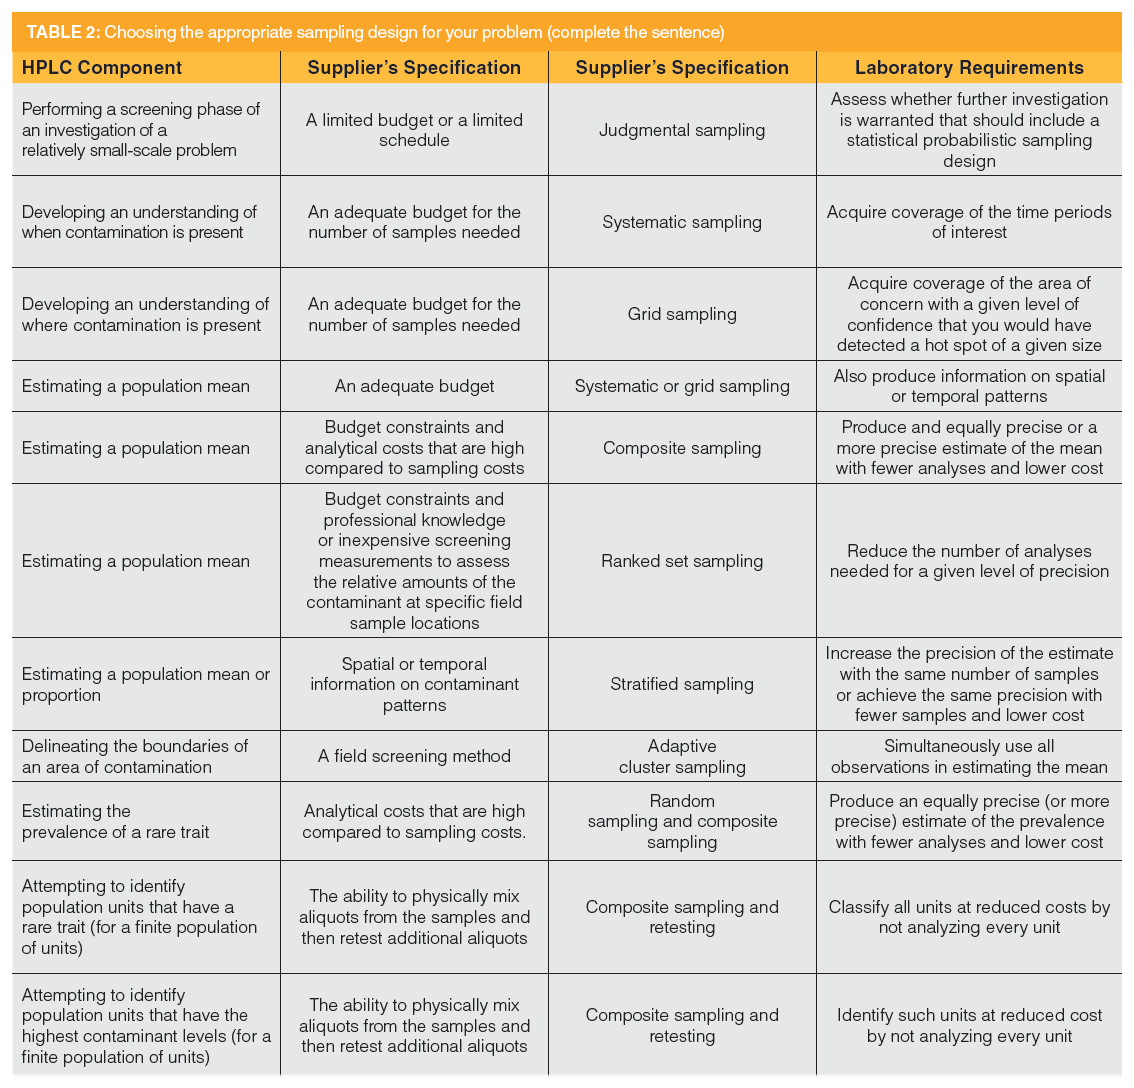
Other regulatory agencies may articulate similar sampling designs protocols. The EPA Guidance summarizes scenarios where these sampling design types may be appropriate (2), presented in Table 2.
Sampling Devices
Once the sample design and size are determined, how does one go about collecting the sample? Again, regulatory or trade organizations will often describe (or mandate) how samples are to be collected. Devices used to collect samples must be able to easily gather a sufficient sample size without introducing contamination or degrading samples, must be safe to use, and must be easy to clean. Sampling devices can be quite sophisticated, involving pumps, adsorbents, or complex flow paths. However, many devices are scaled versions of common laboratory equipment, including spatulas, spades, syringes, and more. Some specific sampling devices are discussed.
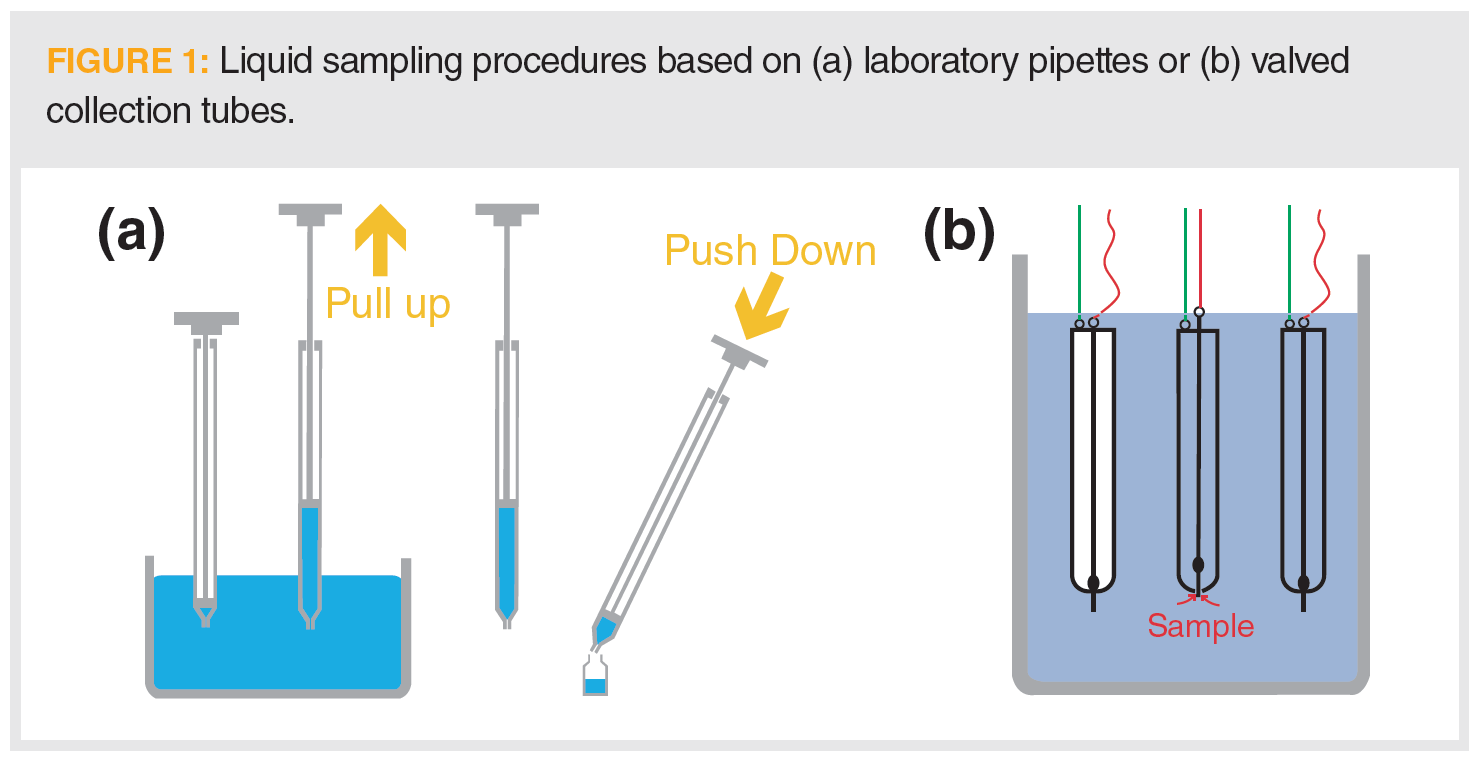
Obtaining liquid samples often depends on the depth of the liquid and whether the analyst wishes to maintain a depth profile. Shown in Figure 1(a) is the schematic of a pipette-style device scaled appropriately and Figure 1(b) is a manual valve collection tube.
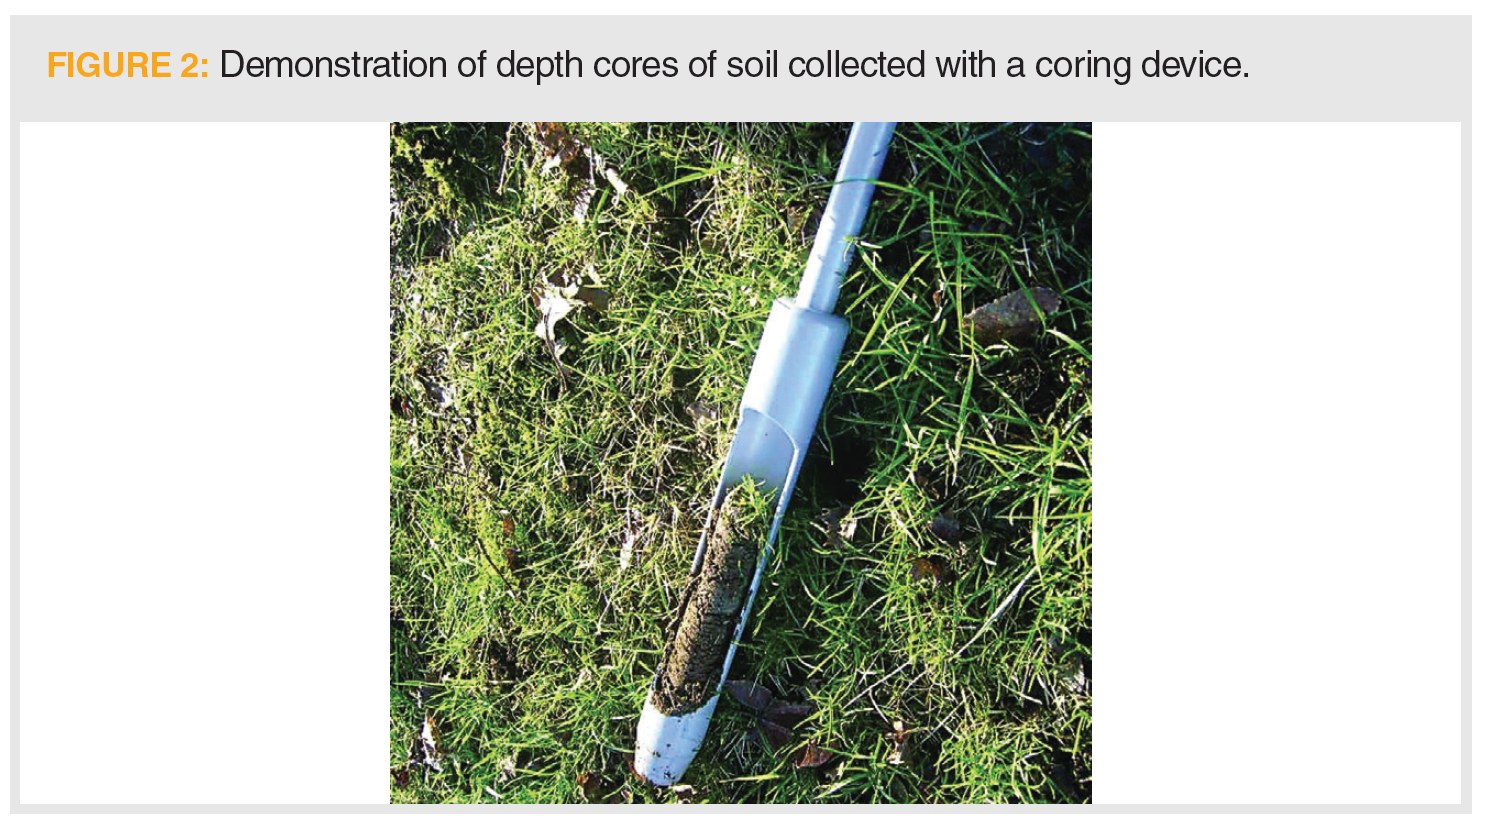
Simple devices are often used to obtain analytical samples. We’ve already mentioned items like spatulas and spades. Depth profiles of samples can be obtained with corers, essentially enlarged versions of apple corers used in the kitchen, as shown in Figure 2.
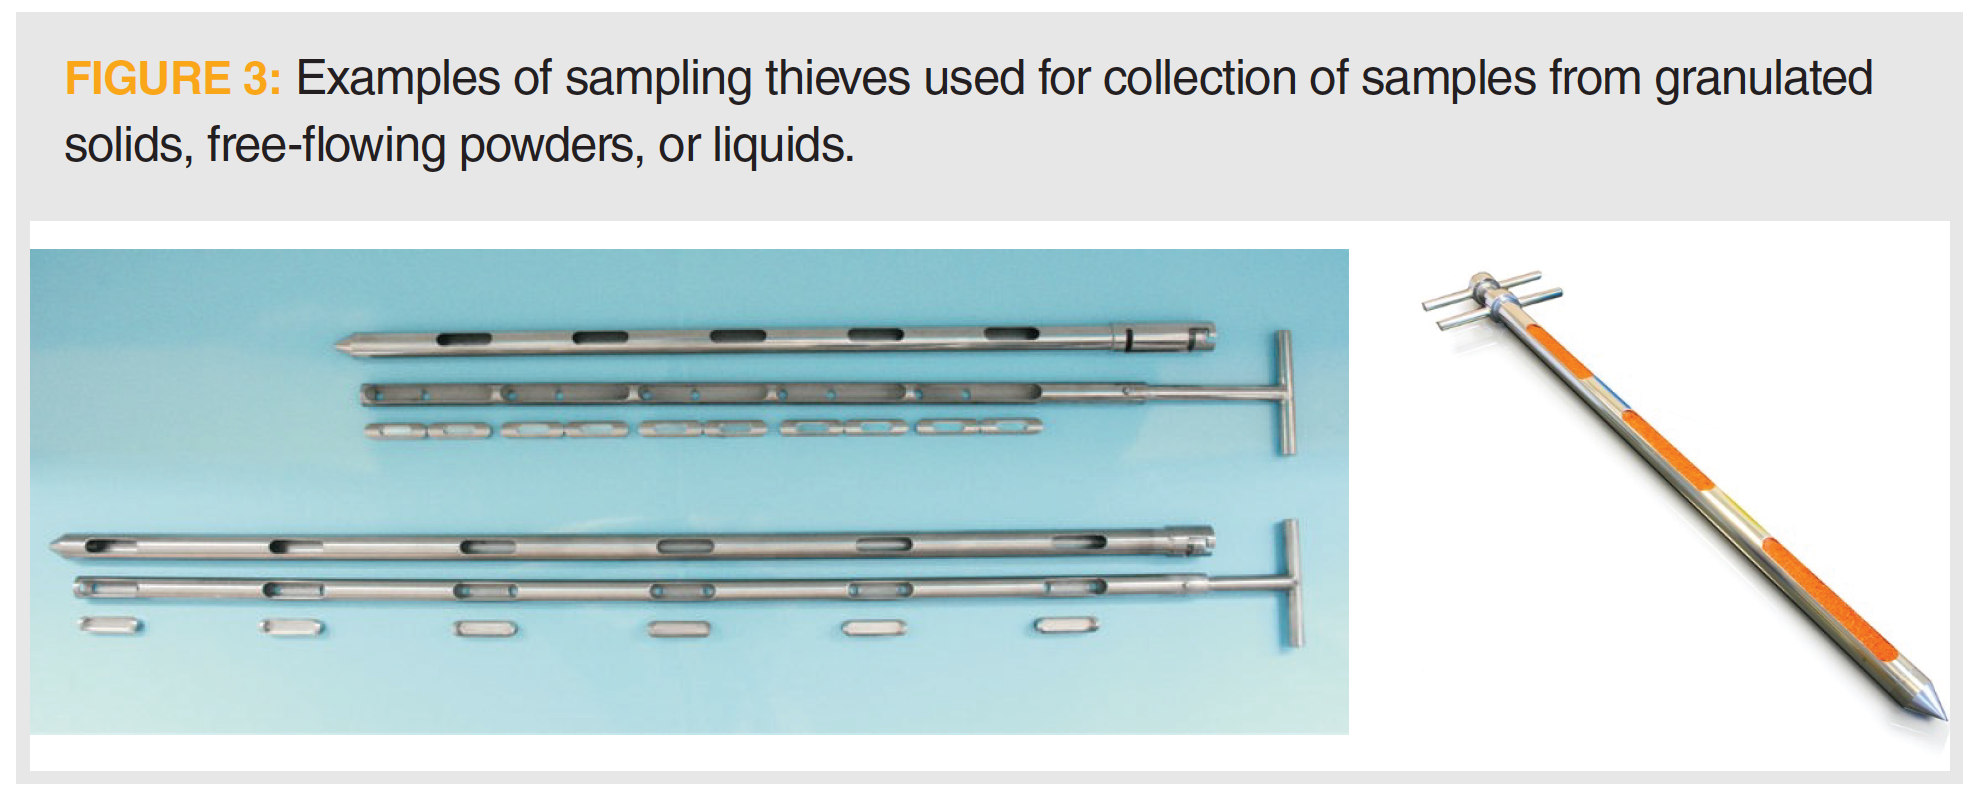
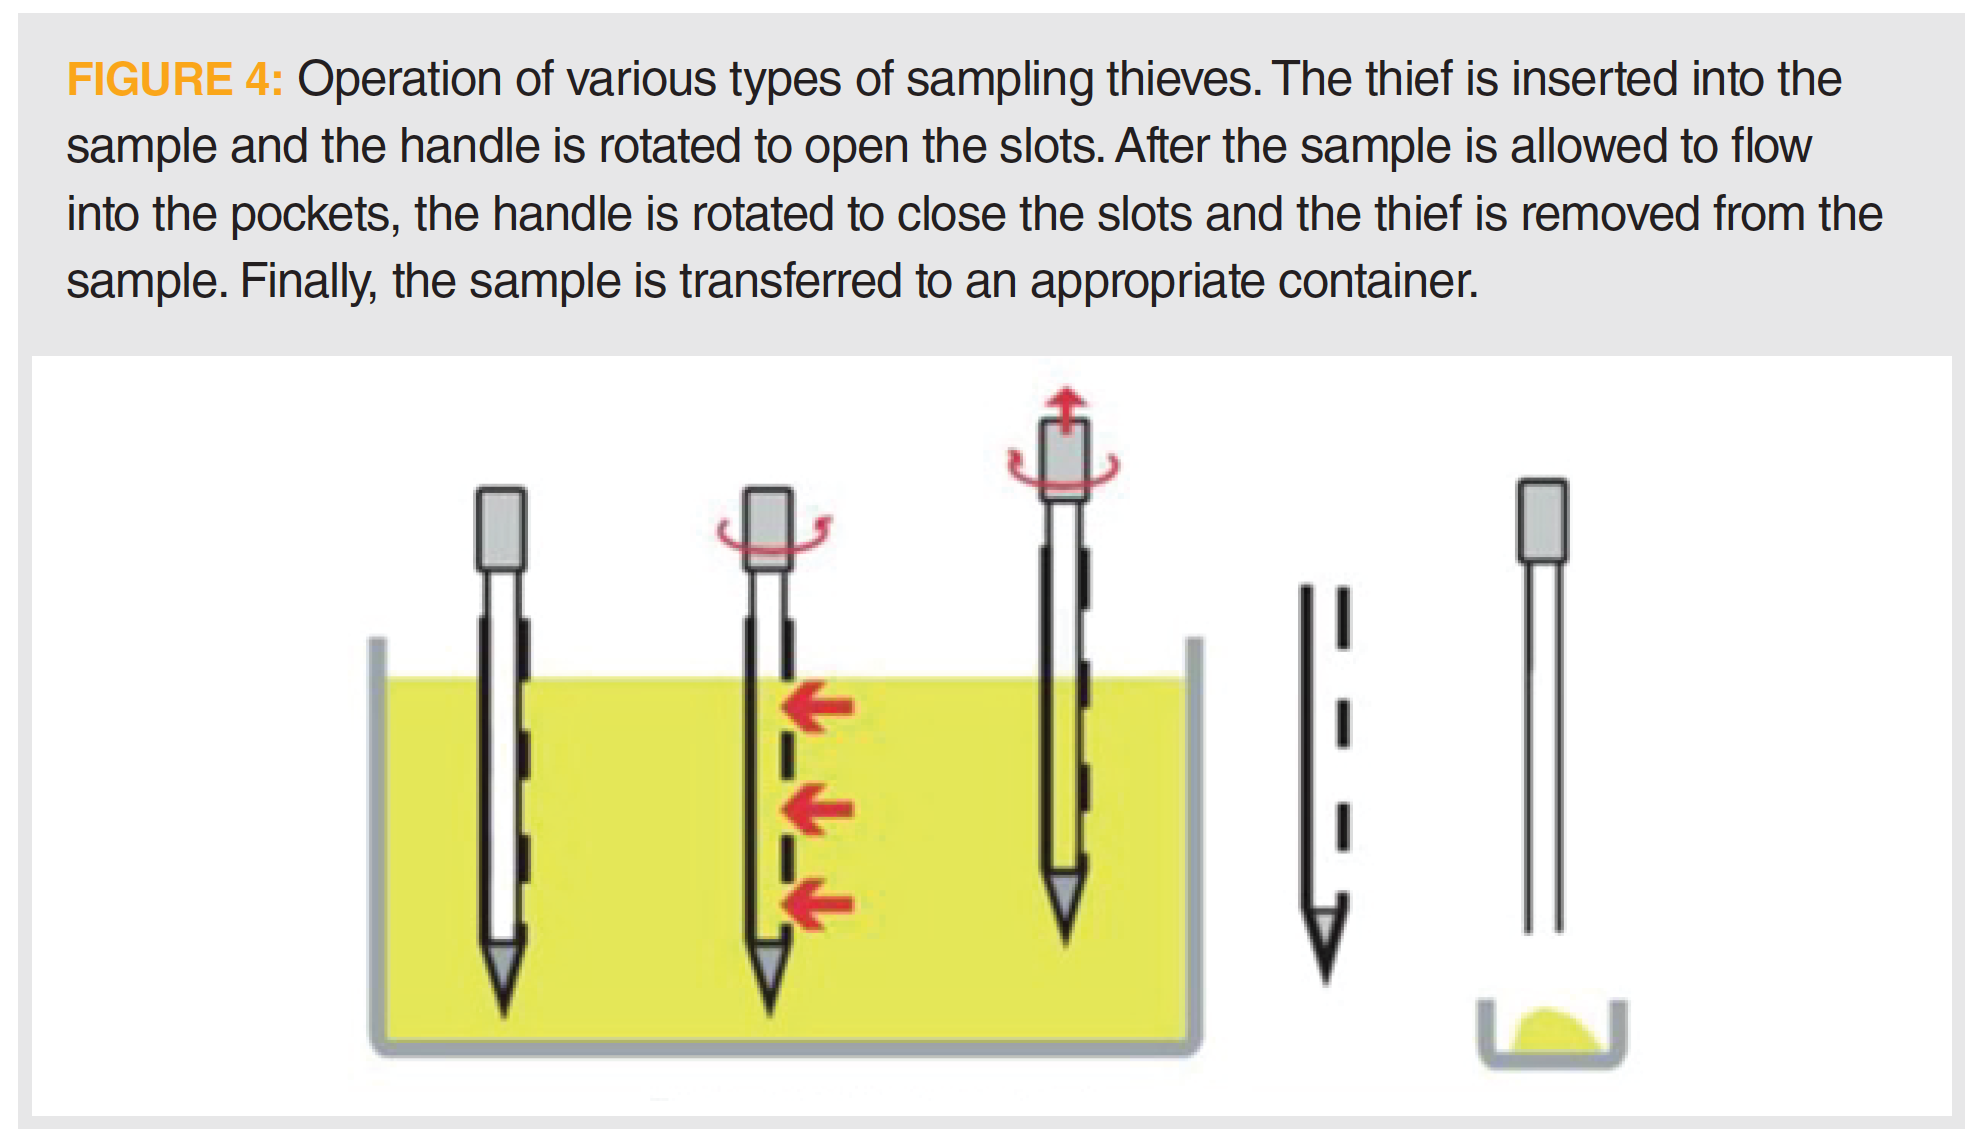
A special sample collection tool used with granulated solids, free‑flowing powders, or liquids is the sample thief. The sampling thief, depicted in Figure 3, generally consists of a handle on a pocketed or slotted rod that is inserted into the sample. The barrel-shaped covering is twisted to expose the pockets. Single pockets allow collection at defined depths, whereas multipocketed devices allow depth profiling. Operation of these devices is shown in Figure 4.
Conclusions
Sampling is often not included in the professional training of analysts. Hence, it is often misunderstood. In this column, we discussed various sample types and the statistical treatment of sampling. Sample design protocols aligned with analytical scenarios. Finally, we presented a quick overview of the tools used to collect analytical samples. Armed with knowledge of sample types and sample collection, the analyst can become a better partner in the chemical problem-solving process.
References
- D.E. Raynie, LCGC Europe 33(10), 527–531 (2020).
- U.S. Environmental Protection Agency, “Guidance on Choosing a Sampling Device for Environmental Data Collection,” EPA QA/G-5S (2002).
- R.W. Gerlach, J.M. Nocerino, C.A. Ramsey, and B.C. Venner, Anal. Chim. Acta 490, 159–168 (2003).
- V.R. Meyer, LCGC Europe 33(2), 67–73 (2020).
- V.R. Meyer, J. Chromatogr. A 1158, 15–24 (2007).
- V.R. Meyer and R.E. Majors, LCGC North Am. 20(2), 106–112 (2002).
- M. Bruce and D.E. Raynie, LCGC Europe 30(11), 638–641 (2017).
- D.E. Raynie, LCGC Europe. 29(8), 442–445 (2016).
- W. Horwitz, Anal. Chem. 54, 67–76 (1982).
- C. Ingamells and P. Switzer, Talanta 20, 547–568 (1973).
- C.O. Ingamells, Talanta 21, 141–155 (1974).
- C.O. Ingamells, Talanta 23, 263–264 (1976).
- W.E. Harris and B. Kratochvil, Anal. Chem. 46, 313–315 (1974).
- B. Kratochvil and J.K. Taylor, Anal. Chem. 53, 924A–938A (1981).
About The Column Editor
Douglas E. Raynie is a Department Head and Associate Professor at South Dakota State University. His research interests include green chemistry, alternative solvents, sample preparation, high-resolution chromatography, and bioprocessing in supercritical fluids. He earned his Ph.D. in 1990 at Brigham Young University under the direction of Milton L. Lee. Raynie is a member of LCGC’s editorial advisory board. Direct correspondence about this column via e-mail to amatheson@mjhlifesciences.com

New Study Reviews Chromatography Methods for Flavonoid Analysis
April 21st 2025Flavonoids are widely used metabolites that carry out various functions in different industries, such as food and cosmetics. Detecting, separating, and quantifying them in fruit species can be a complicated process.
Quantifying Terpenes in Hydrodistilled Cannabis sativa Essential Oil with GC-MS
April 21st 2025A recent study conducted at the University of Georgia, (Athens, Georgia) presented a validated method for quantifying 18 terpenes in Cannabis sativa essential oil, extracted via hydrodistillation. The method, utilizing gas chromatography–mass spectrometry (GC–MS) with selected ion monitoring (SIM), includes using internal standards (n-tridecane and octadecane) for accurate analysis, with key validation parameters—such as specificity, accuracy, precision, and detection limits—thoroughly assessed. LCGC International spoke to Noelle Joy of the University of Georgia, corresponding author of this paper discussing the method, about its creation and benefits it offers the analytical community.


