Inside the Personalized Medicine Toolbox: GCxGC-Mass Spectrometry for High-Throughput Profiling...
LCGC North America
The authors present results that suggest that high-throughput, high-coverage profiling capabilities, such as those afforded by GCxGC-TOF-MS, can impact the development of personalized medicine.
Inside the Personalized Medicine Toolbox: GCxGC-Mass Spectrometry for High-Throughput Profiling of the Human PlasmaMetabolome
Personalized medicine advocates have been frustrated by the issue of analyte component resolution in biomolecular profiling. Because complex human biological samples such as plasma, serum, or urine contain ~103–107 unique molecular entities, the analyte capacity of any high-throughput platform is typically exceeded. In our attempt to overcome this problem, we employed the use of comprehensive two-dimensional gas chromatography (GC×GC) combined with time-of-flight mass spectrometry (TOF-MS) for high-throughput profiling of the human plasma metabolome. The profiling experiments demonstrated the capability of a GC×GC-TOF-MS approach with regard to component resolution as well as overall utility for comparative metabolomic analyses employing plasma samples from a "control" cohort (81 samples) versus a cardiovascular-compromised cohort (15 samples) of individuals. The use of the GC×GC separation has resulted in a platform that provides more than an order of magnitude greater resolving power while at the same time not affecting the overall experimental run time. Additionally, the high-throughput approach provides information-rich datasets that can be used to distinguish the control and disease sample cohorts. Such results suggest that high-throughput, high-coverage profiling capabilities, such as those afforded by GC×GC-TOF-MS techniques, can impact the development of personalized medicine in which future disease prevention, diagnosis, and treatment are tailored to an individual's unique molecular makeup. Challenges to full implementation of high-throughput metabolite profiling by GC×GC-TOF-MS as well as future directions are discussed.
There is widespread medical, scientific, and general public interest in the rapidly emerging field of personalized medicine (1). The Personalized Medicine Coalition has defined one aspect of personalized medicine as the ability to manage disease (and disease predisposition) based upon biomolecular analysis (2). As such, molecular classifications at the genome, transcriptome, proteome, and/or metabolome levels has taken on ever more importance(2,3). This new paradigm in healthcare has lead to a race for the identification of efficacious biomarkers, panels of biomarkers or profiles that can be used for preventative, predictive, diagnosis, and prognosis of disease as well as assessment of overall general health and wellness (1). In part, the development of personalized medicine has been enabled due to the advent of new analytical and computational tools not available previously. One can envision that the new tools will provide important information to the individual patient or consumer permitting them to make informed decisions regarding their general health and well being as well as their ability to manage disease issues more efficiently. This is captured schematically in Figure 1.
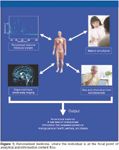
Figure 1
Despite the technological developments of the past decade, the expectation of personalized medicine based upon individual molecular analyses has been tempered somewhat, due in part to the tremendous analytical challenge presented by the complexity of human biological samples such as plasma, sera, or urine. For example, it has been estimated that the human metabolome contains ~2000–2500 unique molecular analytes (4–6). This is considerably lower in number than the estimated human proteome (7), but nonetheless presents a considerable analytical challenge. In addition, there is greater disparity in the physicochemical properties of the metabolome constituents (8,9). This creates a considerable challenge in terms of utilization of a single analytical technique to profile the human metabolome (10). Another problem is the presence of incomplete or limited databases as well as the lack of standardization across databases. Thus, the ability to identify metabolite components based upon database searches is hindered. A final problem is that the degree of variability in concentrations for many metabolites among different individuals is largely unknown. Such problems are not so unlike those encountered in proteomics efforts and as such require a similar solution: high-throughput analyses to determine metabolome variability for a large number of components. However, it has been argued that a comprehensive understanding of the metabolome would help to discover biomarkers associated with disease as it (metabolomics) "will more precisely take into account the effects of lifestyle, diet, and the environment" (5).
Having noted the difficulties in characterizing the metabolome, it is important to consider the current analytical methods for individual sample profiling. The most widely used techniques include 1H nuclear magnetic resonance (NMR) spectroscopy, direct infusion mass spectrometry (MS), Fourier transform-infrared (FT-IR) spectroscopy, and liquid chromatography (LC) and gas chromatography (GC) coupled with MS (10,11). Each of these techniques has its advantages as well as its limitations and for this reason, metabolomic profiling often requires the use of multiple approaches (10,12–17). The relatively recent technique of comprehensive two-dimensional (2D) GC (GC×GC) (18–23) is gaining acceptance as a powerful tool for the rapid profiling of complex biological samples (24,25). In addition to the increased peak capacity, the advantage of the approach is that the extra separation dimension reduces the congestion of eluted peaks, thereby allowing the resolution of lower signal species (24).
The work reported here presents an evaluation of a GC×GC-TOF-MS analytical approach for human plasma metabolite profiling. A total of 96 plasma samples have been analyzed using a rapid throughput approach requiring approximately 20 min (the separation time is ~20 min and the cycle time is ~30 min; see the following) per sample. The analytical platform is evaluated based upon robustness, resolving power, and metabolome coverage, and to some degree, the quality of the data. We present a comparative metabolomics study in which the plasma metabolite profiles of 81 control cohort samples are compared to those from a cardiovascular-compromised patient sample cohort (15 total). The limitations of the approach as they pertain to profiling efficacy and personalized medicine as well as future directions for the technique are discussed in the following.
Experimental
General description of metabolite profiling for personalized medicine: The general procedure for performing high-throughput profiling studies using GC×GC-TOF-MS instrumentation is described in the scheme shown in Figure 2. Briefly, individuals provide a biological fluid sample (blood in this case). The samples are prepared in large batches to avoid day-to-day platform variability (both instrumental and sample workup). After processing, all samples in the batch are analyzed using the GC×GC-TOF-MS instrumentation. The data are processed to produce comparable "molecular fingerprints." Biostatistics tools are used to determine whether or not the data is of sufficient quality to distinguish sample cohorts — most notably disease and control samples. Each step in the profiling process is described in greater detail in the following.
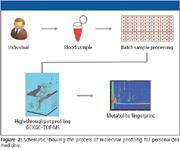
Figure 2
Blood collection, plasma preparation, and storage: The plasma samples were obtained from subjects recruited under the supervision of an approved IRB protocol (26). Briefly, for the control cohort, blood was drawn using standard venipuncture techniques by qualified medical professionals. The blood (~10–12 mL) was collected in lithium heparin vacutainer tubes (BD, Franklin Lakes, New Jersey). Cardiovascular-compromised samples were obtained from individuals who failed a cardiovascular stress test. An in-line catheter was used to collect blood samples from these subjects. Again, the blood (~6 mL) was placed into a lithium heparin tube. Samples were centrifuged at 1500g for 5 min to obtain platelet-poor plasma and subsequently at 12,000g for 10–15 min to obtain platelet-free plasma. To the plasma supernatant of each sample, 30 μL of protease inhibitor cocktail (EMB-Calbiochem, San Diego, California) was added. Because of a lack of laboratory equipment at the collection facility, the samples were treated slightly differently at this point, at which the normal samples were frozen and thawed between centrifugation steps. The platelet-free plasma from each sample was then stored in a freezer at -85 °C.
Here we note that subjects providing blood for the "control" sample cohort were asked to complete a health and lifestyle questionnaire. The survey provides information about the subject's physical condition (height and weight), ethnicity, gender, stress level, family medical history, prescription medication being used, diet, and alcohol, tobacco, and illicit drug usage. This information is stored in a database along with the code for the deidentified plasma sample. An example of the use of this metadata to posit an explanation for observations obtained from the comparative study is provided in the Results and Discussion section of this article.
Metabolite extraction and derivatization: 400 μL of cold methanol (HPLC grade, Sigma-Alrich, St. Louis, Missouri) was added to a 200-μL aliquot of each sample to precipitate plasma proteins and extract metabolites. Samples subsequently were mixed and vortexed for 15 s. The samples then were centrifuged for 15 min at 13,000g to pellet out the proteins. The metabolite-rich supernatant then was transferred to a new vial and subsequently dried using a centrifugal concentrator (Labconco, Kansas City, Missouri).
To each dried sample, a total of 50 μL of pyridine (99.9%, Sigma-Aldrich) was added. This was followed by sonication (Bath Sonicator FS 30, Thermo Fisher Scientific, Waltham, Massachusetts) to resuspend metabolites. The pyridine solution from each sample was then transferred to a 1.5-mL glass autosampler vial where 50 μL of BSTFA (Thermo Fisher Scientific) was added. The sample then was vortexed for 30 s and then heated for 60 min at 60 °C to allow the reaction to proceed. To ensure consistent derivatization conditions, the sample temperature was monitored periodically. A 50-μL aliquot from each sample was then transferred to a GC autosampler glass vial that was capped in preparation for injection onto the GC column.
GC×GC-TOF-MS instrumentation and measurement parameters: A schematic of the instrument used in these studies is shown in Figure 3. The GC×GC-TOF-MS system used consisted of an Agilent 6890N gas chromatograph (Agilent Technologies, Santa Clara, California) equipped with a split–splitless inlet and autosampler, a high-speed TOF mass spectrometer, and a thermal modulator with a secondary oven for the second dimension column. First, the derivatized samples were loaded onto the autosampler, which periodically selected the vial for the sample to be analyzed, drew 1 μL of sample, and injected the sample fraction onto the first GC column at a split ratio of 20:1. The first GC separation was accomplished using a 30 m × 250 μm nonpolar Rtx-1MS (100% dimethyl polysiloxane) GC column with a film thickness of 0.25 μm. The second separation step was accomplished using a 1.1 m × 100 μm midpolar BPX-50 (50% phenyl polysilphenylene-siloxane) column with a film thickness of 0.1 μm. The carrier gas used was helium with a flow rate of 1.5 mL/min. The column temperature programs were as follows: GC oven, 60 °C (0.20 min), 20 °C/min to 340 °C (5.0 min); secondary oven, 65 °C (3.20 min), 20 °C/min to 340 °C (2.20 min). The modulator was held 30 °C above the temperature of the GC oven. The second dimension separation time (modulation period) was 3 s and the hot pulse was 0.6 s. The separations (temperature being time-dependent) conditions for the second separation step were essentially isothermal. That is, the short residence times of species in the second column ensured a uniform temperature despite the temperature gradient employed across the entire experiment.
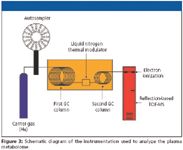
Figure 3
Electron impact (EI) ionization was used to ionize species eluted from the second column. For these studies, an energy setting of 70 eV was employed. The mass-to-charge ratios (m/z) for specific ions were determined using TOF-MS. A mass range of 45–750 Da with a spectral collection frequency of 200 spectra/s was used for these experiments. The detector gain for the TOF was set at 1850.
Data processing: The majority of data post processing was accomplished using the ChromaTOF software (LECO, Version 3.30, St. Joseph, Michigan). Dataset peak picking and intensity determination were accomplished using the parameters described here. A signal-to-noise ratio (S/N) threshold of 100 was required for features to be submitted for library searches. Additionally, a 0.08-s peak width threshold was employed. To remove background noise, an automated subtraction was utilized. The total ion current from the deconvoluted ion chromatogram was used to report peak intensities. The NIST library was searched using fragmentation mass spectra to obtain dataset feature identifications. To obtain an assignment, a threshold of 75% similarity was used for the spectral matching. Annotated peak lists were exported as CSV files. The MAlign software developed by Zhang and coworkers (27) was used to merge redundant peak assignments, perform a blank subtraction, and align the datasets. The software achieves peak alignment by utilizing the first and second dimension retention times and the mass spectra generated during the process of electron ionization. The first and second dimension retention times were used to locate potential peak candidates in the search table. Then, the mass spectra similarity score was used to select the most probable candidate. The software also includes options to eliminate nontarget peaks from the alignment results (for example, peaks of contaminants). The software generated an aligned peak table, which was then normalized using an autoscaling approach. The normalized peak table was then transferred to the MATLAB (The MathWorks, Natick, Massachusetts) software for principal component analysis (PCA) to obtain dataset clustering information.
Results and Discussion
Instrumentation robustness and peak capacity: High-throughput profiling was achieved by decreasing the primary GC separation time in the GC×GC-TOF-MS analysis. For the current studies, a total separation time of 20 min was utilized. An additional 10 min is required to allow temeperature reequilibration of the secondary oven. Thus, the analysis of 96 samples (81 normals and 15 cardiovascular compromised) required a total instrumentation time of just ~2 days. This large-scale analysis addresses the robustness of the instrumentation. Here we note that a single instrument performed the entire analysis, only stopping to change the inlet liner and septum after ~50 injections. Additionally, the overall number of samples analyzed sequentially (131) is higher than that mentioned previously, as additional runs were performed to develop the separation method as well as to evaluate the efficacy of the derivatization step. This high level of robustness resulting in the large throughput is encouraging; the analysis of thousands of samples such as is required for clinical trials can be envisioned.
The reduction in time for the first GC separation was possible because of the increased peak capacity afforded by the two-dimensional separation. The peak capacity of multidimensional separation techniques scale multiplicatively; that is, for orthogonal separations, the total peak capacity is the product of the peak capacities for each individual separation (28). By calculating the resolving power for both GC separation steps using the peak widths of 10 dataset features selected at random, it is possible to estimate the peak capacity afforded by the 20-min analysis. Table I lists the peaks and corresponding molecular assignments used in the peak capacity determination. The average resolving power obtained for the first and second separation steps is 181.9 and 22.6, respectively. This leads to an estimated peak capacity of ~4.1×10³ for the two-dimensional separation. The extra separation capacity provided by the second GC separation step allowed the use of shorter primary separation times. That is, species that were coeluted on the first column, because of the greater spectral congestion associated with the shorter timescale, could be separated with the second column.
Metabolome component resolution: Typically, the datasets yielded ~3000–4000 dataset features. Considering the estimated peak capacity as mentioned previously and the fact that no dataset is filled completely with peaks, a question arises of whether or not the datasets are oversampled in the determination of peaks. This is answered clearly by the fact that multiple identical assignments are provided for neighboring dataset features. That is, in creating the peak list, many features corresponding to the same molecular species are not merged. Perhaps a better indication of the component resolution is obtained from the nonredundant peak lists (see Experimental Methods) where on average ~700 peaks are observed.
On average, ~290 features were identified per sample from NIST library searches using fragmentation spectra. The identifications from all samples were compiled into an emerging human plasma metabolome map, which is described elsewhere (29). As a brief description, the map contains entries for 28,047 molecules corresponding to 2653 unique assignments. From the map, a high confidence list containing ;189 assignments was compiled.
To contextualize the number of resolved and identified components, consider the estimated number of human metabolome components. As mentioned previously, according to some, this value ranges from ~2000 to 2500 (4–6). Interestingly, the number of resolved components (after blank subtraction) represents a significant fraction of that total value. Even though many of these might not represent human metabolites, it appears that reasonable coverage can be obtained with a single, high-throughput analysis. Such high coverage is desirable for individual metabolite profiling and, thus, instrumentation platforms such as that described here might offer a greater chance for creating the molecular fingerprints necessary for personalized medicine.
Comparison to other work: With respect to the evaluation of instrumentation robustness and component resolution, the work presented here is similar to that reported by Kell and coworkers (30), who performed a comprehensive set of experiments to optimize serum metabolite coverage using GC×GC-MS instrumentation. Here the investigators were able to perform 300 automated runs, whereupon the gain in resolved components increased by a factor of 3 compared with GC–MS. The researchers observed more than 4000 dataset features which included ~1800 that are considered to be true metabolite peaks. Although these numbers are slightly higher than the values we obtained for the picked peaks (~3000–4000) as well as the nonredundant peak list (~700), we note that a smaller S/N threshold was used in the former study. It also should be noted that the number of high-confidence assignments from the current profiling studies (189) is similar to the value reported to be true metabolite assignments (188) from the former work. In summary, this work builds upon the work of Kell and coworkers and extends the application to the profiling of different biological sample cohorts.
Distinguishing disease and normal sample cohorts: In an attempt to distinguish the normal and cardiovascular-compromised datasets, pattern recognition analyses (using PCA) were performed for two sample subsets. The idea is to gain a better understanding about differences between matched subsets of the disease and normal samples. The comparisons involve datasets from normal samples corresponding to individuals who have a body mass index (BMI) below the overweight threshold (that is, BMI < 25). These were further divided based upon the gender of the donor. Thus, the first comparison is between normal BMI males and cardiovascular-compromised males, while the second comparison is between normal BMI females and cardiovascular-compromised females. There were two main goals for this analysis. The first was to determine whether or not statistical analysis tools can be used to distinguish normals from cardiovascular compromised samples as well as to determine whether or not there was a difference in the level of dissimilarity between these two groups based upon gender.
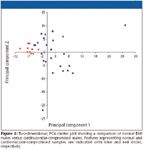
Figure 4
Figure 4 shows the results of the PCA analysis (using two principal components) for the normal BMI male sample comparison with the male cardiovascular compromised samples. Even with the small cardiovascular compromised sample set, differences between the two groups are noticeable. For example, ~78% of the cardiovascular compromised samples are observed in the second quadrant of the cluster plot while only ~31% of the normals fall in the second quadrant. Within the second quadrant there is further separation of the normals and the cardiovascular compromised cohort where ~86% of the cardiovascular samples fall below an x-axis value of -6; none of the normal BMI sample datasets are observed in this region. Overall, the cardiovascular compromised samples fall to the far left and middle of the PCA cluster plot while the normal samples are spread over a larger region to the right. Figure 5 shows a similar trend for the comparison of the normal BMI female samples with the female cardiovascular compromised samples. Here again, the majority (~66%) of the cardiovascular compromised samples are observed in the second quadrant while only a single (~5%) normal sample is observed in the second quadrant. The majority (~64%) of the normal BMI samples tend to cluster in the third quadrant while only a single (~16%) cardiovascular sample is observed here. Overall, the degree of overlap between the normal BMI samples and the cardiovascular compromised samples appears to be very similar for both males and females and, thus, the data do not appear to indicate a difference between the levels of dissimilarity based upon gender. Because of the small number of cardiovascular compromised samples used in the comparisons, the results of the PCA analysis should be treated with caution; however, the fact that distinctions can be made between datasets at this early stage is encouraging.
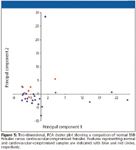
Figure 5
To put the biomolecular profiling into the context of a tool for personalized medicine, it is instructive to consider normal BMI outliers that are observed to overlap with and diverge significantly from the cardiovascular compromised samples. One approach is to review the donor metadata obtained from the questionnaire to see if there is any rationale for these observations. For example, in the comparison of male subjects, the metadata corresponding to the dataset closest to the majority of the cardiovascular-compromised samples (second quadrant of Figure 4) can be reviewed. In evaluating the questionnaire information for this individual, it was learned that the donor indicated that he exercises rarely and frequently uses alcohol and tobacco, all risk factors associated with cardiovascular disease. Similarly, one can review the information corresponding to the sample farthest away (excluding outliers) from the cardiovascular-compromised group (that is, the lowest datapoint in the fourth quadrant of Figure 4). This individual (BMI < 21.0) indicated that he exercises frequently, is not taking prescription drugs, does not use alcohol or tobacco, and has no family history of cardiovascular disease.
Here we stress that caution should be exercised in the interpretation of the pattern recognition results because the molecular entities responsible for the clustering are largely unknown. Additionally, the small cardiovascular-compromised sample set presents problems for the statistical analysis; that is, as mentioned previously, such a small sampling does not adequately reflect the normal variation of metabolite concentrations within cardiovascular-compromised individuals. This problem of sampling is exacerbated by the fact that some of the individuals who fail a cardiovascular stress test might not exhibit cardiovascular disease. Thus, the results are presented here as being intriguing and a demonstration of how one facet of personalized medicine using high-throughput profiling might be approached (that is, using information about the individual to aid the interpretation of molecular fingerprint comparisons). That said, the results clearly indicate that the profiling technique warrants further investigation using larger, more well-defined sample populations.
Determining the Biological Relevance
Although the results demonstrate that high-throughput profiling can be used to distinguish sample cohorts, the utility of the approach for personalized medicine lies in the ability to make connections to the pathophysiology. As with biomarker discovery efforts in general, this is an arduous, ongoing process, and we have begun to examine the differences between the two sample cohorts based upon the identified molecules. For example, a comparison of two datasets from different sample cohorts can reveal the resolution of different features. Figure 6 shows a comparison between a cardiovascular compromised dataset and a normal dataset. Two features corresponding to assignments for acetoacetic acid and aminomalonic acid are observed in the cardiovascular-compromised sample having first and second retention times (tR1 and tR2) of 438 s and 1.15 s, and 510 s and 1.10 s, respectively. The same species are not observed in the normal sample. An issue that arises is whether or not such a difference constitutes a trend and whether or not trends of this nature can be related in any way to the disease process.
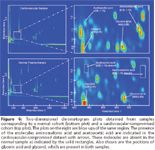
Figure 6
One approach to determine whether or not such dataset assignments can be linked to sample-related (possibly biologically relevant) trends has been the utilization of the newly emerging metabolome map. Here, the frequency of observance of a given molecule within a sample cohort can be compared with the frequency from another. Aminomalonic acid and acetoacetic acid have been found to occur 75% and 23% of the time in the normal samples, respectively. These same species are observed 95% and 93% of the time in the cardiovascular disease samples. It is noted that aminomalonic acid has been found in atherosclerotic plaques (31). Acetoacetic acid is created in the liver and is associated with the breakdown of excessive fatty acids. Recently, acetoacetate has been used as a serum marker to demonstrate that patients with severe congestive heart failure have altered energy metabolism being more ketosis-prone (32).
Again caution should be exercised in interpreting the results mentioned previously; the observance of different levels of aminomalonic acid and acetoacetic acid only suggests that they are putative biomarkers. Such a statement might even be premature, as many more samples would have to be analyzed to determine the normal variabilities of these species within the different sample cohorts. Beyond that additional work is the time-intensive and expensive task of biomarker validation (33). Rather, similar to the illustration shown previously, the molecules are disclosed here as an example of how one would approach the use of high-throughput GC×GC-TOFMS profiling in the field of personalized medicine. Using the hypothetical that such species are biomarkers, in the future, the molecular fingerprints (high-throughput metabolite profiles of many such species) for a given individual could be compared against a disease metabolome map to determine a level of predisposition.
Limitations and Future Directions
The greatest issue affecting the utility of the GC×GC-TOF-MS profiling measurement is the ability to assign the species observed in the datasets. The problem primarily arises from the lack of a high-quality metabolite database with reference mass spectra. As mentioned previously, identification was achieved by searching the NIST library. It is anticipated that as the field of metabolomics grows, there will be an increasing push to create searchable databases as occurred in the field of proteomics. Here we note that The Human Metabolome Project has made tremendous progress on cataloging many different compounds (6). It also should be stressed that metabolite profiling for personalized medicine might provide opportunities to develop identification schemes rapidly. For example, using the mapping approach described previously, one might not desire to know the identities of all species in a particular dataset. Rather, only those that are observed to differ between disease and normal samples would be targeted for identification. Thus, spectral libraries created from standards (as well as raw samples) could be created for only those species of interest.
Another limitation of the current approach is the timescale of the measurement. With 30 min required for each sample, the number of samples analyzed per day is ~50 (still well below 100). If the sample analysis time could be cut to 10 min per sample, the total number of samples that could be analyzed in a 24-h period would be 144. Such an increase in throughput is not entirely unreasonable. For example, in Figure 6, it is readily observable that the analytical space toward the end of the separation is not utilized very well (for both dimensions). This is confirmed further by analyzing the positions of features that have been determined to be peaks (that is, those for which S/N>100). Methods development is required to provide better separation. If the analytical space could be utilized better, it may be possible to decrease the second GC separation step thereby allowing adequate sampling of a shorter first GC separation. Much of our future work will focus on decreasing the overall experimental time while maintaining high resolution capabilities.
Conclusions
The plasma metabolome profiling experiments performed here have demonstrated the capability of the GC×GC-TOF-MS analytical platform. First, the platform is extremely robust, as more than 100 samples have been analyzed sequentially without stopping. Second, the approach offers a high-throughput, high-coverage molecular profiling capability. The second GC separation step increases the overall peak capacity by >20-fold, thereby allowing the use of a relatively short experimental timescale (20 min). Finally, the overall approach provides information-rich datasets that can be used to distinguish a normal sample cohort from a cardiovascular disease sample cohort. Preliminary investigations have even indicated that it might be possible to make connections between identified components responsible for the differences in the datasets and cardiovascular disease. Overall, this first assessment of the capabilities of GC×GC-TOF-MS techniques has been quite encouraging, which leads to the idea that such an analytical platform can play a major role in the development of personalized medicine based upon individual molecular profiling.
Acknowledgments
We wish to thank Mark Merrick and Tincuta Veriotti of LECO for their help in performing the high-throughput profiling experiments. We also acknowledge financial support from the NIH for sample collection (1 R43 HL082382-01).
Adam W. Culbertson*, W. Brent Williams*, Andrew G. Mckee*, Xiang Zhang†, Keith L. March§, Stephen Naylor*, and Stephen J. Valentine*
*Predictive Physiology and Medicine, Inc.; Bloomington, IN †University of Louisville;
Louisville, KY §Center for Vascular Biology and Medicine, Indianapolis, IN Indiana University; Indianapolis, IN
Please direct correspondence to svalentine@ppmwellness.com
References
(1) A.W. Culbertson, S.J. Valentine, and S. Naylor, Drug Discovery World Summer, 18–31 (2007).
(2) Personalized Medicine Coalition, The Case for Personalized Medicine (September 2006).
(3) The Royal Society: Personalised medicine: hopes and realities, September, 1-50 (2005).
(4) D.S. Wishart et al., Nucleic Acids Res. 35, D521–D526 (2007).
(5) M. Milburn, IPT 15/12/06, 40–42 (2006).
(6) Human Metabolome Project database at http://www.hmdb.ca/.
(7) O.N. Jensen, Curr. Opin. Chem. Biol. 8, 33–41 (2004).
(8) I. Nobeli, H. Ponstingl, E.B. Krissinel, and J.M. Thornton, J. Mol. Biol. Biol. 334, 697–719 (2003).
(9) I. Nobeli and J.M. Thornton, Bioessays 28, 534–545 (2006).
(10) E.M. Lenz, and I.D. Wislon, J. Proteome Res. 6, 443–458 (2007).
(11) I.D. Wilson, R. Plumb, J. Granger, H. Major, R. Williams, and E.M. Lenz, J. Chromatogr., B 817, 67–76 (2005).
(12) O. Fiehn, Comp. Funct. Genomics 2, 155–168 (2001).
(13) R. Goodacre, S. Vaidyanathan, W.B. Dunn, G.G. Harrigan, and D.B. Kell, Trends Biotechnol. 22, 245–252 (2004).
(14) R. Williams, E.M. Lenz, A.J. Wilson, J. Granger, I.D. Wilson, H. Major, C. Stumpf, and R. Plumb, Mol. BioSyst. 2, 174–183 (2006).
(15) Y. Ni, M. Su, Y. Qiu, M. Chen, Y. Liu, A. Zhao, and W. Jia, FEBS Lett. 581, 707–711 (2007).
(16) R.E. Williams, E.M. Lenz, J.A. Evans, I.D. Wilson, J.H. Granger, R.S. Plumb, and C.L. Stumpf, J. Pharm. Biomed. Anal. 38, 465–471 (2005).
(17) R.E. Williams, E.M. Lenz, J.S. Lowden, M. Rantalainen, and I.D. Wilson, Mol. BioSyst. 1, 166–175 (2005).
(18) W. Bertsch, J. High Resolut. Chromatogr. 23, 167–181 (2000).
(19) R.C. Ong and P.J. Marriott, J. Chromatogr. Sci. 40, 276–291 (2002).
(20) L.M. Blumberg, J. Chromatogr. Sci. 985, 29–38 (2003).
(21) P. Marriott and R. Shellie, Trends Anal. Chem. 21, 573–583 (2002).
(22) V.G. van Mispelaar, A.C. Tas, A.K. Smilde, P.J. Schoenmakers, and A.C. van Asten, J. Chromatogr., A 1019, 15–29 (2003).
(23) J. Harynuk and P.J. Marriott, Anal. Chem. 78, 2028–2034 (2006).
(24) W. Welthagen, R.A. Shellie, J. Spranger, M. Ristow, R. Zimmermann, and O. Fiehn, Metabolomics 1, 65–73 (2005).
(25) R.A. Shellie, C.W. Welthagen, J. Zrostlikova, J. Spranger, M. Ristow, O. Fiehn, and R. Zimmermann, J. Chromatogr., A 1086, 83–90 (2005).
(26) Indiana University Bloomington IRB (protocol .05-10338).
(27) Oh, C.; Huang, X.; Regnier, F. E.; Buck, C.; Zhang, X (submitted)
(28) J.C. Giddings, J. High Resolut. Chromatogr. Commun. 10, 319 (1987).
(29) A.M. McKee, A.W. Culbertson, B. Williams, S. Naylor, and S.J. Valentine, (submitted)
(30) S. O' Hagan, W.B. Dunn, J.D. Knowles, D. Broadhurst, R. Williams, J.J. Ashworth, M. Cameron, and D.B. Kell, Anal. Chem. 79, 464–476 (2007).
(31) J.J. Van Buskirk, W.F. Kirsch, D.L. Kleyer, R.M. Barkley, and T.H. Koch, Proc. Nat. Acad. Sci. USA 81, 722–725 (1984).
(32) J. Lommi, P. Koskinen, H. Näveri, M. Härkönen, and M. Kupari, J. Intern. Med. 242, 231–283 (1997).
(33) J.H. Revkin, C.L. Shear, H.G. Pouleur, S.W. Ryder, and D.G. Orloff, Pharmacol. Rev. 59, 40–53 (2007).

Study Examines Impact of Zwitterionic Liquid Structures on Volatile Carboxylic Acid Separation in GC
March 28th 2025Iowa State University researchers evaluated imidazolium-based ZILs with sulfonate and triflimide anions to understand the influence of ZILs’ chemical structures on polar analyte separation.


