Improved Analysis of Polyfluorinated Alkyl Substances in Environmental Samples Using Optimized ASTM Method 7968/7979
Special Issues
This article evaluates ASTM D7979-16 for the “direct” analysis of 30 PFCs and 19 mass-labeled surrogates. Instead of using solid-phase extraction, the PFCs were solubilized in a methanol–water mix and filtered if necessary, and the sample was injected into a LC–MS/MS system.
There has been an increasing awareness of the presence of polyfluorinated alkyl substances (PFASs) in water. A simple and robust method with quick turn-around time to determine these compounds is essential to providing accurate responses in a timely manner. In the method presented here, direct injection without solid-phase extraction (SPE) allows us to maximize throughput and to minimize background caused by the sample preparation step. We used liquid chromatography with triple-quadrupole mass spectrometry (LC–MS/MS) to analyze the fluorotelomer and unsaturated fluorotelomer acids included in ASTM International method 7968/7979. Fluorotelomer acids are observed as [M-H]- and [M-HF-H]-. Since the loss of HF in the fluorotelomer acids results in an ion with the same formula as the unsaturated fluorotelomer acids, and these two classes of compounds showed very similar retention times, we reduced the electrospray ionization (ESI) heater temperature to reduce HF loss and minimize false identifications.
In May 2016, the United States Environmental Protection Agency (US EPA) issued a health advisory of 70 parts per trillion (ppt) for perfluorooctanoic acid (PFOA) and perfluorooctanesulfonic acid (PFOS) in drinking water (1). Though a health advisory is not a regulation, public water supplies are encouraged to monitor their water for perfluoroaklyl substances (PFASs) contamination.
There are about 6000 large public water supply facilities. These facilities serve populations of 10,000 people or more. These larger public water supplies are required to monitor for perfluorinated compounds (PFCs). There are 115,000 public water supply facilities in the United States (2). Many of them serve 10,000 or fewer people. About 86% of the U.S. population receives water from a public water supply (3). Though there is no regulation, many of these facilities will be compelled to monitor PFCs (4).
PFASs, also known as perfluorinated compounds or PFCs, were used extensively in consumer and industrial products. Exposure in the United States is mainly from legacy use because PFCs are extremely persistent in the environment.
PFCs above 70 ppt have been detected in about 100 public water supplies (5), and detections above the minimum quantitation limit have been reported by about 400 samples (6). The occurrence of PFC is believed to be higher because previous measurements were made using EPA Method 537 (7). EPA Method 537, as written, is not sensitive enough to detect PFCs in concentrations below about 20 ppt (8).
Numerous states have issued their own health advisories, requiring public water supplies in those states to measure and report PFCs at concentrations lower than the 70 ppt National Health advisory (9). PFCs have also been reported in wastewater and in wastewater treatment sludge (biosolids) (10). Water resources are susceptible to contamination released by manufacturing, firefighting facilities, and airports. PFCs have been reported in high concentrations in groundwater surrounding crash and fire training military bases (11,12) prompting the Department of Defense (DOD) to begin monitoring as well (13).
EPA Method 537 is the only EPA method for the analysis of PFCs, and it is a drinking water method. Method 537 states in Section 1.6 that you may not modify sampling, sample preservation, sample extraction, or quality control requirements. The sample volume for Method 537 is 250 mL. Surrogates are added to the entire volume, which is transferred and passed through a solid-phase extraction (SPE) disk or cartridge. The analytes are eluted with methanol and the eluate is evaporated to dryness. Next, 1 mL of 96% methanol in water is added, then the internal standard is added, and the sample is analyzed by liquid chromatography–tandem mass spectrometry (LC–MS/MS). Any modification of the extraction described above is not allowed.
Laboratories are faced with a dilemma. The only EPA method for the analysis of PFCs is Method 537, a drinking water method. There is no EPA method applicable to complex matrices, such as wastewater, biosolids, or soils. Many laboratories tasked with analyzing PFCs in nondrinking water environmental samples are analyzing these samples using Method 537, or a modified version of Method 537. Because of inconsistent recovery of target compounds, many laboratories are applying isotope dilution (or a derivative of it) to correct for incomplete recovery. In essence, there are as many different methods used to run PFCs in nondrinking water samples as there are laboratories running them.
ASTM International has developed two LC–MS/MS PFC methods, ASTM D7979 (14) for aqueous samples, and ASTM D7968 (15) for biosolids and soils. Each method uses a similar 50% methanol in water solution to extract or dissolve PFCs from the sample. The primary difference is ASTM D7979 adds 5 mL of methanol to 5 mL of sample, and ASTM D7968 extracts 2 g of solid sample with 10 mL of a 50:50 methanol–water mixture. After the samples are extracted into the methanol water, the methods are essentially the same. The methods have been peer reviewed by ASTM D19 on Water and ASTM D34 on Waste Management. At the present time, each method has been single laboratory validated at the EPA Region 5 laboratory.
The EPA Office of Land and Emergency Management (OLEM) (also known as the Office of Solid Waste, or Superfund) and the Office of Water (wastewater) are each considering new regulations for PFCs (16). Before the EPA can issue a regulation, there must be an approved method. OLEM is revalidating ASTM D7979 and D7968 (as Region 5 methods). The EPA Office of Water (wastewater) cannot regulate unless the method is validated by multiple laboratories. This article describes our work as members of the ASTM D19.06 Task Group’s independent, second laboratory validation of ASTM D7979.
Experimental
ASTM D 7979-17 analyzes 31 compounds plus 14 isotopically labeled surrogates. We expanded the study to 30 PFC compounds and 19 surrogates, for a total of 49 compounds. The target list includes new PFCs of concern, including
- Perfluoroalkanesulfonates (PFASs), Perfluoroalkylcarboxylic acids (PFCAs),
- Perfluorooctanesulfonamides (FOSAs),
- Perfluorooctanesulfonamidoacetic acids (FOSAAs),
- Fluorinated telomer alcohols (FTOHs),
- Fluorinated telomer acids (FTAs),
- Unsaturated fluorinated telomer acids (FTUAs), and
- Fluorotelomer sulfonates (FTSs)
The compounds tested with abbreviations, the surrogates, and their chemical class are listed in Table I. For the remainder of this article, refer to the abbreviations in Table I to indicate individual compounds. The compounds in Table I are listed in their elution order. Note the 19, class representative, mass-labeled surrogate standards interspersed throughout the method. Also, note that retention time generally increases with increasing carbon number and decreasing polarity.
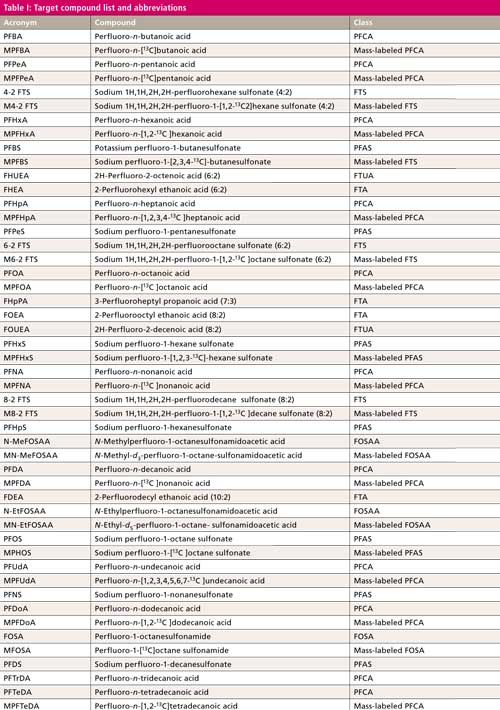
CLICK TABLE TO ENLARGE
Instrument Operating Conditions
Table II lists chromatography and mass spectrometer conditions.
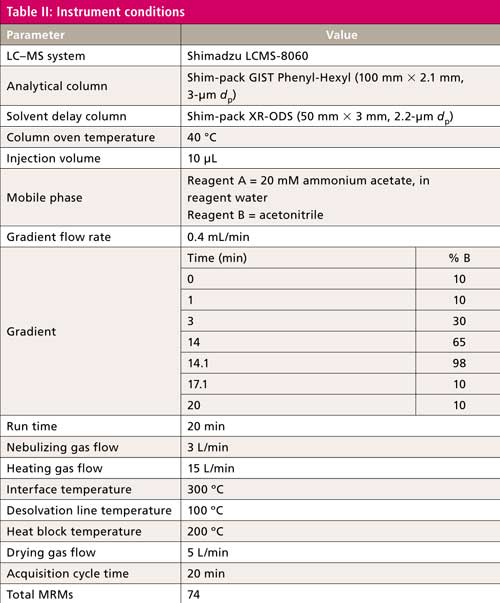
Chromatography was adjusted to obtain maximum resolution between peaks in the shortest time possible. This approach minimizes the coelution of isomers. The total run time of 20 min includes a final wash out with concentrated acetonitrile to remove contamination. Fluorotelomer acids, observed as [M-H]- and [M-HF-H]-, can result in an ion with the same formula as the unsaturated fluorotelomer acid. Even under optimized chromatography, these compounds have near identical retention times. The lower desolvation line temperature reduces HF loss and minimizes false identification.
The modified mobile phase reagents compared to the ASTM method do not use reagent C containing 400 mM ammonium acetate in 95:5 acetonitrile–water. The new reagents are easier to prepare, and obtain equivalent, if not better, peak shape and sensitivity. Reagents commonly contain PFC contamination. Mobile phase passes through the delay column positioned between the pump and the injection valve shifting the retention time of contamination peaks and ensuring that they are not coeluted with the analyte.
All compound parameters, including precursor ion, product ion, and collision energies, were optimized bypassing the analytical column using LabSolutions software. There are at least two multiple reaction monitoring (MRM) transitions for most of the analytes. Refer to Table III for quantitation MRM transitions and retention times.

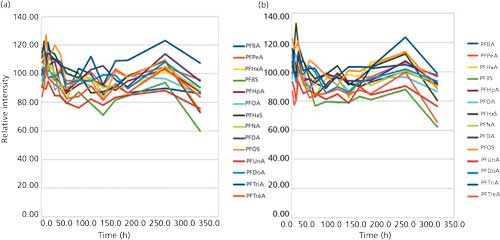
The shelf life of the standards was evaluated at 10% methanol, 20% methanol, 50% methanol, 70% methanol, and 30% methanol, in both glass and polypropylene vials. The plots shown in Figure 1 demonstrate that the 50% methanol in water solution used in the ASTM methods sufficiently dissolves the PFCs and keeps them in solution. The lower concentrations of methanol tests lost PFCs to the container walls; the methanol–water ratio must be 50:50 or the analyte is lost.
Figure 1: Shelf life study showing recovery for the 50% methanol solution in (a) glass vials and (b) polypropylene vials.
Standards mixes were purchased from Wellington Laboratories (17). Each mix was analyzed separately to ensure positive identification and maximum resolution. After we were satisfied with the retention times and operating conditions, we combined the mixes.
Calibration and Standardization
Nine calibration standards containing the perfluorinated compounds were prepared from purchased stock standard solutions. Target analytes and surrogate spike solutions were combined to ensure consistency. Stock standard solution A, containing the perfluorinated compounds and surrogates, was prepared at level 9 concentration and aliquots of that solution were diluted to prepare levels 1 through 8. Each standard was diluted with a 50:50 methanol–water mixture containing 0.1% acetic acid.
Next, 5-mL aliquots of each calibration standard were diluted with 50:50 methanol–water containing 0.1% acetic acid. Solutions were transferred to 2-mL amber glass LC vials. The calibration vials must be used within 24 h to ensure optimum results. If samples are allowed to sit, some analytes may settle. The vials should be mixed with a vortex mixer. Figure 2 shows recovery of analytes from a vial allowed to sit for 24 h, before and after mixing. An end mid-level calibration check should be prepared in a separate LC vial. Calibration standards may be used multiple times since glass vials with removable caps are being used. The analyte concentration in the vial may change after the vial cap is pierced because the vial caps do not reseal after puncture. Changing the caps immediately after the injection may alleviate this problem. Calibration standards are not filtered.
Figure 2: Recovery of PFCs before (left) and after (right) mixing the standard vial.

Inject each standard and obtain its chromatogram. An external calibration technique is used to monitor the primary and confirmatory MRM transitions of each analyte. LabSolutions software conducts the quantitation of the target analytes and surrogates using the primary MRM transition. The primary–confirmatory MRM transition area ratio should be within 35% of the individual laboratory’s accepted primary–confirmatory MRM transition area ratio. The primary MRM transition of each analyte is used for quantitation and the confirmatory MRM transition for confirmation. This gives added confirmation by isolating the precursor ion, forming two product ions by means of fragmentation, and relating it to the retention time in the calibration standard. The ASTM methods are external standard calibrations. Concentrations were calculated using LabSolutions software to generate a linear regression. The point of origin is excluded and a fit weighting of 1/x is used to give more emphasis to the lower concentrations.
Sample Extraction and Analysis
A surrogate spiking solution containing each isotopically labeled PFC was added to all samples, including method blanks, duplicates, laboratory control samples, matrix spikes, and reporting limit checks. A stock surrogate spiking solution was prepared at 20 µg/L in 95% acetonitrile: 5% water. Spiking 40 µL of this spiking solution into a 5-mL water sample resulted in a concentration of 160 ng/L of the surrogate in the sample. The results obtained for the surrogate recoveries should fall within 70–130%.
Next, 5 mL of sample was collected in a 15-mL centrifuge vial. Also, 5 mL of reagent water for a blank was prepared as well as an LCS containing known amounts of PFCs and a reporting limit check containing each PFC at the lowest calibration concentration. Then 40 µL of the surrogate spiking solution and 5 mL of methanol were added to each sample, blank, and control sample. Next, the sample was shaken and mixed on a vortex mixer for 2 min. Finally, the sample was filtered, 10 µL of acetic acid was added, and it was transferred to an autosampler vial for analysis.
Instrument and Method Performance
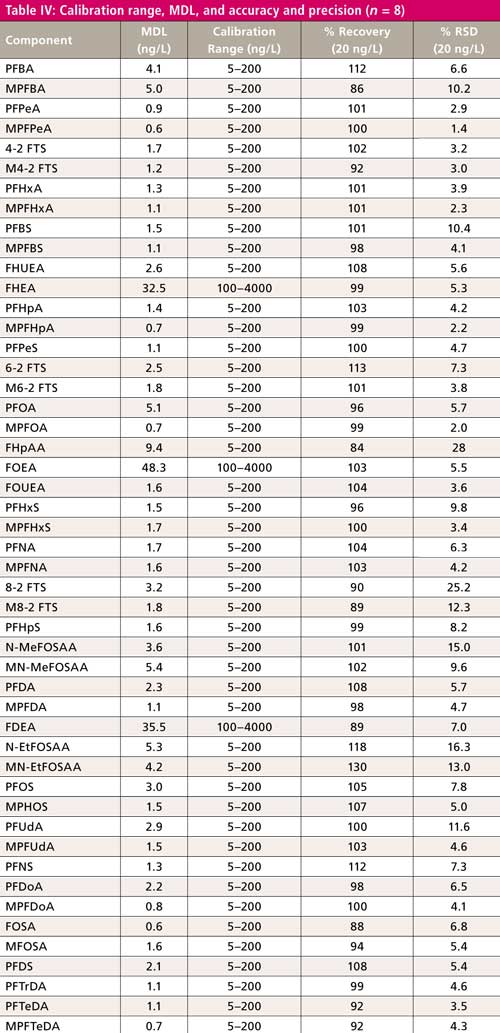
Experiments were made to verify linearity, accuracy, precision, and method detection limits (MDL). Calibrations were made using nine points at the concentrations specified in the ASTM method. The linearity of the curves was evaluated using 1/x weighting and ignoring the origin. The calibration range, MDL, and method reporting limits (MRLs), with selected accuracy and precision, are shown in Table IV.
Conclusion
This article evaluated ASTM D7979-16 for the “direct” analysis of 30 PFCs and 19 mass-labeled surrogates. Instead of solid-phase extraction, as is used by the EPA drinking water Method 537, the ASTM methods specify solubilizing the PFCs in a methanol–water mix, filtering if necessary, and injecting the sample into an LC–MS/MS system. 19 isotopically labeled surrogates were used with similar functional groups. The results obtained for the surrogate recoveries shall fall within the QC limits. The results obtained for labeled surrogates were not used for recovery corrections for the native compounds.
The method simplifies extraction and analysis, eliminating sources of contamination and potential loss of analyte. With the exception of a few method-allowed modifications, we ran the method exactly as written. The method appears to be rugged and of sufficient accuracy and precision to analyze the matrices listed in the scope. ASTM D19 attempts to create new methods to take advantage of new technology that minimizes labor while still obtaining data suitable for its intended purpose. ASTM D7979-16 (and its equivalent soil method D7968-17) certainly fits that category.
References
- https://www.epa.gov/sites/production/files/2016-06/documents/drinkingwaterhealthadvisories_pfoa_pfos_updated_5.31.16.pdf, accessed August 12, 2017.
- https://www.epa.gov/dwreginfo/information-about-public-water-systems, accessed August 12, 2017.
- https://water.usgs.gov/watuse/wups.html, accessed August 12, 2017.
- http://www.ewg.org/news/testimony-official-correspondence/epa-needs-set-enforceable-standards-currently-unregulated#.WY-Vq-mQxdg, accessed August 12, 2017.
- http://static.ewg.org/reports/2015/pfoa_drinking_water/interactive_map/index.html?_ga=2.12980151.104472910.1496333160-2059375895.1496333051, accessed August 12, 2017.
- http://www.ewg.org/research/teflon-chemical-harmful-at-smallest-doses/nationwide-water-sampling#.WY-XU-mQxdg, accessed August 12, 2017.
- EPA Method 537 rev1.1, Determination of Selected Perfluorinated Alkyl Acids in Drinking Water by Solid Phase Extraction and Liquid Chromatography/Tandem Mass Spectrometry (LC/MS/MS) (U.S. Environmental Protection Agency, Washington, D.C., Sept. 2009).
- http://www.nj.gov/dep/watersupply/pdf/testing-subcompql-pfoa-8.29.16KA.pdf, accessed August 12, 2017.
- http://www.healthvermont.gov/response/environmental/pfoa-drinking-water-2016, accessed August 12, 2017.
- C. Gomez-Canela, J.A.C Barth, and S. Lacorte, Environ. Sci. Pollut. Res. 19(9), 4109–4119 (2012).
- https://theintercept.com/2015/12/16/toxic-firefighting-foam-has-contaminated-u-s-drinking-water-with-pfcs/, accessed August 12, 2017.
- https://pfasproject.com/pfas-contamination-site-tracker/, accessed August 12, 2017.
- http://themilitaryengineer.com/index.php/tme-articles/tme-magazine-online/item/418-investigating-emerging-contaminants, accessed August 12, 2017.
- ASTM D7979-16, Standard Test Method for Determination of Perfluorinated Compounds in Water, Sludge, Influent, Effluent and Wastewater by Liquid Chromatography Tandem Mass Spectrometry (LC/MS/MS) (ASTM International, West Conshohocken, Pennsylvania, 2016, www.astm.org).
- ASTM D7968-17, Standard Test Method for Determination of Polyfluorinated Compounds in Soil by Liquid Chromatography Tandem Mass Spectrometry (LC/MS/MS) (ASTM International, West Conshohocken, Pennsylvania, 2017, www.astm.org).
- https://www.epa.gov/sites/production/files/2017-04/documents/pfas_methods_tech_brief_09mar17_final_508compliant.pdf, accessed August 13, 2017.
- http://well-labs.com/, accessed August 13, 2017.
William Lipps, Brahm Prakash, and Tairo Ogura are with Shimadzu Scientific Instruments in Columbia, Maryland. Direct correspondence to: wclipps@shimadzu.com

University of Tasmania Researchers Explore Haloacetic Acid Determiniation in Water with capLC–MS
April 29th 2025Haloacetic acid detection has become important when analyzing drinking and swimming pool water. University of Tasmania researchers have begun applying capillary liquid chromatography as a means of detecting these substances.

.png&w=3840&q=75)

.png&w=3840&q=75)


.png&w=3840&q=75)


.png&w=3840&q=75)


