Improved Analysis of FAMEs using Gas Chromatography with Vacuum Ultraviolet Detection (GC–VUV)
The Column
The powerful characteristics of gas chromatography (GC) with VUV (vacuum ultraviolet) detection for the analysis of saturated and unsaturated fatty acids are described.
Photo Credit: Aaron Aldrich Fine Art/Getty Images
The powerful characteristics of gas chromatography (GC) with VUV (vacuum ultraviolet) detection for the analysis of saturated and unsaturated fatty acids are described.
The determination of the fatty acid composition of edible oils and fats (as their methyl esters or fatty acid methyl esters [FAMEs]) is routinely performed in food laboratories globally. The level of detail that is required depends on the intended use of the data. For label claim purposes a distinction between saturated, mono-unsaturated, and poly-unsaturated fatty acids generally suffices. Studies on the health impact of fat consumption, on the other hand, require detailed information on chain length distributions and number and positions of double bonds, as well as double bond orientation (
cis
versus
trans
).
Trans
levels have attracted increased attention in recent years because of adverse health impacts associated with such acids, such as increased cholesterol levels and an increased risk of coronary hearth diseases.
1
The standard method for
trans
-FAME analysis is capillary gas chromatography (GC) on a 50 m to 100 m highly polar cyanopropyl column. With this technique
trans
analysis is possible in relatively “simple” samples such as untreated or mildly processed vegetable oils and fish oils. For more complex samples, more sophisticated methods such as combined high performance liquid chromatography (HPLC) on silver-ion columns (Ag+-HPLC) and GC are needed.
2,3
These techniques provide a good separation, but at the expense of an increased complexity and longer analysis times. GC with VUV (vacuum ultraviolet) detection offers numerous advantages compared to these traditional techniques. The GC–VUV analysis separates saturated FAMEs from the unsaturated
cis
/
trans
FAMEs, and also identifies the number and position of the double bonds.
Fatty Acid Analysis
Fatty acids (FA) are classified as saturated, mono-, di-, tri-unsaturated, and poly-unsaturated acids. The unsaturated FAs can be divided into
cis
and
trans
-FAs. Since December 2014 the regulations for the nutrition labels on food products have become more strict as a result of the increased blood cholesterol and cardiovascular risks caused by saturated and trans-FAs.
4,5
This is in contrast to
cis
-FAs, which have the opposite effects.6 Prior to analysis FAs are derivatized to fatty acid methyl esters (FAMEs) FAs.
7
Gas chromatography (GC) is a mature analytical technology used predominately for separating and quantifying the components of complex organic chemical mixtures. The addition of mass selective detectors has extended the use of GC to include compound identification. A wide range of columns and sample introduction techniques allow GC to solve most analytical problems for volatile and semi-volatile compounds. Differentiating between saturated and
cis
/
trans
unsaturated FAMEs using only flame ionization detection (FID) is based on retention indices. GC coupled to a mass spectrometer (GC–MS) is a more common identification technique. However, the MS detector cannot distinguish between
cis
/
trans
isomers because the mass spectra of such compounds are identical. Absorption spectroscopy, although widely used in liquid chromatography (LC), has not been widely adopted in GC because of the relative lack of absorption for most analytes in the gas phase within the traditional regions of the electromagnetic spectrum. Recent scientific advances
8
have allowed for the use of very short wavelengths (120–240 nm), a region where essentially all chemical compounds absorb. The use of this region, which has traditionally been restricted to bright source synchrotron facilities, has been enabled by the use of specially coated reflective optics paired with a back-thinned coupled device (CCD) light path monitor. These can simultaneously assess absorption features across the spectrum for peaks eluting from a GC column. The resulting spectra allow the identification or classification of unknowns as well as the capacity to deconvolute co-eluting, spectrally distinct compounds. A VUV detector can detect in this short wavelength of 120–240 nm and can be connected to any standard GC through a heated transfer line. The wavelength range of the VUV detector resolves many limitations of a GC–FID and GC–MS analysis.
Experimental
The GC–VUV system used for this study consists of a gas chromatograph configured with an automatic liquid sampler (Agilent Technologies), a split/splitless injector hyphenated to a vacuum ultraviolet detector (VUV Analytics). The separation of the FAMEs was performed using a 50 m x 0.25 mm, 0.2-µm CP-Sil 88 capillary column (Varian), isothermally at 176 °C. Hydrogen was used as the carrier gas (1 mL/min) and the make-up gas for the flow cell was nitrogen. Data was acquired in the range of 120–240 nm using controlling software (VUV Analytics).
The absorption spectra of the saturated and unsaturated fatty acids possess distinct characteristics as demonstrated in Figure 1, which enable the simple classification of the eluted peaks into two groups. Figure 1 shows the absorption spectrum of C16:0 saturated FAME in the wavelength range of 125–160 nm, because of the ∂ → ∂ * transition in the single carbon bonds.
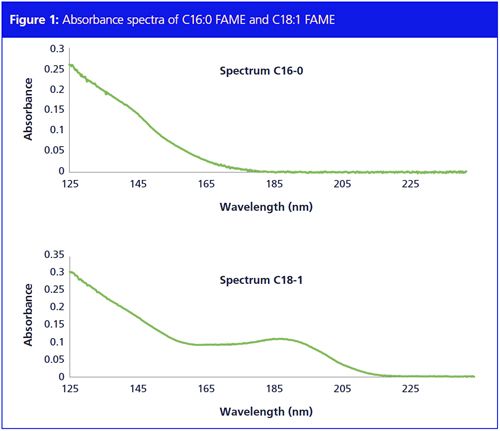
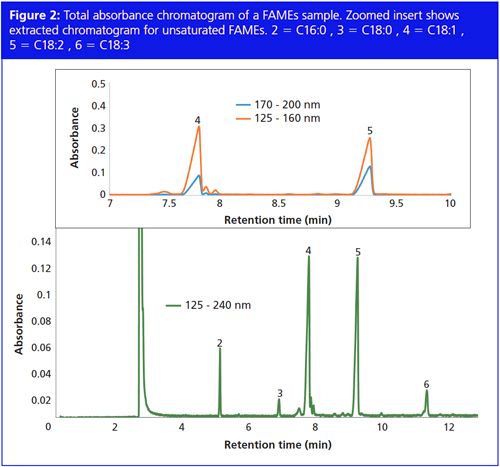
All saturated FAMEs absorb in this low wavelength range; all unsaturated FAMEs exhibit an additional strong absorbance at longer wavelengths (170–220 nm). Figure 1 also shows a spectrum of a C18:1 unsaturated FAME. Unsaturated FAMEs have two absorbance maxima; 125–160 nm and 170–200 nm. All unsaturated FAMEs show the same profile. The difference in spectral response between saturated and unsaturated FAMEs allows for the use of spectral filters to exclude the unsaturated FAMEs from the chromatogram. Figure 2 shows the total absorbance chromatogram of a FAMEs sample. Spectral filters from 125–160 nm and 170–200 nm are applied to the full chromatogram to obtain the extracted absorbance chromatograms, demonstrating that only unsaturated FAMEs remain visible.
Level of Unsaturation
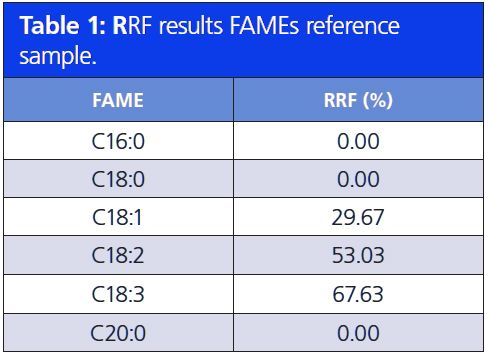
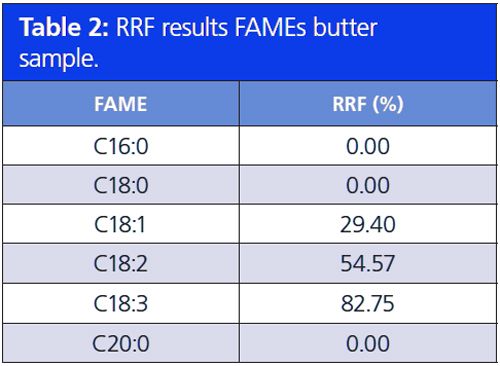
The two absorbance maxima, 125–160 nm and 170–200 nm, can also be used to determine the level of unsaturation. The higher the number of double bonds in an unsaturated FAME, the higher the absorbance in the 170–200 nm wavelength region, that is, a higher peak area in the 170–200 nm region compared to the 125–160 nm region. By calculating the relative response factor (RRF) of these two absorbance regions, the level of unsaturation can be determined. The RRF is the ratio of the total peak absorbance of the 170–200 nm region and the total peak absorbance of the 125–160 nm region. Tables 1 and 2 show the results of the RRF value of a FAMEs reference sample and a butter sample. The RRF increases as a function of the number of double bonds present in an unsaturated FAME. All saturated FAMEs have a RRF percentage of 0%. Unsaturated FAMEs with one double bond have an RRF of about 30% and 50–60% for two double bonds. The RRF is in the range of 65–85% for three double bonds. Poly unsaturation results in an RRF of over 100%.
Cis/trans Identification
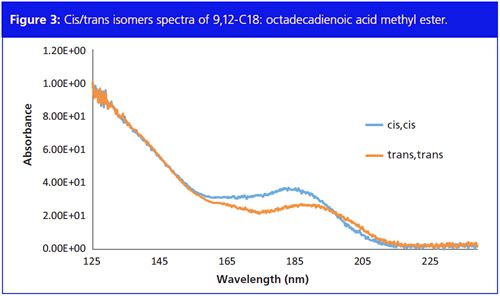
Figure 3 shows the absorption spectra of C18 FAME with 2 double bonds and the
cis
positioned at C9 + C12, and C18 FAME with 2 double bonds and the
trans
positioned at C9 + C12. The λ-max of the
trans
isomers is higher compared to the
cis
isomers – 185 nm versus 188 nm. Based on these small nanometer-level absorbance differences, isomers can be deconvolved and identified individually.
Conclusion
GC–VUV can be applied for a detailed analysis of FAMEs. VUV absorption spectra are unique and with the use of spectral filters the unsaturated FAMEs can be easily distinguished from the saturated FAME. The number of double bonds present in an unsaturated FAME can be determined based on peak area of the two different wavelength areas. In addition,
cis/trans
isomer identification is possible with VUV detection, based on their specific spectrum and deconvolution software.
References
[1] J.M. Hodgson, M.L. Wahlqvist, J.A. Boxall, and N.D. Balazs,
Atherosclerosis
120
, 147 (1996). [2] J. Fritsche, S. Fritsche, M.B. Solomon, M.M. Mossoba, M.P. Yurawecz, K. Morohouse, and Y. Ku,
Eur. J. Lipid Sci. Technol.
102
, 667 (2000). [3] S. de Koning, H.-G. Janssen, M. van Deursen, and U.A.Th. Brinkman,
J. Sep. Sci.
27
, 397 (2004). [4] Dariush Mozaffarian, Martijn B. Katan, Alberto Ascherio, Meir J. Stampfer, and Walter C. Willett,
Trans Fatty Acids and Cardiovascular Disease
354
, 1601–1613 (2006). [5] Alberto Ascherio, Meir J. Stampfer, and Walter C. Willett,
Trans fatty acids and coronary heart disease
, (Departments of Nutrition and Epidemiology, Harvard School of Public Health, The Channing Laboratory, Department of Medicine, Brigham and Women’s Hospital, p 1–21, 1999). [6] Charles E. Elson, Norlin J. Benevenga, David J. Canty, Robert H. Grummer, Joseph J. Lalich, John W. Porter, and Arlow E. Johnston,
Department of nutritional Sciences
40
, 115–137 (1981). [7] Ana P. Carvalho and F. Xavier Malcata,
J. Agric. Food Chem.
53
, 5049–5059 (2005). [8] K.A. Schug, I. Sawicki, D.D. Carlton, H. Fan, H. M. McNair, J.P. Nimmo, P. Kroll, J. Smuts, Ph. Walsh, and D. Harrison,
Anal. Chem.
86
, 8329 (2014).
Sjaak de Koning
is a Product Manager at Da Vinci Laboratory Solutions in Rotterdam, the Netherlands. He obtained his Ph.D. degree in analytical chemistry in 2006 from the Free University of Amsterdam, the Netherlands, and has published over 25 papers in refereed journals and conferences. His research interests include chromatography techniques and advanced detections.
Larissa Ram
is a Junior Application Specialist at Da Vinci Laboratory Solutions in Rotterdam, the Netherlands. In addition she is a masters student in the field of analytical chemistry at the University of Amsterdam and the Free University of Amsterdam. She obtained her Cum Laude bachelor degree in analytical chemistry from the University of Rotterdam, the Netherlands in 2015. Her research interests lie mainly in the area of chromatography, VUV detection, and other advanced detections.
Removing Double-Stranded RNA Impurities Using Chromatography
April 8th 2025Researchers from Agency for Science, Technology and Research in Singapore recently published a review article exploring how chromatography can be used to remove double-stranded RNA impurities during mRNA therapeutics production.


