Important Aspects of UV Detection for HPLC
LCGC North America
So you think you know all about UV detection? Double check your understanding with this short primer on the principles and key variables of ultraviolet visible detection.
The standard ultraviolet (UV) detector for high performance liquid chromatography (HPLC) measures the absorbance of monochromatic light of fixed wavelength in the UV or visible wavelength range (typically between 190 nm [UV] and 400 nm [blue light]) against a reference beam and relates the magnitude of the absorbance to the concentration of analyte in the eluent passing through a flow cell contained within the instrument.
Analytes suitable for UV detection typically contain unsaturated bonds, aromatic groups, or functional groups containing heteroatoms, which contain π* and σ* nonbonding orbitals into which electrons are promoted to absorb the incident energy. These nonbonding orbitals contain a wide distribution of vibrational and rotational energy levels that lead to a distribution of absorbance energies and therefore spectra with broad, rather than sharp features.
Analyte concentration can be determined from the Beer-Lambert law (equation 1):
A = ε · c · l [1]
where ε is the molar absorptivity coefficient (dm3 mol-1 cm-1), c is the concentration (mol dm-3), A is the absorbance, and l is the pathlength of the light through the flow cell (cm). If the molar absorptivity coefficient for the analyte is not known, then standard solutions of known concentration can be used to determine it or to calibrate the instrument (concentration versus absorbance) response using a calibration curve or response factor.
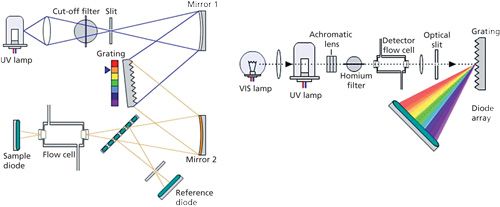
Polychromatic light from a deuterium (UV) or tungsten (visible) lamp is focused onto the entrance slit of a monochromator. The monochromator selectively transmits a narrow band of selected wavelengths, via the use of a grating mounted on an electromechanical turntable, to the exit slit and ultimately through the flow cell. Analyte absorbance is measured using a beam splitter to compare light intensity reaching a sample photodiode with a reference photodiode, which is off-axis from the flow cell. This type of detector is known as a variable-wavelength detector.
In diode-array detection (DAD), radiation from the lamp is collimated through the flow cell followed by a mechanically controlled or fixed width slit. Radiation is dispersed via a holographic grating into individual wavelengths of light that are detected using a photodiode array. Each photodiode receives a different narrow wavelength band and a complete spectrum may be obtained for any point within the chromatogram, or a chromatogram may be deconvoluted to show only those signals because of a single or narrow range of wavelengths. In this way, targeted analysis, component identification, and the simultaneous quantitative analysis of signals at several discrete wavelengths may be achieved, making this form of the detector more widely applicable.

Establishing the correct wavelength at which to measure the response of the analyte is an important consideration in terms of robustness and sensitivity. That is usually achieved by studying the UV spectra of standards of the analytes of interest or by examining the spectra of each component within the chromatogram generated by diode-array detection. It should be noted that changes in the nature of the sample solvent, the pH of the solution, and the temperature can all change the position and intensity of absorption bands of molecules.
There are many other, more esoteric, settings that also need to be considered to optimize chromatographic detection using UV.
A good rule of thumb when choosing flow cell geometry is to keep the flow-cell volume to less than 10% of the average peak volume (width at the peak base × flow rate). In this way, peak dispersion because of the flow cell will be kept to a reasonable level. More modern instruments tend to offer light-pipe detector cells, which offer low dispersion and optimize sensitivity through amplification of absorbance via total internal reflection of the light passing through the flow cell.
Data sampling rates should be matched to the peak widths within the chromatogram to obtain enough measurement points across the peak for valid modeling of the elution profile and therefore robust quantitative measurement.
The size of the post flow-cell slit (sometimes called the slit width) and the number of wavelengths of light falling on each photodiode (sometimes called the bandwidth) are important considerations in diode-array detection. Decreasing the slit width usually lowers noise, but also lowers spectral detail (resolution), whereas reducing bandwidth generally reduces sensitivity but improves spectral resolution, so these two need to be carefully balanced, depending on the required outcomes from the analysis. The bandwidth setting can be matched to the natural bandwidth of the analyte spectrum by measuring the half-height width of the spectrum at the chosen wavelength.
The use of a reference wavelength in diode-array mode can help to remove signal contributions (noise and baseline drift) because of changes in eluent refractive index during gradient analysis. The reference window is typically chosen to be wide (100 nm) with the reference wavelength around 50 nm above the wavelength at which the analyte spectrum falls below 0.1 mAU.
For setting and optimizing the variables mentioned above, one should consult the detector manufacturer’s literature.

New Method Explored for the Detection of CECs in Crops Irrigated with Contaminated Water
April 30th 2025This new study presents a validated QuEChERS–LC-MS/MS method for detecting eight persistent, mobile, and toxic substances in escarole, tomatoes, and tomato leaves irrigated with contaminated water.
University of Tasmania Researchers Explore Haloacetic Acid Determiniation in Water with capLC–MS
April 29th 2025Haloacetic acid detection has become important when analyzing drinking and swimming pool water. University of Tasmania researchers have begun applying capillary liquid chromatography as a means of detecting these substances.
Prioritizing Non-Target Screening in LC–HRMS Environmental Sample Analysis
April 28th 2025When analyzing samples using liquid chromatography–high-resolution mass spectrometry, there are various ways the processes can be improved. Researchers created new methods for prioritizing these strategies.

.png&w=3840&q=75)

.png&w=3840&q=75)


.png&w=3840&q=75)


.png&w=3840&q=75)


