Detective Work, Part I: Simplify the Choices
LCGC North America
How to get started in the process of identifying the problem source for column-related problems.How to get started in the process of identifying the problem source for column-related problems.
How to get started in the process of identifying the problem source for column-related problems.
Those of you who listen to the public radio program A Prairie Home Companion will be familiar with Guy Noir, Private Eye, a fictional detective who “is trying to find the answers to life’s persistent questions.” Like Guy Noir, those of us involved with the practical operation of liquid chromatography (LC) systems often have persistent problems that recur. At first look, problems related to the LC column can be daunting, but if we have a technique to help us simplify the troubleshooting process, the job can be much less intimidating. In this month’s “LC Troubleshooting” installment, we identify the key column-related problems and their causes, then combine the two to give us a tool to help us know where to start when column-related symptoms appear. In future installments, we’ll look more closely at column failure symptoms and causes.
The Causes
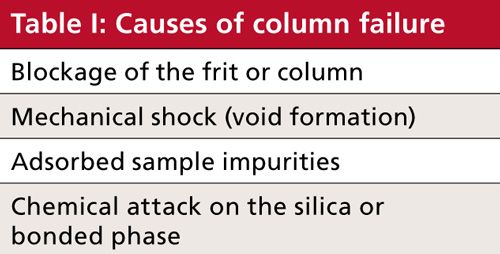
It seems like there are many things that can go wrong with an LC column to cause it to fail, but when you consider them carefully, these boil down to four main causes of failure. These are summarized in Table I. Let’s consider each of these briefly.

Blockage
The typical column comprises a stainless steel tube that holds <2–10 µm diameter spherical silica particles. The particles are held in the column by endfittings that contain frits typically of 0.2–2 µm porosity. Particulate matter injected with the sample or generated within the LC system by frictional wear or improperly prepared solvents can block the frits, especially at the column inlet. In some cases, the column itself can become blocked.
Voids
It is possible to mechanically damage the silica bed structure in the column. This is much more of an historic problem than a current one. It was not uncommon 25 years ago to see a column “collapse” when dropped on the floor or sometimes merely from the shock of repetitive cycles of the injection valve. Current column packing technology has largely eliminated this problem, but it does still occur occasionally. With reasonable care, the standard silica-based reversed-phase column available today is quite durable to minor mechanical shocks.
Adsorbed Impurities
Most samples that we inject contain material other than the analytes of interest. After all, the objective of a chromatographic method is to separate the compounds we want from the material we don’t want. When the samples originate in a biological matrix or solid sample, we usually must include sample pretreatment steps in our method process to remove some of the unwanted material that can foul the column. However, most pretreatment processes only remove most of these impurities. Those impurities that remain can stick strongly or irreversibly to the column packing, gradually changing its chemical characteristics. In some cases, this material can be responsible for column blockage, as discussed above.
Chemical Attack
The silica spheres that form the backbone of the modern LC column are quite durable, but they are not indestructible. The same goes for the bonded phase, such as a C18 phase, attached to the surface of the silica. A common rule of thumb instructs us to operate silica-based columns in a range of 2 < pH < 8. At pH values below 2, the bonded phase tends to hydrolyze at its attachment point and fall off the column. At pH values above 8, the silica itself tends to dissolve. There are many silica-based columns on the market today that extend the usable pH range, for example, 1.5 < pH < 12, but even these products are subject to degradation at extreme pH values. Other kinds of chemical attack can occur, as well.
I like the way my business partner Tom Jupille summarizes Table I: “Columns don’t die a natural death . . . we murder them.” We choke them (blockage). We bludgeon them to death (mechanical shock). We poison them (adsorbed impurities). And we rot them away (chemical attack).
The Symptoms
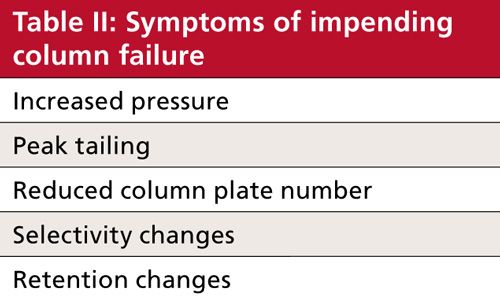
We saw in Table I and the associated discussion above that there is a limited number of ways to kill a column. However, those are the causes of column failure, and we generally do not observe the causes. Instead we observe symptoms, either in the chromatogram or in other system parameters, such as pressure. Just as the number of causes was short, the symptoms of column failure also form a short list, which I’ve summarized in Table II. Next, let’s briefly consider each of these symptoms.

Pressure
Some changes in column pressure are normal. A change in flow rate from 1 mL/min to 2 mL/min will double the column pressure. Under otherwise constant operating conditions, a mobile phase using acetonitrile as the organic solvent will have a lower pressure than one containing methanol. Reversed-phase gradient methods typically have a pressure profile that increases mid-gradient. With any of these cases, however, the pressure changes should be constant and consistent. That is, each time the method is run, the pressure changes should be the same. With most columns, the pressure will gradually rise over the lifetime of the column, and this will vary with the method and sample type. However, it is not unusual for the column pressure to increase by 50% by the time 2000 samples have been run through it. At other times, the pressure will rise much more rapidly and sometimes abruptly. In extreme cases, the pressure will rise suddenly to the upper-pressure limit of the LC system and the pump will shut off.
Peak Tailing
The ideal chromatographic peak will be symmetric with the shape of a Gaussian distribution. In practice, however, most peaks in LC will tail a bit. Peak tailing is common enough that most system suitability tests include a specification for the maximum allowable peak tailing, most commonly measured as a tailing factor (TF), or asymmetry factor, (As). A value of TF or As < 1.5 usually is acceptable, although some methods will tolerate values of 2 or more. Just as it is normal to see gradual pressure increases over the lifetime of a column, a slow increase in peak tailing is normal. At some point, however, the tailing will no longer be tolerable because it compromises peak measurement (integration) or separation from other peaks.
Plate Number Loss
The column plate number, N, (or column efficiency) is a measure of how well the column behaves relative to an ideal column. Narrower peaks have larger plate numbers, and thus are taller and easier to separate from other peaks. A minimum required plate number is among the specifications that manufacturers use to evaluate the success of column preparation. We usually don’t measure the plate number under ideal conditions, such as the manufacturers do, but system suitability tests often include a plate number (or peak width) requirement for each method. Plate numbers tend to be lower with “real” samples than under ideal test conditions, and N often will vary from one method to another. As with most other column performance measures, however, the plate number will gradually decrease over the lifetime of the column. Rapid or abrupt loss in plate number is a symptom that something is wrong. Low plate numbers mean broad peaks that are harder to integrate and more difficult to separate from neighboring peaks.
Selectivity
Selectivity is a measure of the peak spacing between two peaks. We can measure selectivity with the separation factor, α, but it is more common to measure the resolution, Rs, based on the retention times of two peaks and their widths either at half-height or baseline. Of course, one of the primary objectives of a chromatographic method is to sufficiently separate adjacent peaks so that they can be qualitatively identified and quantitatively measured with acceptable precision and accuracy. A measure of selectivity or resolution is part of the system suitability test for most methods. Changes in selectivity are indicative of some change in the column.
Retention
The retention time of a peak is a primary way to qualitatively identify a sample peak by comparing it to the retention time of a known reference standard. Retention times tend to be fairly constant with most methods, varying by perhaps one or two units in the second decimal place (for example, ±0.02 min), although larger variations are common with some methods. When we see a change in retention that is outside the normal variation, it is indicative that something is going wrong. Because selectivity and retention time use some of the same measurements, a change in retention will often result in a change in selectivity, and a change in selectivity will always include a change in retention time for at least one of the peaks under consideration.
Correlations
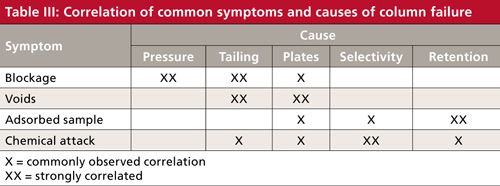
After we have reduced our potential column problems to short lists of causes and symptoms, we can construct the truth table shown in Table III. Here, I have correlated the most likely causes with each symptom. Unfortunately, LC problems don’t always comply with the rules, so there will be exceptions to each classification, but don’t panic-these general rules will cover the most common situations. In each case, a single X indicates a common correlation and a double X is a strong correlation. Let’s look at the correlations.

Blockage–Pressure–Tailing
The first symptom of column blockage that we usually see is an increase in column pressure. One of the most common modes of column failure is partial blockage of the frit at the inlet of the column. This will cause similar defects (tailing, split peaks, or double peaks) in every peak in the chromatogram. Partial frit blockage usually is accompanied by increased pressure, but increased pressure doesn’t necessarily mean that the frit is blocked. Often the column plate number drops when blockage occurs, but this isn’t always the case. Sometimes a column blockage can be corrected or partially corrected by reverse-flushing the column.
Voids–Tailing
Column voids can be formed from mechanical abuse or a chemical attack on the column. Usually chemical attack will be accompanied by other symptoms (see below). Void formation can be sudden or gradual in onset, but it is irreversible. The best fix is to replace the column, then change the chromatographic conditions or the column source so that voids don’t occur again.
Adsorbed Sample–Selectivity–Retention
When sample or matrix components are adsorbed onto the column surface, the column chemistry changes. Just as with a switch from a C18 to a cyano column, we expect changes in both peak spacing (selectivity) and retention when column chemistry changes for other reasons. One way to think of adsorption is that the column particles gradually get coated with sample junk, and this masks the normal retention mechanism. Thus, retention changes are the strongest symptom of adsorbed sample; changes in selectivity are common, but won’t occur in all cases. The accumulation of adsorbed sample components is gradual and should correlate with the number of samples injected. As a result, the symptoms will gradually appear over time. It is good to have a specification for selectivity and retention as part of system suitability, so that any changes can be monitored easily.
Chemical Attack–Tailing–Selectivity–Retention
As mentioned earlier, chemical attack is common if the pH limits of the column are not observed; other sources of chemical attack can occur for specific sample types. Chemical attack will alter the bonded phase or silica backbone of the column. This will change the chemistry of the system, and whenever chemistry changes, peak spacing (selectivity) is almost guaranteed to change, too. Chemical attack on the bonded phase will expose more of the silica surface, which is a primary contributor to peak tailing, so tailing usually will accompany selectivity changes. Selectivity describes the spacing between peaks, so if selectivity changes, the retention of at least one of the peaks also changes.
Plate Number Changes
In Table III, you can see that changes in the column plate number are common for any of the listed causes of column failure. This tells us that plate number alone may not be a very good diagnostic tool when trying to identify the source of column problems. However, because plate number changes are likely to occur for any of the noted causes, monitoring the plate number is a good first line of defense. That is, if we follow the value of the column plate number and see it changing, it is indicative that something is wrong with the column. At that point, we can look for other symptoms to see if we can further isolate the problem source.
Summary
We have seen that the source of problems related to LC columns and the symptoms we observe can be correlated. Although it is by no means a perfect tool, the truth table shown as Table III can be a useful tool to help isolate the source of column failure when a specific set of symptoms are observed. One of the rules of thumb I often mention in “LC Troubleshooting,” is the divide-and-conquer rule. This tells us that we should pick physical or mental experiments that allow us to classify LC problems such that we can eliminate many or most possible causes quickly. This allows us to concentrate on the most probable causes of the observed symptoms so that we can quickly correct the problem and get back to normal system operation.
This discussion gave us a high-level overview of how to diagnose column-related problems that we observe. In future installments, we’ll look at some of the symptoms and causes in more detail.

John W. Dolan
“LC Troubleshooting” Editor John Dolan has been writing “LC Troubleshooting” for LCGC for more than 30 years. One of the industry’s most respected professionals, John is currently the Vice President of and a principal instructor for LC Resources in Lafayette, California. He is also a member of LCGC’s editorial advisory board. Direct correspondence about this column via e-mail to John.Dolan@LCResources.com

Polysorbate Quantification and Degradation Analysis via LC and Charged Aerosol Detection
April 9th 2025Scientists from ThermoFisher Scientific published a review article in the Journal of Chromatography A that provided an overview of HPLC analysis using charged aerosol detection can help with polysorbate quantification.
Removing Double-Stranded RNA Impurities Using Chromatography
April 8th 2025Researchers from Agency for Science, Technology and Research in Singapore recently published a review article exploring how chromatography can be used to remove double-stranded RNA impurities during mRNA therapeutics production.


