Tools to Improve Protein Separations
LCGC North America
The capability to separate and analyze a wide range of proteins in complex systems remains a prime requirement in the biochemical sciences. Intact protein separations are especially difficult as these large molecules can present different conformations, association states and amphoteric features with chromatographic surfaces. Combining high performance liquid chromatography (HPLC) and ultrahigh pressure liquid chromatography (UHPLC) with mass spectrometry (MS) has proven to be an effective approach for solving difficult problems involving protein analyses. Considerable effort has been made to develop columns for separating proteins with high efficiency for reversed-phase, ion-exchange, size-exclusion chromatography, hydrophilic interaction liquid chromatography (HILIC), and hydrophobic interaction chromatography (HIC). Even so, many situations still exist where insufficient resolution is available for accurate protein analysis even when high-resolution MS is available. This presentation provides a brief overview of new approaches being investigated in the author's laboratories for obtaining superior protein separations. This includes new approaches for obtaining better protein separations with columns of highly-efficient superficially porous silica particles and techniques using MS-friendly mobile phases with effective methods for changing protein selectivity (band spacings) by column type and organic mobile phase modifiers.
Tools to Improve Protein Separations
The capability to separate and analyze a wide range of proteins in complex systems remains a prime requirement in the biochemical sciences. Intact protein separations are especially difficult as these large molecules can present different conformations, association states, and amphoteric features with chromatographic surfaces. Combining high performance liquid chromatography (HPLC) and ultrahigh-pressure liquid chromatography (UHPLC) with mass spectrometry (MS) has proven to be an effective approach for solving difficult problems involving protein analyses. Considerable effort has been made to develop columns for separating proteins with high efficiency for reversed-phase, ion-exchange, size-exclusion chromatography, hydrophilic-interaction chromatography (HILIC), and hydrophobic interaction chromatography (HIC). Even so, many situations still exist where insufficient resolution is available for accurate protein analysis even when high-resolution MS is available. This article provides a brief overview of new approaches being investigated in the authors’ laboratories for obtaining superior protein separations. This includes new approaches for obtaining better protein separations with columns of highly efficient superficially porous silica particles and techniques using MS-friendly mobile phases with effective methods for changing protein selectivity (band spacings) by column type and organic mobile-phase modifiers.
Approaches are needed to solve difficult problems involving the separation of proteins. Studies attempting to identify protein markers for profiling and diagnosing various health problems such as cancer or degenerative diseases can include difficult separations of proteins that are often in very complex systems (1,2). Many of the proteins of interest are quite large, for example, monoclonal antibodies as well as other multi-subunit proteins, and these present special problems in terms of resolution and separation speed. Current methods for separating and characterizing proteins include various chromatographic separation approaches such as ion-exchange, size-exclusion, hydrophilic interaction, hydrophobic interaction, and reversed-phase chromatography (3). The latter method is especially attractive for many applications because of the capability for efficient and fast separations, using conditions that are readily integrated with subsequent analytical tools such as mass spectrometry (MS).
This article attempts a brief overview of some experiments that aim to provide better tools for improving protein separations. New 2.0-µm wide-pore, high-purity silica superficially porous particles (SPPs) have been developed specifically for the efficient and fast reversed-phase separation of proteins. A paper outlining the advantages of 2.0-µm SPPs with 90-Å pores for the efficient, rapid separation of small molecules has previously been published (4). Columns of the new wide-pore 2.0-µm particles exhibit separation efficiencies greater than those of existing sub-2-µm totally porous particles (TPPs). However, in addition to high efficiencies, different selectivities or band spacing changes may be needed for difficult protein separations, particularly when overlapping or coeluted peaks are a problem. Other reports suggest selectivity changes for protein separations by altering the mobile phase in reversed-phase separations (5,6). We have studied the effect of using different organic mobile-phase modifiers to change protein separation selectivity based on the well-known solvent selectivity triangle approach to provide a more systematic method for choosing an effective modifying solvent. Some different stationary phases for protein separations have been previously reported (7), but no studies based on systematic functional group effects have been attempted. We have synthesized stationary phases with different functional groups based on a stationary phase selectivity triangle to study their effect on selectivity changes for proteins. Also reported are results for an alternate acidic ion-pairing agent that can be effectively used in reversed-phase protein separations to define additional approaches when MS detection is used.
Samples and Reagents
Protein samples and formic acid were obtained from Sigma-Aldrich and used as received. Trifluoroacetic acid was from Pierce Chemicals and acetonitrile, isopropanol, dimethylformamide, and methanol were from EMD. Difluoroacetic acid was from Synquest Laboratories. Other organic solvents were analytical- or MS-grade from Sigma-Aldrich. Silanes used in the different synthesized stationary phases were from Gelest. Techniques for silane bonding are summarized in the literature (8–10). Monoclonal antibody sample SILu Mab was from Sigma-Aldrich.
Particles and Chromatographic Conditions
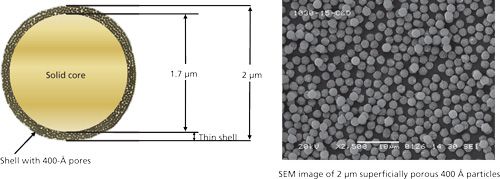
Fused-core SPP columns of 3.4-µm Halo Protein C4 (400-Å pores) used in some of the studies were obtained from Advanced Materials Technology, Inc. (AMT). Descriptions and applications of this material have previously been published (11,12). Columns of 1.7-µm TPPs (BEH-300) were obtained from Waters Associates. Columns of the wide-pore 2.0-µm SPPs (400-Å pores) were designed and synthesized at AMT. Figure 1 shows a graphic of this silica Fused-Core SPP with an overall diameter of 2.0 µm, a 1.7-µm diameter solid core, and a 0.15-µm thin porous shell with 400-Å pores. On the right of Figure 1 is a scanning electron micrograph of some of these 2.0-µm high-purity wide-pore silica particles.
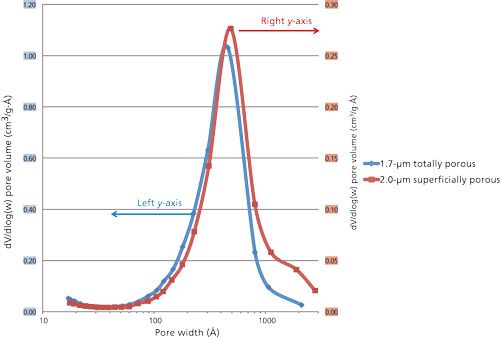
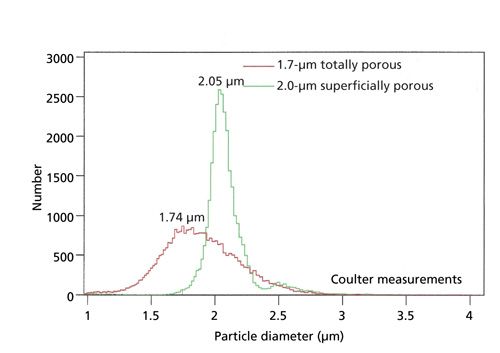
Surface areas and pore size distributions of particles were measured by nitrogen adsorption with a Micromeritics Tristar II instrument. Figure 2 is a comparison of pore size distribution measurements for the 2.0-µm SPPs and the 1.7-µm TPPs of this study. For such measurements, 1.5-2.0 g samples and 10-s nitrogen adsorption-equilibration steps were used. The nitrogen surface area is about 20 m2/g for the 2.0-µm SPP and about 90 m2/g for the TPP. While the pore-size distributions of Figure 2 are somewhat similar in both types of particles for smaller pores, a greater amount of larger pores for the SPPs is apparent. Differences in the larger pores for the SPPs are somewhat minimized in Figure 2 by compression with the log scale used for this measurement; the larger pores for the SPPs represent a significant physical difference in the two particles. Particle size and size distribution measurements were done with a Coulter Multisizer 3 instrument. Scanning electron micrographs were obtained from Micron, Inc. Figure 3 compares the particle size distributions for the two particles in this study. The particle size averages are nearly identical to those claimed for these particles, but the particle size distribution is much narrower for the SPP. There is a question about whether narrow particle size distributions are an advantage in the separation of large molecules. It may be argued that longer internal diffusion paths within larger particles of a distribution could lead to a loss in separation efficiency. However, as far as the authors know, there has not been experimental evidence that a narrow particle size distribution is beneficial in the separation of proteins. Verification is needed to settle this issue.
HPLC separations were performed on 2.1-mm i.d. columns using a Shimadzu Nexera HPLC system or a Nexera LCMS 2020 single-quadrupole mass spectrometer system. The Nexera HPLC system included LC-30AD solvent pumps and an SPD-M30A photodiode-array detector fitted with a 1-µL volume flow cell. The low dispersion characteristics of this system have previously been reported (4). Alternately, an Agilent model 1200 SL liquid chromatograph was used for some of the measurements. Data acquisition for the latter system was achieved using version B.01.03 ChemStation software. Peak widths (full width half maximum) and tailing factors (measured at 5% peak height) were used in data collection. Chromatographic separation optimizations were conducted using DryLab 2010 software from the Molnar Institute for Applied Chromatography.
Sample Preparation
A reduced form of the monoclonal antibody sample was prepared using the procedure previously described prepared with 0.1% aqueous trifluoroacetic acid (12). All samples were maintained at 4 °C until used for chromatography. Separations were conducted using samples dissolved in 0.1% trifluoroacetic acid unless otherwise noted.
Comparison of Particle Types
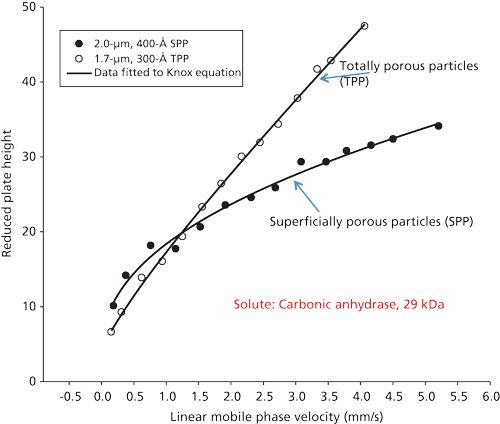
In this phase of the study, comparisons were made between the 2.0-µm wide-pore SPPs with a C4 stationary phase and commercial 1.7-µm wide-pore TPPs also with a C4 stationary phase, sometimes used for separating proteins. Figure 4 is a van Deemter-type plot of reduced plate height (plate height/particle size) versus linear mobile phase velocity for columns of these two particles using carbonic anhydrase (29 kDa) in isocratic conditions. At very low mobile-phase velocities, the column of smaller particles show slightly smaller reduced plate heights. At higher velocities (about 1.5 mm/s or 0.25 mL/min), essentially equivalent reduced plate heights were found. However, as mobile-phase velocity increases, the SPPs show much less increase in reduced plate height. The plot flattens off for the SPP column as a result of the better mass transfer arising from the thin outer porous shell of the SPPs; large protein molecules more effectively enter and exit the wide-pore porous structure after interaction with the stationary phase. For the SPP data in this plot, the values represent the average of two different van Deemter runs with an average of three measurements at each velocity. The data for the TPPs were obtained with only a single run of different velocities (average of three measurements), as the column showed much higher back pressure and reduced efficiency after the first set of measurements. It is speculated that, under the separating conditions used, carbonic anhydrase partially plugged the inlet frit. Purging the plugged column with 6 M urea-acetic acid restored the column to almost initial performance.
The SPP data in Figure 4 clearly show a useful opportunity for fast, efficient separations of proteins. For example, at a mobile phase velocity of about 3 mm/s (~0.5 mL/min flow rate) there is only about a 20% decrease in column efficiency compared to a velocity of about 1.5 mm/s (~0.25 mL/min flow rate). However, at the higher velocity, separation time would be halved; that is, for only a 20% decrease in efficiency (10% decrease in resolution), separation speed is doubled. Therefore, protein separations can be performed at higher velocities (for example, 0.5 mL/min flow rates) to take advantage of faster separations. This effect is typical for SPPs as a result of better mass transfer afforded by the thin porous outer shell, as compared to TPPs. While this mass transfer effect is minimal for small molecules, it is greatly magnified for larger molecules with poor diffusional properties. The use of SPPs for separating large molecules such as proteins is an obvious advantage.
Further comparison of the particle types is shown in Figure 5 for the separation of a mixture of proteins of various sizes with columns of C4 stationary phases. Using a flow rate of 0.5 mL/min, the 2.0-µm SPP column shows peak widths that are 35-70% narrower than that for the TPP column. Under these operating conditions, the peak capacity for the SPP column is 254, compared to 129 for the TPP column, as calculated by the equation shown at the top of Figure 5.
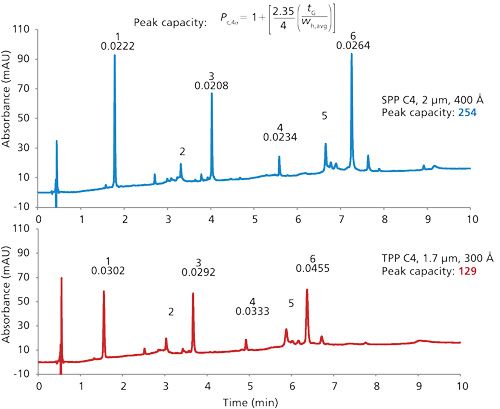
Another interesting feature of the separations in Figure 5 (and other separations in this article) is that the 2-µm wide-pore SPP C4 stationary phase shows greater retention than the comparative TPP stationary phase. This is the case even though the nitrogen surface area of the SPP is about one-fourth that of the TPP, based on the surface area of 92 m2/g reported on the TPP certificate of analysis. One might speculate that the effective C4 hydrophobic surface area of the SPP is greater, perhaps as a result of a higher density of C4 groups on the 2-µm SPP. Also, a difference in configuration of the pore structures and the higher density of the SPPs because of the solid cores might contribute to this effect. Another speculation is that large molecules do not fully penetrate into the entire porous structure of the TPPs and can only sample a fraction of the total surface area of these particles.
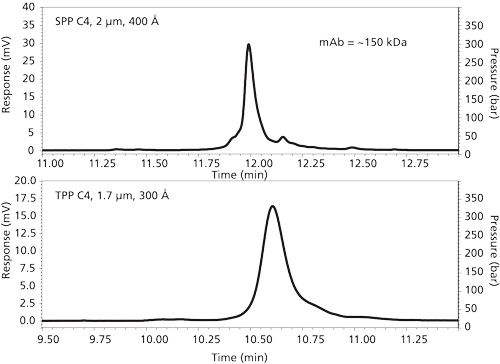
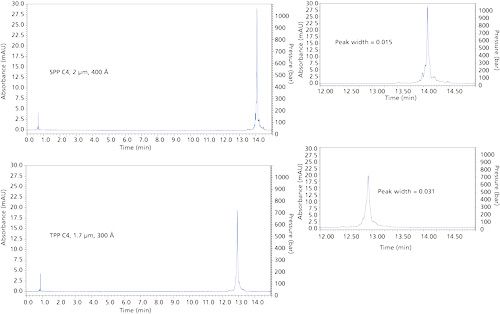
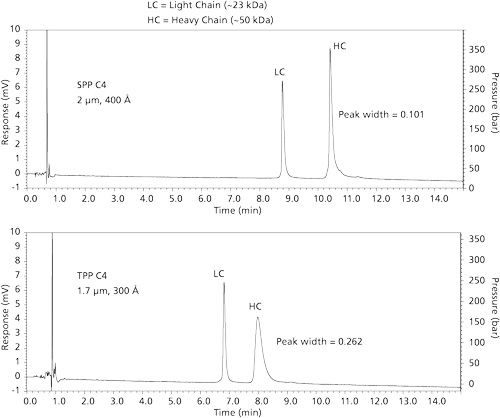
Comparison of the two particle types in the separation of an intact monoclonal antibody is shown in Figure 6. In this case, this ~150 kDa material was separated using an acetonitrile–difluoroacetic acid modifier gradient. (The use of this acid modifier is discussed later in this article.) The SPP column produces a narrower main peak and increased fine structure of minor components compared to that for the TPP column in approximately the same time frame. A further comparison of the particle types is shown in Figure 7. In this case, the mobile phase was a typical acetonitrile–trifluoroacetic acid system for the gradient. At the right of this figure is an enlargement of pertinent chromatogram sections to show the better separation of the SPP column. Figure 8 shows comparison separations of a reduced monoclonal antibody sample. The light chains of the reduced material are similar, but the peak for the heavy chain for the SPP column is narrower. One might speculate that wider pores of the SPPs influences this effect. However, different interactions of the heavy chain with the stationary phases with different pore geometries could influence protein conformation, potentially causing changes in the observed band width. Characterization of free thiol IgG1 variants resulting from reduction of the antibody has previously been shown to depend on the stationary phase used (13).
Effect of Mobile-Phase Selectivity
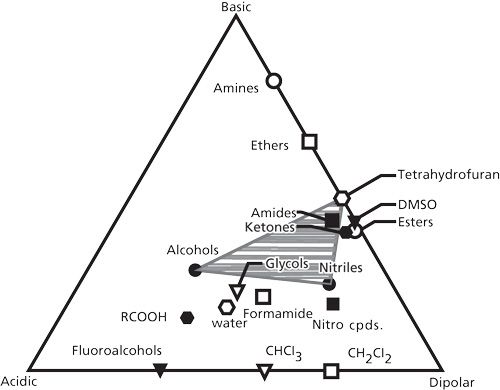
The effect of different stationary phases on the separation selectivity for small molecules is well known (14–16). Previous limited work has shown that changes in the organic modifier in the reversed-phase mobile phase could affect the selectivity of protein separations (5,6). The present study was concerned as to whether the same approach used for changing the selectivity of small-molecule separations could also be used to change protein separation selectivity. The well-known solvent selectivity triangle illustrated in Figure 9 has been successfully used to systematically change mobile phases for small molecules (16). This approach was used as a starting point for determining whether proteins would follow the same pattern. The technique for optimum band spacing changes with the solvent selectivity triangle is to choose solvents with the largest possible change in chemical characteristics. The interaction is based on the basic, dipolar, and acidic properties of the solvents with the triangle apices representing the region of most possible change. For example, if a mobile phase with largely dipolar properties produces peak overlap or poor resolution, a modifying solvent closer to the basic apex would have a better chance to complete the desired separation. The grayed out area in Figure 9 represents the range of selectivity for tetrahydrofuran, methanol, and acetonitrile commonly used in the reversed-phase separation of small molecules.
To test the solvent selectivity change for proteins, a series of organic modifying solvents was tested using a mixture of proteins with some of the results shown in Table I. In this case, a commercial 3.4-µm Halo Protein C4 SPP column was used as a comparison “standard” with an acetonitrile–trifluoroacetic acid gradient. Mobile-phase A was 0.1% trifluoroacetic acid in all experiments. In this particular study, the acetonitrile phase was diluted 50% with various organic solvents to determine the extent of selectivity change. Other studies (not shown here) used 25% organic modifier, and in some cases the organic modifier used was 100% (no acetonitrile). As might be expected, selectivity changes were found in keeping with the concentration of organic modifier used in the experiments. The unmodified acetonitrile phase was used for comparison, and the values on the left of Table I show the effective capacity factors k* for the solvents tested. As might be hoped, effective k* values show differences, with the values for apomyoglobin and catalase actually showing peak reversal with the methanol modifier. Gradients for this study were 25–52% organic in 10 min, except for dimethylformamide where the gradient was extended to 79% (segmented for the same percent organic/time) for more strongly held proteins.
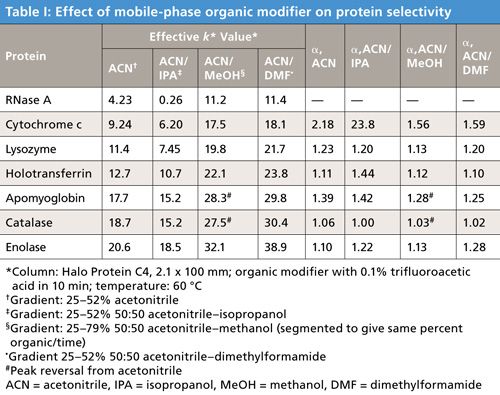
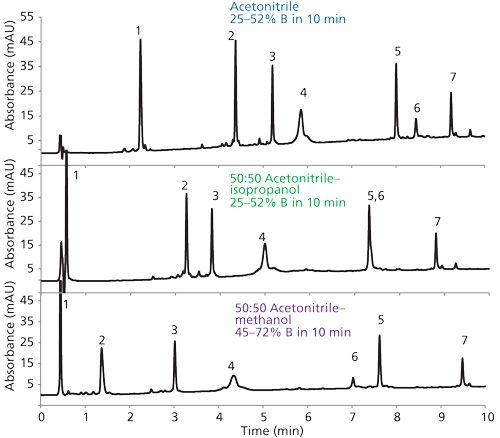
More important results are given on the right side of Table I, showing the alpha values (relative effective k* values) for subsequently eluted proteins in this mixture. For example, the first line of data compares alpha values for RNase A and cytochrome c, the second line for cytochrome c and lysozyme, and so on. Significant variations in alpha values resulted, and it can be expected that different band spacings can occur when solvents with different functionalities are used. This effect is further exemplified by the protein separations in Figure 10 using different organic modifiers. In this case, while selectivity changes are seen throughout, the isopropanol modifier actually caused an overlap for peaks 5 and 6, while methanol reversed the peak retentions.
Effect of Stationary-Phase Selectivity
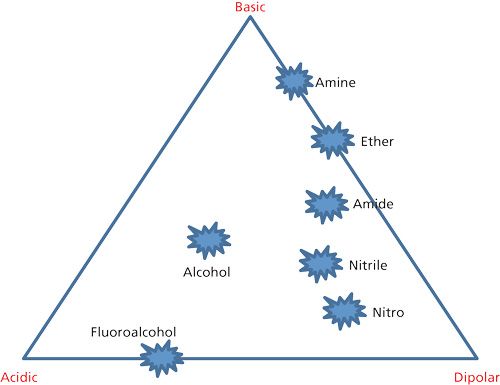
Previous limited studies have suggested that changes in the functionality of the stationary phase can have an effect on protein separation selectivity or band spacing (6,7). The present study was concerned with the question as to whether selectivity changes for proteins with different stationary phases would follow the same pattern as that for small molecules. Figure 11 shows a stationary-phase selectivity triangle, whereby stationary phases with different functional groups would be expected to have different interactions with solutes for selectivity changes, much like what is seen for different solvent selectivities as just described. This stationary-phase selectivity triangle is based on the same arrangement of functionality as the mobile-phase selectivity triangle approach discussed in the previous section (16). The technique for optimum band spacing changes is the same as for solvents, with the selection of stationary phases from different apices of the triangle expected to give the most change in selectivity. For example, if a fully hydrocarbon or a nitrile stationary phase does not provide the desired selectivity, then a shift to a phase containing an ether functionality would be a good choice to obtain a selectivity change.
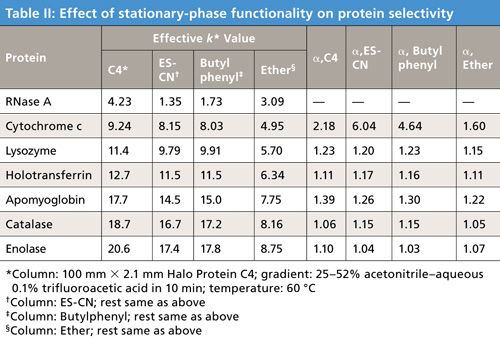
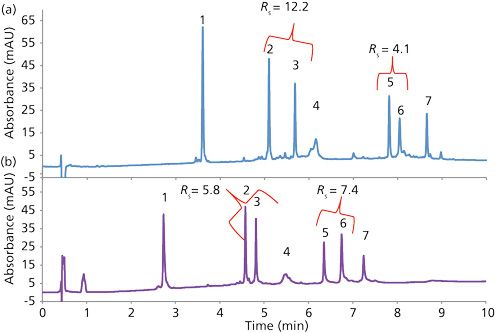
To test this premise, a protein mixture was separated with a series of stationary phases synthesized with different functionalities. The results on the left side of Table II give the effective capacity factor k* values for some of the stationary phases tested, compared to a commercial Halo Protein C4 phase. For this test, an acetonitrile–aqueous trifluoroacetic acid gradient of 25–52% organic was used at 60 C. Again, as might be hoped, effective k* values vary with the different phases. Protein retention for this ether phase was less than the others tested, probably as a result of the highly polar nature of this phase. More importantly, the data at the right side of Table II show the alpha values for the sequentially eluted proteins. Significant differences in alpha values from that of the C4 phase gives promise of protein selectivity changes when different phases are used. Figure 12 shows comparative gradient elution patterns for C4 and amide phases for a protein mixture. Significant resolution changes are seen for these particular different phases, suggesting utility in changing columns with different functionality when selectivity variations are needed.
Acid Modifier Effects
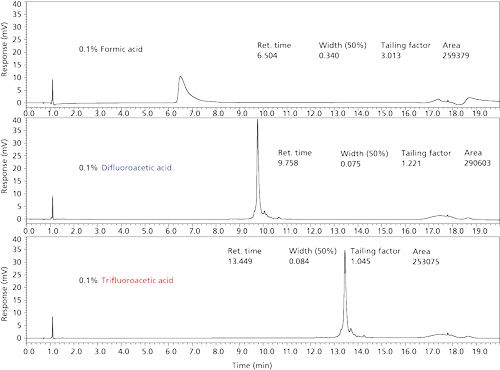
Proteins often are separated using an acetonitrile–aqueous trifluoroacetic acid mobile-phase gradient. This approach using trifluoroacetic acid as the ion-pairing agent in reversed-phase separations typically produces sharp, well-shaped protein bands. This effect is illustrated by the chromatograms in Figures 5 and 10 and by the bottom of Figure 13 for an intact monoclonal antibody separation. Unfortunately, trifluoroacetic acid is not favored when using MS detection because protein ionization efficiency is poor. Trifluoroacetic acid also leads to deleterious backgrounds that are difficult to remove from the MS instrument for other studies. As a result, formic acid is often used by investigators when conducting protein separations with MS detection. Unfortunately, separations with a formic acid modifier often result in poor peak shape and inefficient separations, as suggested by the top chromatogram in Figure 13. The reason for this is that formic acid modifier results in a higher pH (about pH 2.7) than trifluoroacetic acid, and is a much poorer ion-pairing agent (17).
An attractive alternative acidic modifier for protein separations is difluoroacetic acid. This acid provides the desired low pH and is a strong ion-pairing agent. The middle chromatogram of Figure 13 obtained with difluoroacetic acid modifier shows that the results are quite similar to that for trifluoroacetic acid. Ionization efficiency of proteins with difluoroacetic acid is much greater than for trifluoroacetic acid, and difluoroacetic acid does not create other disadvantages in MS utility. The use of fluoroacids as acid modifiers has previously been reported (18), and a manuscript describing the use of these materials for separating proteins has been submitted (19).
Conclusions
This article provides a brief overview of studies that are underway to provide new tools for improved separation of proteins. The 2.0-µm superficially porous high-purity silica particles provide fast, high-resolution reversed-phase separations of proteins. The wide 400-Å pores of these particles allow for high-efficiency separations of large proteins such as monoclonal antibodies, which limits deleterious restricted diffusion that reduces resolution. Varying the type of organic mobile phase in gradient elution separations provides a useful and convenient way to change the selectivity of protein elution. The solvent selectivity triangle approach is a useful technique for predicting which solvent might result in desired changes in selectivity for protein peaks. Stationary phases with different functionalities also provide an effective way to obtain selectivity changes in protein separations. The stationary-phase selectivity triangle approach is useful for indicating which different stationary phase might provide a needed selectivity change. Difluoroacetic acid is an effective acidic modifier and ion-pairing agent for the reversed-phase separation of proteins. This agent permits efficient separations comparable to that for those obtained with trifluoroacetic acid for mass spectrometry without the disadvantages of poor ionization efficiency and practical limitations. Difluoroacetic acid provides much improved peak shapes and separation efficiency compared to formic acid-modified mobile phases.
Acknowledgments
We thank Robert Moran and Benjamin Libert for their assistance in producing data for this article. Partial support for this project was provided by NIH Grant GM093747. This material was presented by J.J.K. at Lecture 590-1 in the "LCGC Lifetime Achievement and Emerging Leader in Chromatography Award" session at the Pittsburgh Conference, New Orleans, Louisiana, on March 9, 2015.
References
- J. Chenau, F. Fenaille, V. Caro, M. Haustant, L. Diancourt, S.R. Klee, C. Junot, E. Ezan, P.L. Goossens, and F. Becher, Mol. Cell. Proteomics13, 716–732 (2014).
- G.A. Sinise, Ed, Tumor Markers Research Perspective (Nova Science Publishers, Inc., New York, 2007).
- http://www.gelifesciences.com/gehcls_images/GELS/Related%20 Content/Files/1433751924701/litdoc29155460_20150608102513.pdf, GE Healthcare Life Sciences, Applications and Techniques; Chromatography, 2015.
- J.J. DeStefano, B.E. Boyes, S.A. Schuster, W.L. Miles, and J.J. Kirkland, J. Chromatogr. A1368, 163–172 (2014).
- M.-I. Aguilar, HPLC of Peptides and Proteins: Methods and Protocols (Humana Press Inc., Totowa, New Jersey, 2004).
- L.R. Snyder, J.J. Kirkland, and J.W. Dolan, Introduction to Modern Liquid Chromatography, 3rd edition (John Wiley & Sons, Hoboken, New Jersey, 2010), chapter 13.
- B.E. Boyes and D.G. Walker, J. Chromatogr. A691, 337–347 (1995).
- K.K. Unger and J. Schick-Kalb, U. S. Patent 4,017,528, April 12, 1977.
- J.J. Kirkland, J. Chromatogr. A 1060, 9–21 (2004).
- L.R. Snyder, J.J. Kirkland, and J.W. Dolan, Introduction to Modern Liquid Chromatography, 3rd edition (John Wiley & Sons, Hoboken, New Jersey, 2010), chapter 5.
- J.J. Kirkland, S.A. Schuster, W.L. Johnson, and B.E. Boyes, J. Pharm. Anal.3, 303–312 (2013).
- S.A. Schuster, B.M. Wagner, B.E. Boyes, and J.J. Kirkland, J. Chromatogr. A 1315, 118–126 (2013).
- H. Liu, J. Jeong, Y.-H. Kao, and Y.T. Zhang, J. Pharm. Biomed. Anal.109, 142–149 (2015).
- J.L. Glajch, J.J. Kirkland, K.M. Squire, and J.M. Minor, J. Chromatogr.199, 57–79 (1980).
- J.J. Kirkland and J.L. Glajch, J. Chromatogr.255, 27–39 (1983).
- L.R. Snyder, J.J. Kirkland, and J.W. Dolan, Introduction to Modern Liquid Chromatography, 3rd edition (John Wiley & Sons, Hoboken, New Jersey, 2010), chapter 6.
- D.V. McCalley, J. Chromatogr. A1218, 2887–2897 (2011).
- E. Yamamoto, Y. Ishihama, and N. Asakawa, Talanta127, 219–224 (2014).
- B.E. Boyes, B.P. Libert, S.A. Schuster, and J.J. Kirkland, J. Chromatogr. A, submitted May 2015.
B.M. Wagner, S.A. Schuster, B.E. Boyes, W.L. Miles, D.R. Nehring, and J.J. Kirkland are with Advanced Materials Technology, Inc., in Wilmington, Delaware. Direct correspondence to: kirkland.joseph5@gmail.com

Characterizing Polyamides Using Reversed-Phase Liquid Chromatography
May 5th 2025Polyamides can be difficult to characterize, despite their use in various aspects of everyday life. Vrije Universiteit Amsterdam researchers hoped to address this using a reversed-phase liquid chromatography (RPLC)-based approach.
New Method Explored for the Detection of CECs in Crops Irrigated with Contaminated Water
April 30th 2025This new study presents a validated QuEChERS–LC-MS/MS method for detecting eight persistent, mobile, and toxic substances in escarole, tomatoes, and tomato leaves irrigated with contaminated water.
University of Tasmania Researchers Explore Haloacetic Acid Determiniation in Water with capLC–MS
April 29th 2025Haloacetic acid detection has become important when analyzing drinking and swimming pool water. University of Tasmania researchers have begun applying capillary liquid chromatography as a means of detecting these substances.
Prioritizing Non-Target Screening in LC–HRMS Environmental Sample Analysis
April 28th 2025When analyzing samples using liquid chromatography–high-resolution mass spectrometry, there are various ways the processes can be improved. Researchers created new methods for prioritizing these strategies.

.png&w=3840&q=75)

.png&w=3840&q=75)


.png&w=3840&q=75)


.png&w=3840&q=75)


