How Little Can I See?
LCGC North America
John Dolan considers some techniques to improve detection limits, no matter what the application is.
For workers who use liquid chromatography (LC) to monitor pharmaceutical content uniformity, dissolution, or potency, precision and accuracy generally are more important than detection limits. However, for anyone involved in trace analysis, whether it is pharmaceutical, environmental, or chemical applications, the lower limit of detection (LLOD) can be a critically important parameter in an LC method. This month's "LC Troubleshooting" installment considers some techniques to improve detection limits, no matter what the application is.

John W. Dolan
Pick the Right Detector
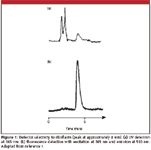
The variable-wavelength and diode-array UV detectors are the most popular detectors in use today. As a result, method development often is initiated with a UV detector at the end of the LC system. However, as we all should know, the UV detector is not necessarily the best detector to use for a given sample. For example, Figure 1 shows that the response of a fluorescence detector to riboflavin at approximately 4 min is greater than a UV detector under similar conditions. On the other hand, the fluorescence detector has no response at all for the first two peaks seen in the UV chromatogram. In this case, this lack of response adds desired selectivity to the method, but if those two peaks were of interest, the fluorescence detector would be a poor choice, even though it has better response to riboflavin.

Figure 1
One must be careful when selecting a detector to avoid getting caught up in a wave of detector popularity. An example of this that I encountered was a method to analyze a porphyrin-containing drug compound in plasma. As you might know, the triple-quadrupole, or tandem, mass spectrometer is the standard detector used today to measure drugs in biological matrices. As such, it is the "go-to" detector for most such methods. In this case, the client asked that the method be developed using LC–mass spectrometry-mass spectrometry (MS-MS). Fluorescence detection provided both more sensitivity and more selectivity than MS-MS, but the client insisted on LC–MS-MS because the method would be readily accepted by the regulatory agencies. The resulting method was less sensitive and required extensive cleanup. Furthermore, the calibration curve was nonlinear and precision and accuracy suffered. Fluorescence produced a large and linear calibration range and used a simple protein precipitation cleanup, all of which resulted in higher quality data for this compound.
There are several LC detection methods that might be a better choice than UV, such as MS-MS, electrochemical (amperometric), and fluorescence — if the analyte has the right chemical characteristics. Detector selection for a method should be made on a case-by-case basis.
How Low Can I Go?
The LLOD is defined variously by a minimum signal-to-noise ratio (S/N) or precision of multiple measurements of the same sample. For example, many workers use S/N = 3 for the LLOD or 30% relative standard deviation (RSD) of peak height or area. For the present discussion, it does not matter how the LLOD is defined, because the techniques to reduce the LLOD are the same no matter how you measure it.
When trying to push the LLOD to lower levels, I use the following relationship (2):

where MW is the sample molecular weight, Vm is the column volume, k is the retention factor ([retention time – column dead time]/[column dead time]), CV is the desired precision, N is the column plate number, Lfc is the length of the detector flow cell, and ε is the extinction coefficient. Equation 1, clearly, is intended for use with UV detection, but it can be used to improve the detection limits for any detector. Let's look at the various components of this relationship, in which the LLOD is a function of several parameters that we might or might not be able to control.
Molecular weight: LLOD will be inversely proportional to the molecular weight of the analyte. The primary reason for this is that larger molecular weight compounds have larger diffusion coefficients, so they will generate broader bands in the LC column. Broader bands mean shorter peaks (peak area is assumed to be constant), and LLOD ultimately is a function of peak height, even if peak area is used for quantification. We have no control over the molecular weight of the sample, but we should not be surprised if larger compounds have poorer LLODs than smaller ones.
Column volume: Reduction of the column length or column internal diameter will improve the LLOD. This is because the peak volume is related to the column volume — smaller volume columns will generate smaller volume peaks. The peak volume is determined by its width at baseline, so smaller volume peaks will be narrower and, thus, taller for the same peak area. Because the column plate number is a factor in LLOD, one simple strategy to improve LLOD is to use a narrower column of the same length, so as to keep N the same. The cross-sectional area is proportional to the diameter squared, so reduction from a 4.6-mm i.d. column to one with a 2.1-mm internal diameter means a change in area (and volume) of (4.6/2.1)2 ≈ 5. So a fivefold reduction in peak width and, thus, a fivefold increase in peak height will be observed, at least in theory. In practice, it is rare to obtain all of the theoretical gain by any of the changes discussed here. This assumes that the column will not be overloaded by any of the sample components, or a reduction of injected mass can be required to avoid overload.
The gain in LLOD due to a reduction in column length is not so clear cut, because the gain made by reduction in length is offset by the reduction in N by the same factor. That is, a twofold reduction in length is offset by a twofold reduction in N, but LLOD drops only by the square root of N: 2/20.5 = 1.4-fold overall gain in LLOD.
Retention (1 + k): Generally, to get the best chromatographic performance for an isocratic method, it is desirable to have 1 < k < 20, and the United States Pharmacopoeia (USP) suggests k > 2 for the first peak for robust methods. Smaller values of k not only mean an increased sensitivity of the method to changes in resolution with small changes in k, but also the likelihood of interferences with peaks at the column dead volume. However, in spite of these potential problems, reduction in the retention time will help reduce LLOD. Smaller retention times mean narrower and, thus, taller and more easily detected peaks.
Signal-to-noise ratio: It should be obvious that anything done to increase S/N will improve the LLOD. The factors affecting the signal are covered adequately in the other sections of this discussion. Reduction of noise as an approach to improve LLOD is often overlooked. Larger detector time constants, electronic filtering, and peak smoothing by the data system can all help to reduce the noise. Although each of these parameters might seem to be doing the same job, it is worth checking each parameter separately, and perhaps in combination. From a practical standpoint, they can reduce the noise using different and complementary techniques. Sometimes a better electrical supply circuit with fewer noise spikes or power surges can help to reduce detector noise.
Whereas electronic noise is fairly simple to control, chemical noise can be more of a challenge. As strongly retained materials begin to build up on the column, the baseline noise can increase. Regular column flushing (or use of gradient elution) generally is beneficial. More extensive (and usually more expensive) sample cleanup usually will reduce chemical noise.
Environmental factors also can play a role in noise. Temperature control is the most obvious. Always operate the column in a column oven — this will reduce baseline wander and retention variability. Insulate the tubing connecting the column and detector (a piece of flexible plastic or vacuum tubing works well). Isolate the LC system from direct drafts from the heating, ventilation, and air conditioning (HVAC) system — this might take some creative construction around the HVAC vents with duct tape and cardboard.
Acceptable precision: The coefficient of variation (same as %-RSD) that is required for a method might differ significantly from one application to another. For example, drug assay methods typically require 1–2% RSD, whereas 15–20% RSD will be acceptable for determination of the same drug in plasma. Sometimes the required CV is dictated by regulations, but in other cases, you can have some flexibility with this parameter.
Length of detector flow cell: Generally, we do not have an option of increasing the flow cell length. The most common length is 10 mm, with shorter cells used for preparative applications. The common 10 mm × 1 mm i.d. flow cell has a volume of approximately 8 μL. This is too large for some applications, such as sub-2-μm particles in short, narrow columns, because of excessive band broadening in the detector cell. Shortening the cell is one option to reduce the volume, but a better choice is to use a narrower diameter cell. For example, at least one manufacturer has designed a 0.5-mm i.d. cell, which reduces the volume by a factor of four, but keeps the path length the same. By use of total-internal-reflectance techniques, it is possible to have adequate optical characteristics for such cells.
Extinction coefficient: When UV detectors are used, we generally operate at the wavelength with the maximum UV absorbance to maximize the detector response. In many cases, however, operation at wavelengths below 210 nm can enhance detector sensitivity and, thus, reduce LLOD. Usually this is accompanied by a reduction in detector selectivity, so adjustments to the chromatographic conditions or sample cleanup might be necessary to avoid interferences that were not a problem at a higher wavelength. Sometimes it is possible to increase the extinction coefficient by derivatizing the analyte.
The extinction coefficient is the inherent responsiveness of a compound to the UV detector; we can get the same effect as increasing ε by changing to a detector that has a better inherent response, as discussed with the example for the fluorescence detector.
Summary
I find that equation 1 helps me keep a focus on the important parameters that will help to improve the detection limit for any method. There are more extensive versions of equation 1 (for example equation 3.4 of reference 2) that allow one to calculate a minimum detectable mass. In practical terms, however, equation 1 gives us the variables upon which we should focus when trying to reduce the detection limits. Several of these are fairly easy to implement. Exchanging a 4.6-mm i.d. column for a 2.1-mm i.d. column is perhaps the simplest change. This change in Vm should be accompanied with a corresponding change in flow rate to maintain the same mobile phase linear velocity. The change from 5- to 3-μm diameter particles for the column packing to increase N is another simple change. If this change in particle size is accompanied by a change in column length from a 150 mm, 5-μm particle column to a 100 mm, 3-μm column, the change in N should be small, but the reduction of Vm is proportional to the change in length. An increase in the detector time constant or similar changes in data-system parameters can provide a useful reduction in noise for an improvement in S/N. Thermostating the column and regularly flushing the column also will help to reduce noise. The nice thing about changing any of these parameters (Vm, L, or N), either alone or in combination is that they should have no effect on the chromatographic selectivity – no change in the mobile phase or column chemistry is involved. For many methods, such changes fall under the "adjustment" classification, not the "modification" one, so revalidation of the method is not required. Just make the adjustments and verify that system suitability is still satisfactory.
John W. Dolan "LC Troubleshooting" Editor John W. Dolan is Vice-President of LC Resources, Walnut Creek, California; and a member of LCGC's editorial advisory board. Direct correspondence about this column to "LC Troubleshooting," LCGC, Woodbridge Corporate Plaza, 485 Route 1 South, Building F, First Floor, Iselin, NJ 08830, e-mail John.Dolan@LCResources.com
For an ongoing discussion of LC troubleshooting with John Dolan and other chromatographers, visit the Chromatography Forum discussion group at http://www.chromforum.com.
References
(1) L.R. Snyder and J.J. Kirkland, Introduction to Modern Liquid Chromatography, 2nd ed. (Wiley, New York, 1979), Figure 4.14.
(2) L.R. Snyder, J.J. Kirkland, and J.L. Glajch, Practical HPLC Method Development, 2nd ed. (Wiley, New York, 1997), adapted from equation 3.4.

New Study Reviews Chromatography Methods for Flavonoid Analysis
April 21st 2025Flavonoids are widely used metabolites that carry out various functions in different industries, such as food and cosmetics. Detecting, separating, and quantifying them in fruit species can be a complicated process.


