How Clean Are Your Vials and Closures?
Methods: Vials and closures were exposed to acetonitrile for 2 h and subsequently analysed by LC-UV, LC–MS, and GC–MS to characterize the interferences.
L. Pereira, T. Edge, L. Shick, and M. Slade, National Scientific, Part of Thermo Fisher Scientific
Purpose: The evaluation of a new vial and closure for reducing interferences.
Methods: Vials and closures were exposed to acetonitrile for 2 h and subsequently analysed by LC-UV, LC–MS, and GC–MS to characterize the interferences. Comparisons were made between precleaned MS certified vials and closures, a control, and a competitor vial and closure set.
Improvements in chromatographic techniques, instrumentation, and sample handling continue to push the limits of detection in trace analysis. As such, the cleanliness of the total workflow process becomes even more important to reduce the potential for interferences and contamination that can ultimately reduce the sensitivity of the assay. The selection of the correct autosampler vial and closure is thus an important consideration.
Vials that are not effectively cleaned can introduce particulate matter that can cause blockages and accumulation of foreign material at the head of the separation column affecting chromatographic performance. Additionally, residual organic compounds that might survive the glass forming process or that leach from the closure when exposed to the sample solvent can reduce the analysis sensitivity.
The work presented in this poster evaluates the performance of the new MS certified vial and an ultra high pure bonded PTFE/ silicone closure compared with a control and a competitor vial and closure set.


Sample Preparation
- Vials were filled with 1.0 mL of acetonitrile (LC–MS grade).
- The filled vials were capped and the vial + closure incubated at room temperature in the upright position and in the inverted position (in duplicate) for 2 h.
System Suitability Tests (SST)
- LC–MS — 5 repeated injections of reserpine solution at 10 ng/µL in water.
- GC–MS — 5 repeated injections of phenanthrene at 1 ng/µL in acetonitrile. SSTs were injected before each set of injections for each vial + closure type.
Control
The control (or blank) was generated by rinsing a vial (with no cap) twice with injection solvent (acetonitrile). 1 mL of acetonitrile was measured into the vial and vial with no closure was placed in the autosampler tray for analysis.
Figure 1 illustrates the UV traces for a control, a vial with PTFE/silicone closure and a vial + closure with pre-slit, incubated in the inverted position at room temperature. The three traces are identical, demonstrating that in LC-UV it is not feasible to see the interferences using this detector technology.

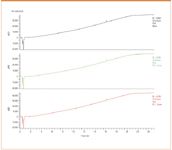
Figure 1: LC-UV chromatograms of a blank, a vial with PTFE/silicone closure, and a vial with pre-slit closure, incubated at room temperature in the inverted position.
Figure 2 shows the LC–MS analysis of a control, a competitor vial + closure, and an MS certified vial + closure. The LC–MS chromatograms for the control and the MS certified are very similar, suggesting that there is minimal interference from the vial + closure. However, the total ion chromatogram (TIC) obtained for the competitor vial shows a substantial amount of contamination. Combining the MS spectra of the latter part of the chromatogram reveals that the majority of the peaks in the positive ESI spectra are 74 units apart, suggesting the presence of polydimethylsiloxane (C2H6OSi)n.

Figure 2: LCâMS +ve ESI chromatograms obtained for different sample types. The MS spectra are obtained by summing the spectra over the last portion of the chromatogram.
Figures 3 show the results of the GC–MS analysis of the MS certified vials compared to the control. Both sets of chromatograms and spectra clearly demonstrate that there is minimal difference between the MS certified vials and the control.

Figure 3: GCâMS data for the MS certified vials. Comparison to control TIC and spectrum across the full time span, demonstrate that there is minimal difference between the two.
Conclusions
- UV detection is generally not sensitive enough to detect trace amounts of nonvolatile organic contaminants present in autosampler vials.
- Some commercially available autosampler vials can leach organic compounds into the sample, particularly if the sample solvent comes into contact with the closure.
- The National Scientific mass spec certified vials showed no evidence of sample contamination in LC–MS with ESI or GC–MS with EI ionization, even when the sample solvent came into contact with the closure.


National Scientific, Part of Thermo Fisher Scientific
3970 Johns Creek Court, Suite 500, Suwanee, GA 30040
tel. (800) 332-3331; Email: chromatography@thermofisher.com
Website: www.nationalscientific.com


Free Poster: NDSRI Risk Assessment and Trace-Level Analysis of N-Nitrosamines
April 25th 2025With increasing concern over genotoxic nitrosamine contaminants, regulatory bodies like the FDA and EMA have introduced strict guidelines following several high-profile drug recalls. This poster showcases a case study where LGC and Waters developed a UPLC/MS/MS method for quantifying trace levels of N-nitroso-sertraline in sertraline using Waters mass spectrometry and LGC reference standards.
New TRC Facility Accelerates Innovation and Delivery
April 25th 2025We’ve expanded our capabilities with a state-of-the-art, 200,000 sq ft TRC facility in Toronto, completed in 2024 and staffed by over 100 PhD- and MSc-level scientists. This investment enables the development of more innovative compounds, a broader catalogue and custom offering, and streamlined operations for faster delivery. • Our extensive range of over 100,000 high-quality research chemicals—including APIs, metabolites, and impurities in both native and stable isotope-labelled forms—provides essential tools for uncovering molecular disease mechanisms and exploring new opportunities for therapeutic intervention.
New Guide: Characterising Impurity Standards – What Defines “Good Enough?”
April 25th 2025Impurity reference standards (IRSs) are essential for accurately identifying and quantifying impurities in pharmaceutical development and manufacturing. Yet, with limited regulatory guidance on how much characterisation is truly required for different applications, selecting the right standard can be challenging. To help, LGC has developed a new interactive multimedia guide, packed with expert insights to support your decision-making and give you greater confidence when choosing the right IRS for your specific needs.
Using the Carcinogenic Potency Categorisation Approach (CPCA) to Classify N-nitrosamine Impurities
April 25th 2025Learn how to manage nitrosamine impurities in pharmaceuticals with our free infographic. Discover how the CPCA approach establishes acceptable intake limits and guides the selection of NDSRI reference samples. Stay compliant and ensure safety with our ISO-accredited standards.

