How Chemistry Determines Separations: The Influence of Selectivity on Resolution
Resolution in chromatography is influenced by retention, engineering, and selectivity. Retention relates to how long analytes are in the column; generally, longer retention leads to increased resolution. Engineering relates to the design and operation of the chromatographic system, as expressed by the number of theoretical plates. Generally, more theoretical plates lead to greater resolution. Finally, selectivity is generated by the chemistry of the intermolecular interactions between the stationary phase and the analytes. Larger differences in the strength of these interactions lead to greater selectivity. In this instalment, we will examine the relationship between selectivity and resolution.
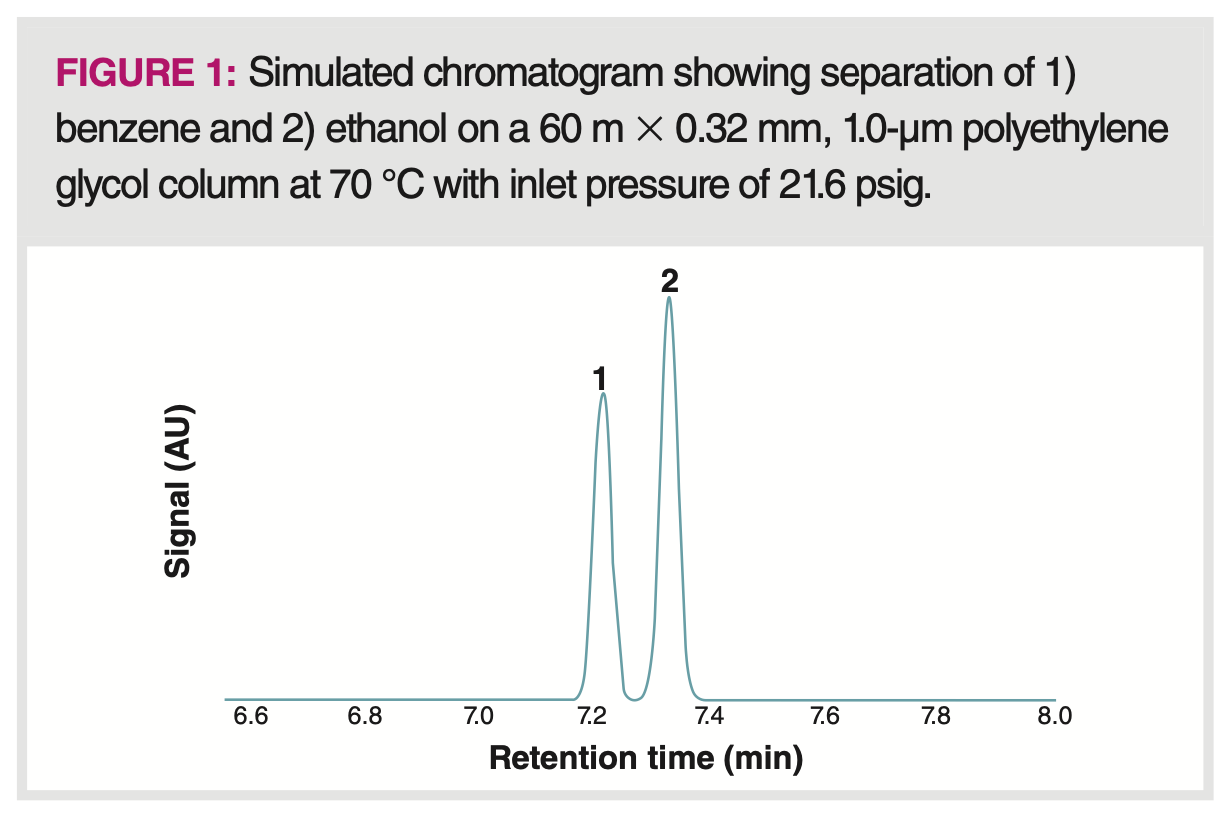
Optimum resolution is one goal of any chromatographic separation. Figure 1 shows a simulated chromatogram, using the ProEZGC chromatogram modeler, of two peaks being eluted in a typical gas chromatographic (GC) separation (1). Resolution may be considered a measure of the amount of separation between the two peaks, and it is classically calculated from the chromatogram using equation 1. In short, equation 1 defines resolution as the difference in retention times divided by the average of the peak widths. A resolution calculated as 1.5 or greater indicates baseline separation. The resolution of the two peaks seen in Figure 1 is 1.7, indicating slightly better than baseline resolution, which is seen on the chromatogram.

Resolution can also be thought of resulting from fundamental parameters of the chromatographic system and the separation. These parameters are retention, engineering, and selectivity. For retention, it is intuitive that the longer an analyte pair are on the column, the more time they have to separate, and the better the resolution. For engineering, it makes sense that the dimensions and construction of the instrument and column impact transport efficiency for the analytes and therefore resolution. For selectivity, the difference in intermolecular interaction chemistry between the two analytes and the stationary phase impacts the separation power of the stationary phase and therefore the resolution.
These three ideas are captured in the master resolution equation, seen in equation 2 (2).

The three ideas—retention, engineering, and selectivity—are seen in this equation. Before diving more deeply into the impact of selectivity, we should briefly discuss the other two terms, retention and engineering. Retention is seen in the first term, k/(1+k). This term will vary between 0 and 1, depending on the size of the retention factor. Looking at the extremes, at very large retention factor, k > 10–20, the term approaches 1 and diminishing return is seen from longer retention time. Likewise at low k, k < 1 or 2, a small variation in k may have a large impact on resolution. This is why many authors suggest as a first step in method development, to adjust the temperature to give k between about 1 and 20. This also provides a limit for run times: if the gas hold-up time is 1 min, this suggests that the total run time should be less than about 20 min; additional run time simply adds time with little impact on resolution.
Engineering is seen in the square root of theoretical plates (N) divided by 4. From our recent discussion of the Golay equation, we see that the number of theoretical plates derives from numerous factors related to the construction of the chromatographic system and the conditions of the separation (3). In contrast with the retention term, longer retention times usually lead to increased N through a complex relationship with the retention factor. N is more dramatically impacted by column dimensions, carrier gas flow rate, and carrier gas choice, with smaller inside diameter, thinner stationary phase film, and lower molecular weight carrier gas generally favoured. In typical capillary gas chromatographic systems, N may vary from about 10,000–100,000, with the term in equation 2 therefore varying from 25–80. Interestingly, while the number of theoretical plates is roughly proportional to column length, here too, there is a diminishing return with longer columns; resolution will only increase by a factor of 1.4 if the column length is doubled, as N is doubled. However, the retention time will also be about doubled.
Influence of Selectivity on Resolution
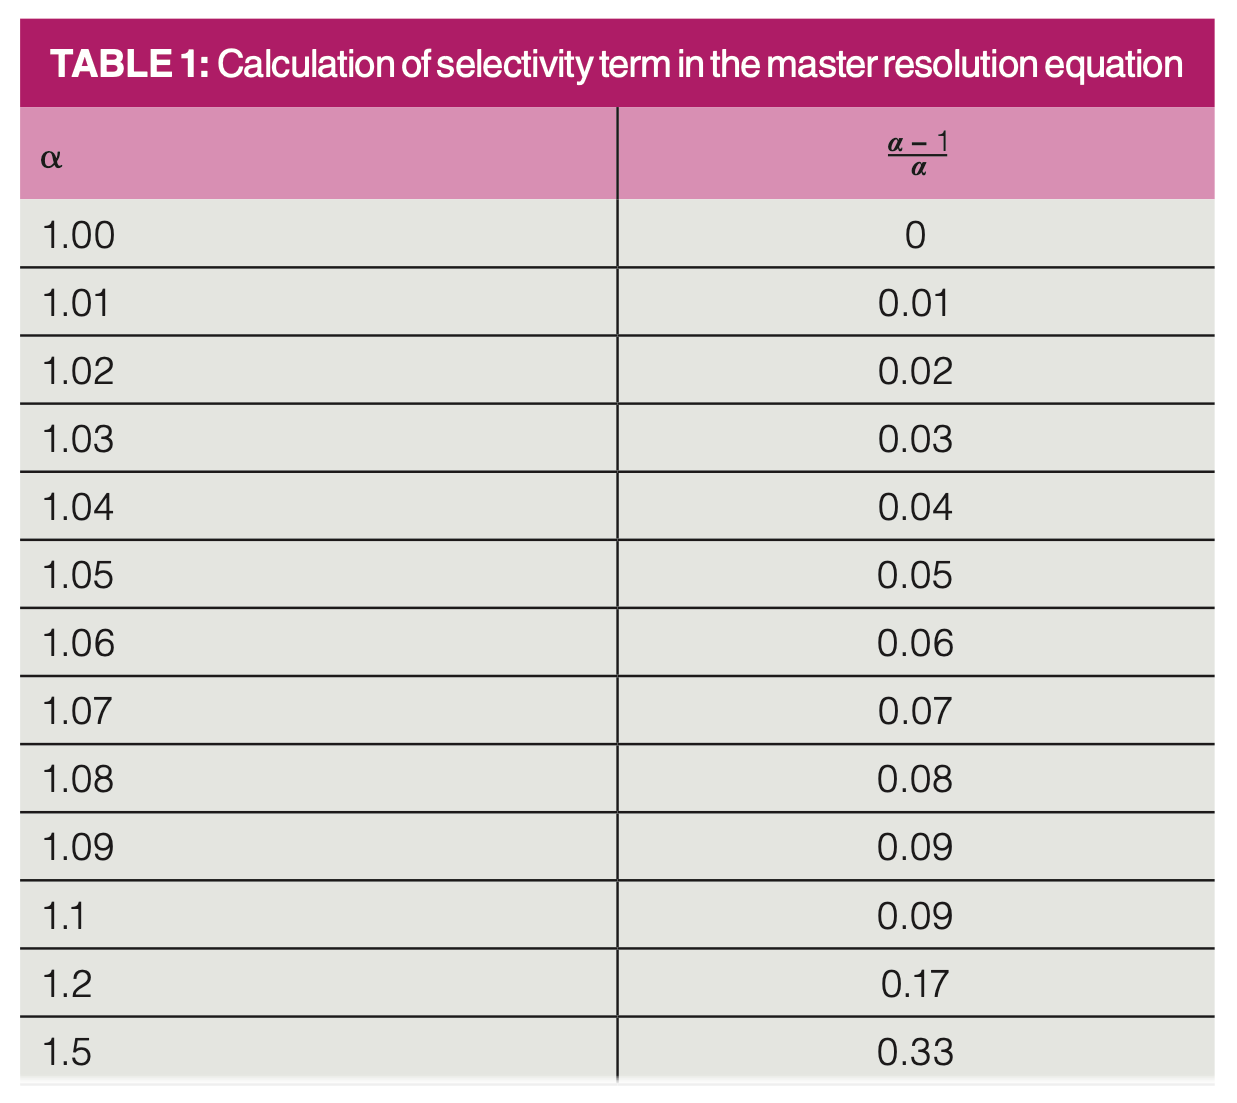
The remaining term in equation 2 relates selectivity and resolution. Not surprisingly, the higher the value for selectivity, the higher the resolution. Since selectivity is calculated as the ratio of adjusted retention times for two adjacent peaks, with the numerator having the larger time, the minimum value is 1. In capillary gas chromatography, selectivity for adjacent, fully resolved peaks can often be as low as 1.02. Before diving into the effect of selectivity on resolution, it is worth taking a quick look at the selectivity term in equation 2. Table 1 shows calculations of the selectivity term, (α-1/α), versus α. Table 1 shows a roughly linear increase in the selectivity term as the selectivity increases at low selectivity, but curvature and a diminishing return as selectivity increases beyond 1.1. In most situations in capillary gas chromatography, selectivity of adjacent and nearly overlapping peaks will be less than 1.1, which indicates a roughly 10% difference in the two adjusted retention times, or a 1 min difference in adjusted retention time in an overall 10 min separation.
We can now use equation 2 and Table 1 to gain some insight into how selectivity relates to retention (k) and engineering or number of theoretical plates (N) to generate resolution. Table 2 shows calculations of the selectivity required to achieve a resolution of 1.5 with constant k = 5 and varying N. This shows the effects of column dimensions and instrument conditions on resolution. Equation 2 was simply rearranged to calculate the selectivity term and then the approximate selectivity was read from Table 1. This is a good point to caution against using equation 2 for rigorous calculations; it is best used for conceptual discussion and thinking about resolution. There are too many underlying variables in the terms used in equation 2 to make it easily useful for rigorous calculations.
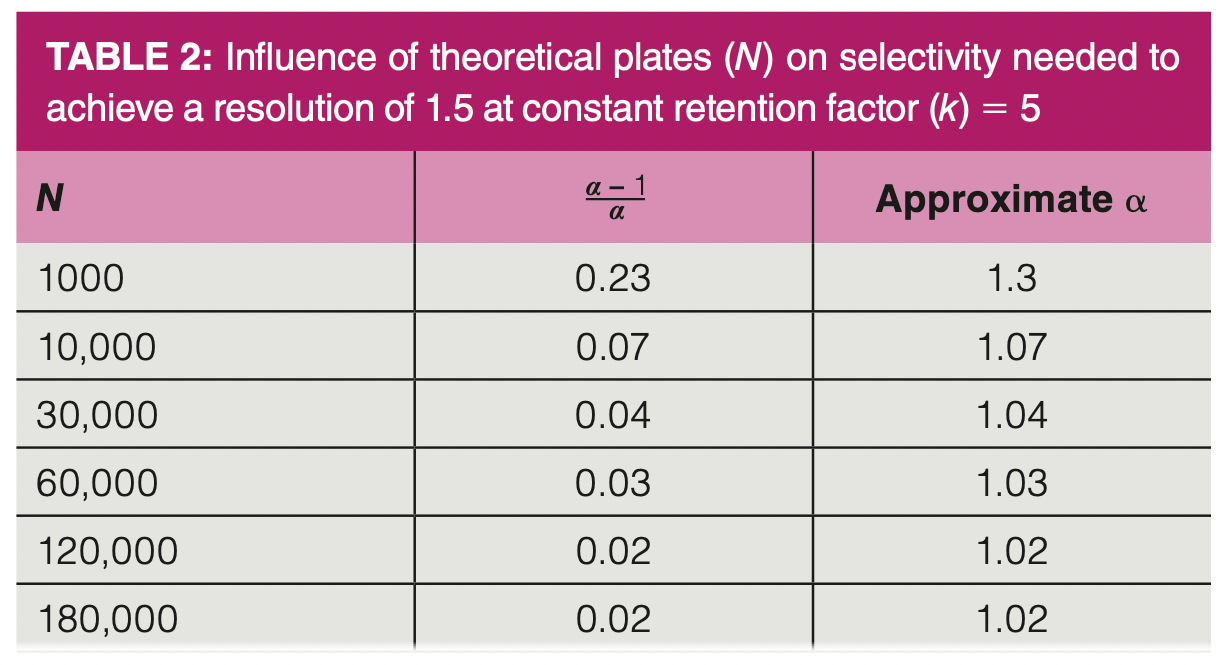
As seen in Table 2, as N increases, often by using a longer column or one with a smaller inside diameter or stationary phase film thickness, the required selectivity to achieve a resolution of 1.5 decreases, as expected. Remember that an increase or decrease in N, if achieved using column length, will result in a similar change in retention time. The two extremes in Table 2 are most interesting. At very low N, as in classical packed columns or very short capillary columns, much higher selectivity is required to achieve separation. This is one reason why there were hundreds of available stationary phases for packed columns when they were in wide use. This is also one reason why we have seen much attention in the literature over the past two decades paid to stationary phase choice in second dimension columns for comprehensive two-dimensional gas chromatography, as these columns are very short, so high selectivity is needed to achieve any separation at all (4).
At the high end, the necessary selectivity continues to decrease with increasing N, but the return for using a longer or more difficult to use column decreases, with selectivity of approximately 1.02 being about the practical limit for most capillary column configurations. This implies, with an approximate 10 min adjusted retention time, a minimum separation of the peak maxima of about 0.2 min (about 10 s).
Looking now at selectivity and retention, Table 3 shows determinations of the needed selectivity to achieve a resolution of 1.5 with constant N = 60,000 (a typical capillary column) and k, the retention factor, varying from 1–20. As in Table 2, the selectivity term on equation 2 was determined by rearranging equation 2 and the approximate selectivity needed was then read from Table 1. As k increases, the necessary selectivity to achieve baseline resolution decreases, but not dramatically. In most cases with this typical column of 60,000 theoretical plates, the necessary selectivity remains in a tight range of about 1.03–1.05. At k < 1, which is not advisable as a small variation on k can lead to a large shift in resolution, much higher selectivity is needed. At k > 20, which is not advisable as the retention times become excessively long and band broadening may make the peaks too short and more difficult to detect, there is not much influence from longer retention on selectivity.
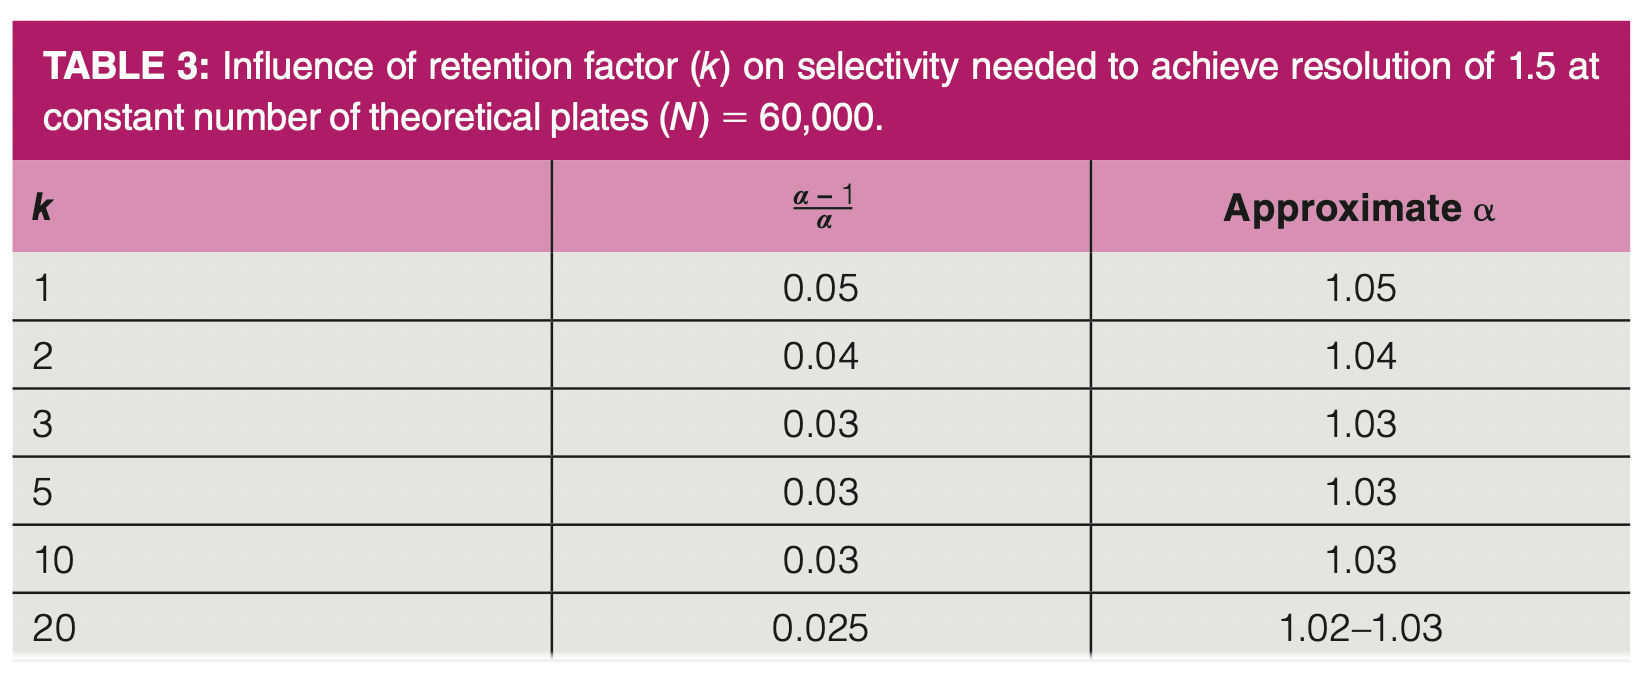
In most of the situations seen in Tables 2 and 3, the necessary selectivity to achieve baseline resolution varies from about 1.02–1.05. We can think of this as a “sweet spot” for selectivity in capillary gas chromatography. Estimating a 10 min separation and k = 5, this means a minimum spacing between peak maxima of about 10–20 s, which is commonly seen in many separations.
Influence of Temperature on Selectivity and Resolution
Figure 2 shows a series of simulated chromatograms of a separation of benzene and ethanol on a polyethylene glycol (PEG) stationary phase using Pro-EZGC. Temperature ranges from 70–110 °C with isothermal conditions, and the chromatograms are annotated with the resolution. As discussed in last month’s column (5), selectivity derives from differences in the standard free energy of the mobile phase-stationary phase transition, which is in turn determined by the intermolecular forces that exist between the analyte and the stationary phase. As the temperature increases, the forces of attraction between the analyte and stationary phase decrease as the vapour pressure increases and more of the analyte molecules enter the vapour phase. This is seen in the reduced retention times. Since selectivity is based on differences in these forces, it follows that the strength of each analyte’s forces would decrease at a different rate as the temperature is increased. This effect is clearly seen in Figure 2, as benzene elutes first at the lower temperature, then they are coeluted, and then ethanol is eluted first at the higher temperature. All of these separations were simulated with constant column dimensions and stationary phase.
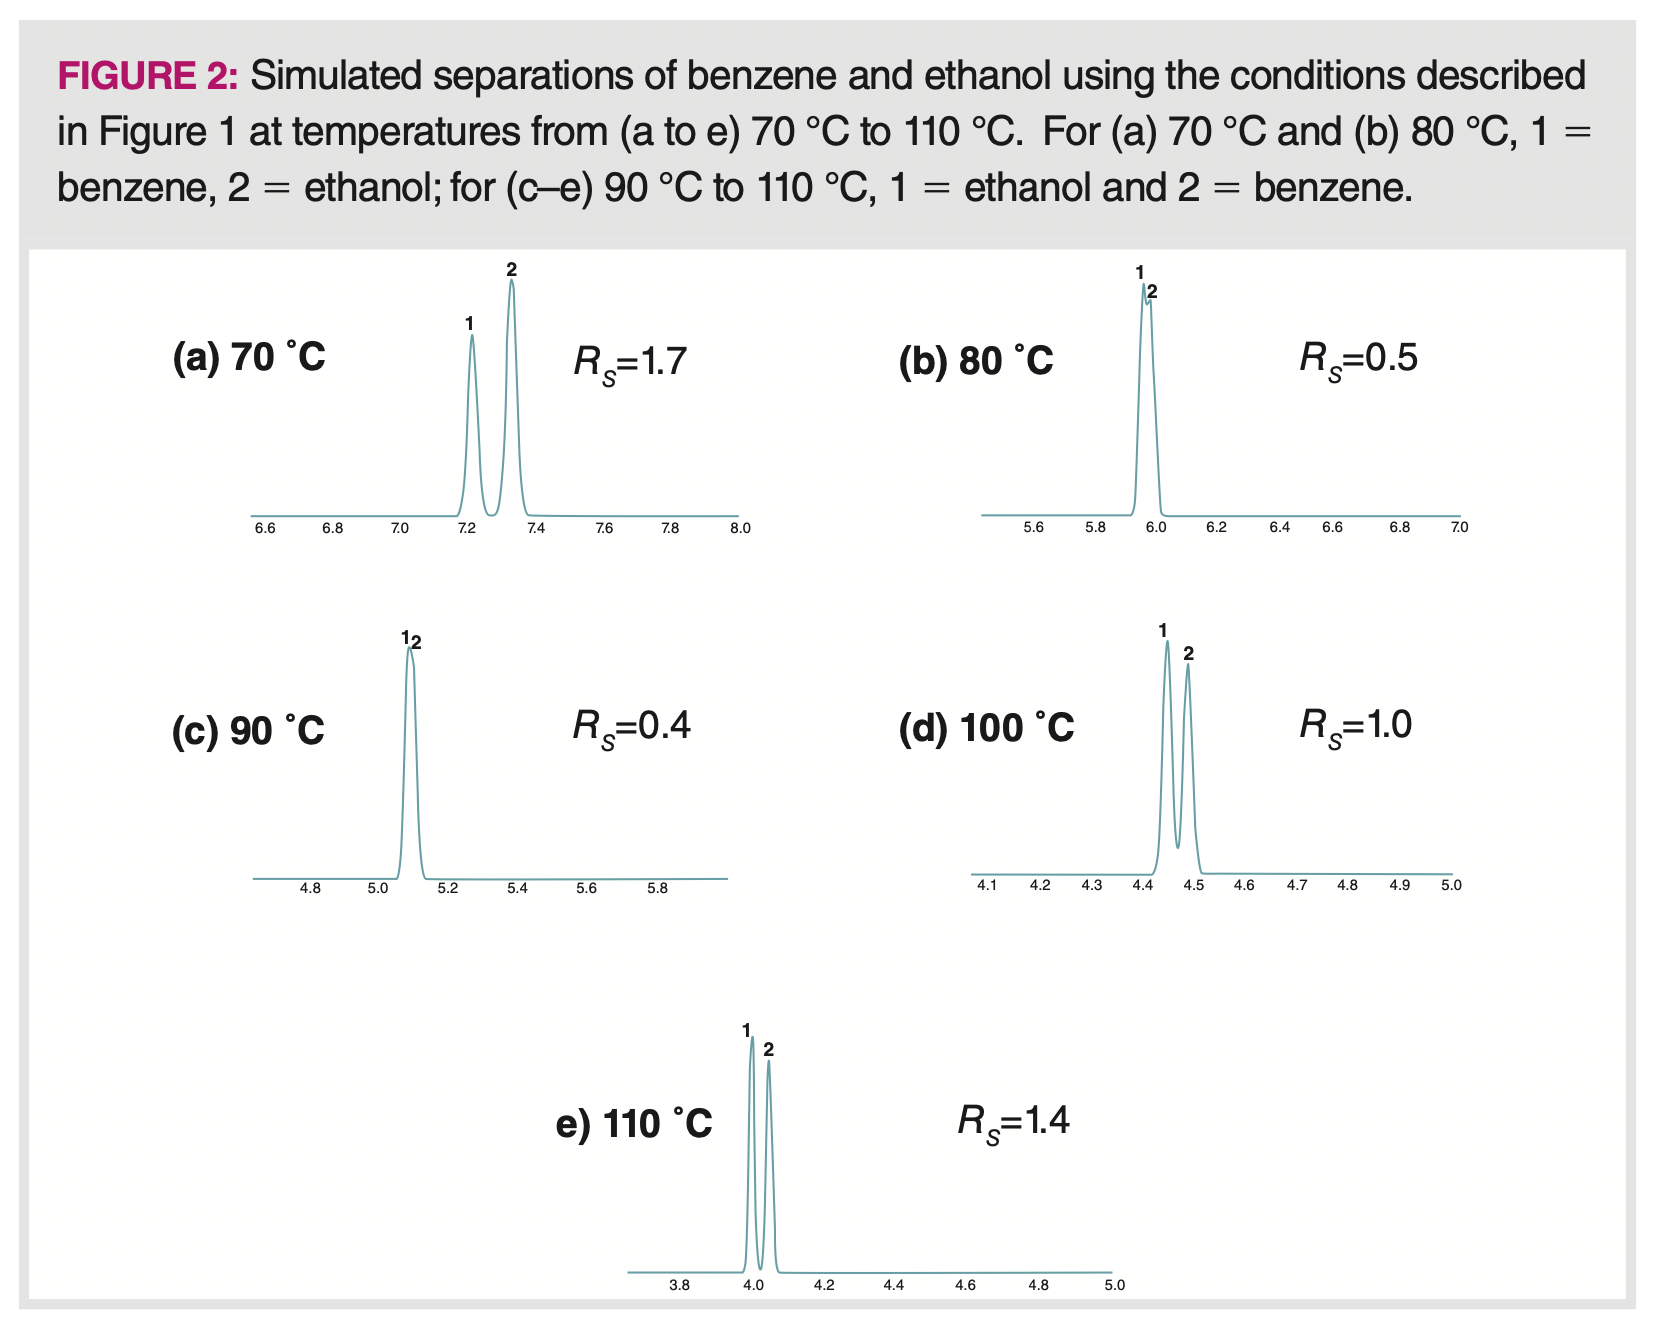
In equation 2, temperature has effects on all three terms. In Figure 2, in addition to the effects on selectivity, we see the clear effect on retention, lowering retention time and retention factor, and lowering the retention term in equation 2. The effect of temperature on the engineering term and N, the number of theoretical plates, is complex, but, in short, higher temperature generally leads to smaller N, through reduced retention factor, which is an important term in the classical van Deemter equation.
Influence of Stationary Phase Choice on Selectivity and Resolution
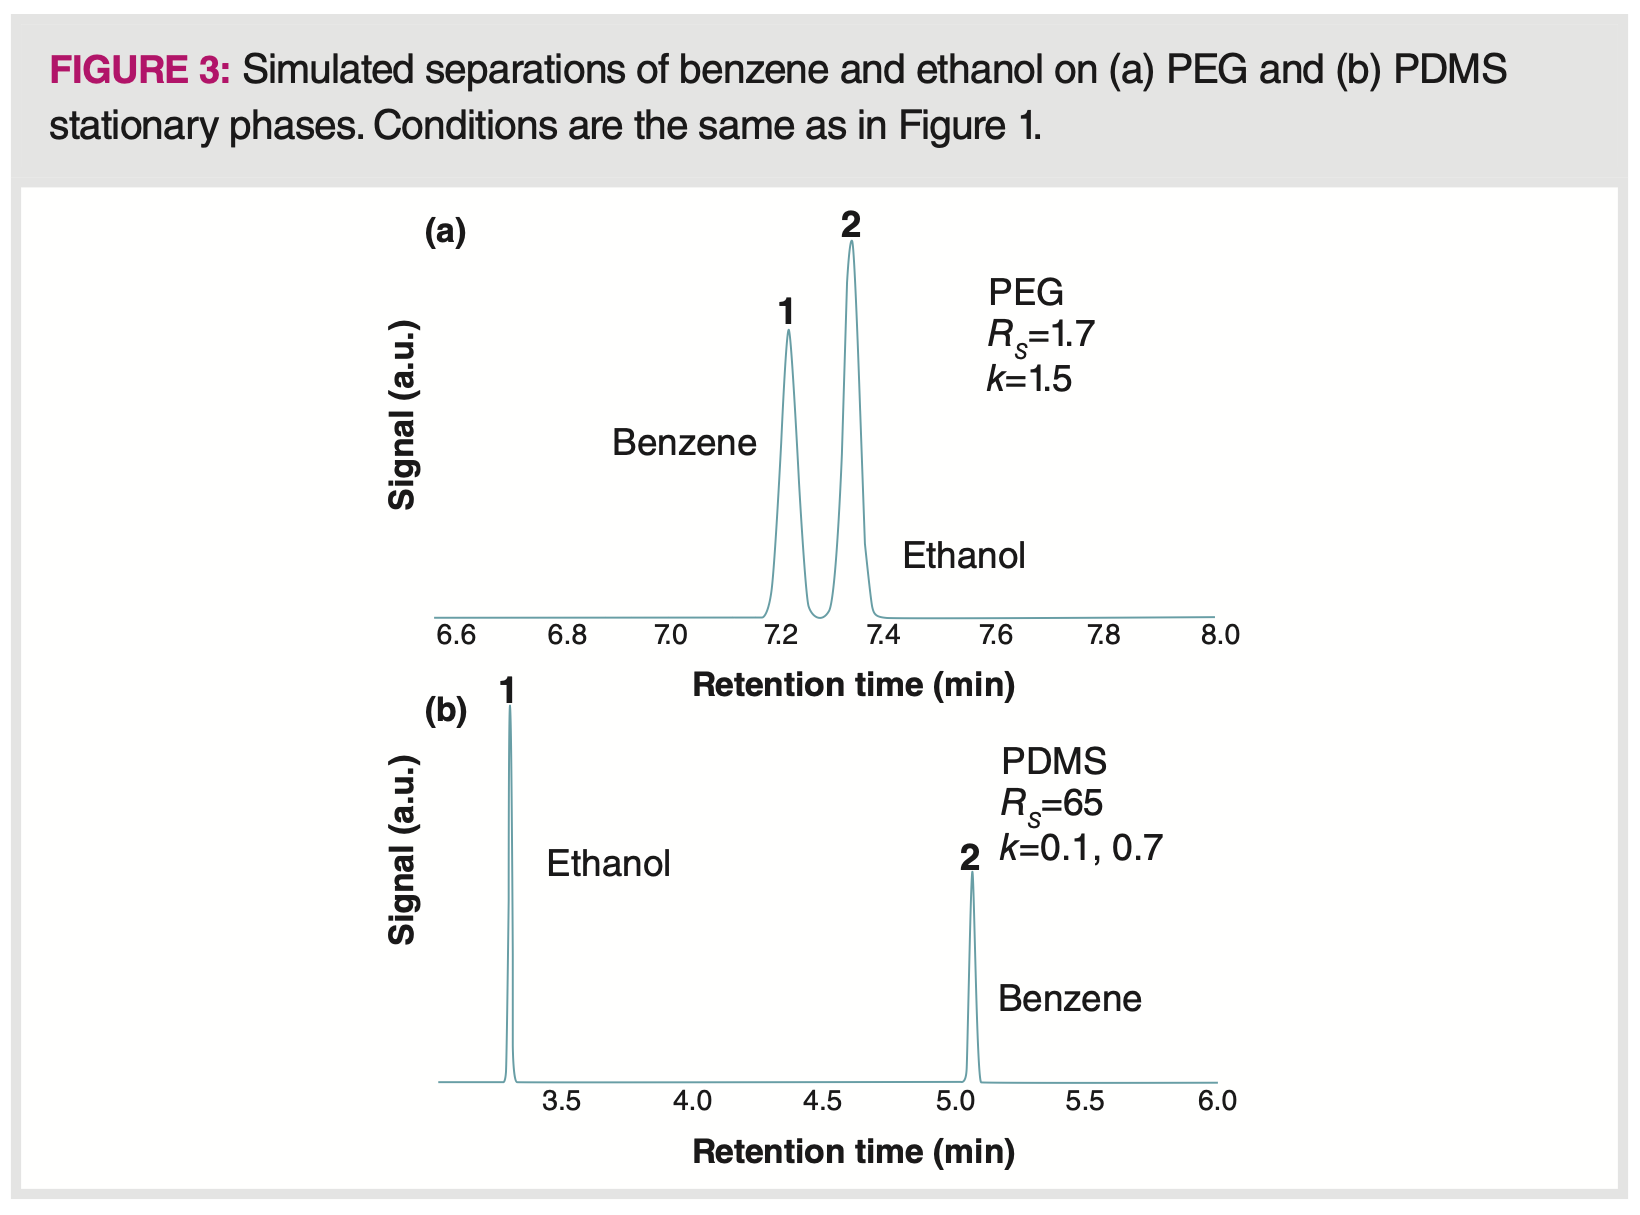
Stationary phase choice is the major driver of selectivity and a change in stationary phase can often have dramatic and confusing effects on analyte retention and peak spacing. Figure 3 shows the dramatic difference in the separation of benzene and ethanol on two stationary phases: polydimethyl siloxane (PDMS), which is generally considered nonpolar, and polyethylene glycol (PEG), which is considered polar. The separations were simulated at 70 °C, and all of the other conditions and column dimensions were kept identical so the chromatograms are directly comparable. More detailed discussion about the differences in retention for these two compounds on these two stationary phases can be found in last month’s column (5). On the PEG stationary phase, both compounds are more strongly retained than on PDMS, yet the selectivity and, consequently, the resolution is much lower. The longer retention on PEG also leads to broader peak width, showing the effect of engineering. The somewhat higher value of k has little influence on the selectivity.
Conclusions
Selectivity, a measure of the ability of a stationary phase to perform a given separation, mainly derives from the intermolecular interactions that occur between the stationary phase and the two analytes that make up a closely eluting peak pair and the separation temperature. Resolution, the goal of any separation method, is a function of retention, selectivity, and engineering of the system. Selectivity influences resolution, as seen in the master resolution equation, which can be used conceptually to analyze the impact of retention, engineering, and selectivity on resolution. Finally, we should note that this is conceptual thinking based only on isothermal separations. The situation with temperature programming is far more complex and will be the subject of a future column.
References
- Restek. Pro EZGC Chromatogram Modeler. https://ez.restek.com/proezgc (accessed 2023-02-01).
- CHROMacademy. GC Chromatographic Parameters. https://www.chromacademy.com/channels/gc-training-courses/principles/gc-chromatographic-parameters/ (accessed 2023-02-01).
- Snow, N. H. Is Golay’s Famous Equation for HETP Still Relevant in Capillary Gas Chromatography? Part 2: Assumptions and Consequences. LCGC Europe 2022, 35 (2), 57–61. DOI: 10.56530/lcgc.na.mm7085y7
- Stefanuto, P-. H.; Focant, J-. F. Columns and Column Configurations. In Basic Multidimensional Gas Chromatography; Elsevier, 2020.
- Snow, N. H. Using Thermodynamics and Simulations to Understand Selectivity and Retention in Gas Chromatography. LCGC Europe 2023, 36 (2), 58–62. DOI: 10.56530/lcgc.na.bf1581b9
Nicholas H. Snow is the founding endowed professor in the Department of Chemistry and Biochemistry at Seton Hall University, USA, and an adjunct professor of medical science. During his 30 years as a chromatographer, he has published more than 70 refereed articles and book chapters and has given more than 200 presentations and short courses. He is interested in the fundamentals and applications of separation science, especially gas chromatography, sampling, and sample preparation for chemical analysis. Direct correspondence to: amatheson@mjhli

New Study Reviews Chromatography Methods for Flavonoid Analysis
April 21st 2025Flavonoids are widely used metabolites that carry out various functions in different industries, such as food and cosmetics. Detecting, separating, and quantifying them in fruit species can be a complicated process.
University of Rouen-Normandy Scientists Explore Eco-Friendly Sampling Approach for GC-HRMS
April 17th 2025Root exudates—substances secreted by living plant roots—are challenging to sample, as they are typically extracted using artificial devices and can vary widely in both quantity and composition across plant species.

.png&w=3840&q=75)

.png&w=3840&q=75)


.png&w=3840&q=75)


.png&w=3840&q=75)


