HILIC and Its Applications for Biotechnology, Part I
LCGC North America
Answers to common questions about HILIC, and an overview of its application to biopharmaceutical analysis.
What is hydrophilic interaction liquid chromatography (HILIC)? How does it operate? What types of columns are now commercially available? What sort of mobile phases are commonly used for biopharmaceuticals? What detection modes are most compatible with its operations? What are the advantages or disadvantages of using HILIC for this class of analytes?
The intent of this column is to provide an up-to-date summary of the specific applications, already described in the scientific, technical, or commercial applications literature, that are relevant for using hydrophilic interaction liquid chromatography (HILIC) in biopharmaceutical applications and characterizations. Such applications could be saccharides (glycans; mono-, di-, oligo-, and polysaccharides) and glycoproteins, glycoprofiling, intact biopharmaceuticals (proteins, peptides, antibodies), peptide mapping, oligonucleotides, amino acids, polar basic compounds, small molecules or drugs, antibiotics, glycopeptides, metabolites, marine toxins, and related topics. It is our intention to emphasize only those specific applications relevant to the biopharma industry and biotechnology. As such, we will not discuss topics wherein HILIC does not provide serious advantages over other, current high performance liquid chromatography (HPLC) separation modes for those applications. Thus, HILIC has no obvious advantages in analyzing intact antibodies or very large proteins, even if these are heavily glycosylated. On the other hand, HILIC has some very clear advantages in comparison with reversed-phase HPLC when analyzing for low-abundance molecules such as free glycans derived from various biopharma samples. It has also proven useful in glycomics studies and in the analysis of smaller glycopeptides — for example, when one is trying to resolve them from other nonglycopeptides in a complex peptide digest from a large protein. So, why use HILIC for biopharma applications?
Some Questions About HILIC
In this section we address some questions regarding HILIC: What is HILIC? How does HILIC operate? What types of columns are now commercially available? What mobile phases are commonly used for biopharmaceutical related analytes? What detection modes are most compatible with HILIC operations? What are the advantages or disadvantages of using HILIC for biotechnology-derived analytes or applications?
HILIC is a subset of conventional HPLC (including ultrahigh-pressure liquid chromatography [UHPLC]) that has been around for several decades. Only within the past decade or so has HILIC gained a lot of followers and commercial development of new and novel stationary phases (1–3). Indeed, several companies introduced UHPLC and superficially porous HILIC columns in 2013 as high efficiency columns, designed for retention of extremely polar analytes and having orthogonal selectivity versus C18 columns (1–8). Some of these columns comprise solid-core particles, 1.6 µm in diameter with a thin shell of porous, bonded phase of an undisclosed nature, by and large. There are already a large number of pharmaceutical and biopharmaceutical applications available at the vendors' web sites (Agilent Technologies, Thermo Fisher Scientific, Nacalai Tesque, Merck SeQuant, PolyLC, Waters, and others). There are a number of review articles, books, and individual scientific or technical articles that are useful for learning the basics and that describe advanced packing materials, many useful for biopharmaceutical applications (9–14). Finally, the number of papers appearing per year, determined as of November 2012 using the American Chemical Society's (ACS) SciFinder Scholar software, showed a constant increase from 1991 to 2012 to about 300.
Wikipedia defines HILIC as follows: Hydrophilic interaction chromatography (or hydrophilic interaction liquid chromatography, HILIC) is a variant of normal-phase liquid chromatography that partly overlaps with other chromatographic applications such as ion chromatography (IC) and reversed-phase liquid chromatography (12). HILIC uses hydrophilic stationary phases with reversed-phase eluents (water-miscible organic solvents, in the presence of a minor amount of water). The name was suggested by Dr. Andrew Alpert in his 1990 paper on the subject (15). He described its chromatographic mechanism as liquid–liquid partition chromatography, where analytes are eluted in order of increasing polarity, a conclusion supported by a review and re-evaluation of published data (16). As such, HILIC is clearly seen as a region of the HPLC partition universe, applied to compounds with a negative Log P value, whereas reversed-phase LC (without pairing agents) is suitable for those compounds with a positive Log P value. In other words, HILIC separates by polar differences and reversed-phase LC separates by nonpolar differences.
Wikipedia also nicely describes some of the variations that have arisen since the initial introduction and discussion of HILIC such as electrostatic repulsion hydrophilic interaction chromatography (ERLIC), cationic electron interaction HILIC (eHILIC), anionic eHILIC, zwitterion chromatography–hydrophilic interaction liquid chromatography (ZIC-HILIC), and others. Many of these variations were also introduced by Alpert. Figure 1 contains a visual description of how HILIC operates, using a combination of hydrophilic partitioning, hydrogen bonding, and electrostatic interactions. As shown, there is no need to use solvents that are not miscible with water, and many mobile phases start with mostly organic (70%) and lesser amounts of water, but gradually increase the water content, if done in a gradient mode. Many HILIC separations, especially for small molecules, are successfully performed under isocratic conditions.
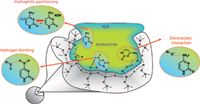
Figure 1: Diagram of the HILIC mechanism. At least 3% of water is required to produce HILIC retention. (Figure inspired from "Comprehensive Guide to HILIC," www.waters.com, and reproduced in an LCGC, Thermo Scientific webinar, Tuesday, January 29, 2013. Reproduced by permission of the speaker, Davy Guillarme.)
HILIC is a type of normal-phase HPLC or UHPLC, but only if one defines it as involving a polar surface and a relatively nonpolar mobile phase. However, the term "normal phase" best describes adsorptive, nonaqueous chromatography using water-immiscible organic solvents (even though there is a variable amount of retained water on the column surface, which influences the separation by polar differences, but to a lesser degree than in HILIC). It is most often used for isomer separations of organic soluble species, where the dominant force is the adsorption to the physical surface, rather than a partitioning into a phase. Therefore, it is more accurate to refer to HILIC as partition chromatography, allowing one to evaluate the various chemical potentials that affect partitioning relative to reversed-phase partitioning. It can operate with a very wide variety of commercial stationary phases of varying dimensions and chemistries. It is complementary or orthogonal (perpendicular) to reversed-phase LC, which separates hydrophobic analytes very nicely but does not do as well with hydrophilic species. Whereas reversed-phase LC has hydrophobic ligands bonded to the (usually) silica support and uses a gradient or isocratic mobile phase of water with an organic modifier that increases in concentration during the gradient, HILIC operates in an inverse way. In HILIC, hydrophilic compounds tend to be eluted later and hydrophobic ones earlier, whereas the opposite is true in reversed-phase LC. The techniques are truly orthogonal, which means that using them together or in tandem (also known as two-dimensonal LC [2D LC]) is an advantageous approach over using just one such mode, especially for complex mixtures of analytes, both hydrophobic and hydrophilic. HILIC also often uses a silica support, sometimes functioning alone as the stationary phase or with a polar bonded surface chemistry. Bonding silica with a polar surface chemistry controls the number of secondary interactions and results in a more stable separation, the lack of which gave rise to reversed-phase LC in the first place, and which is still the main criticism of raw silica, HILIC-type separations (17,18). Polymers with functional groups are also capable of HILIC separations, as long as the polymer bed does not collapse from the rapid changes in mobile-phase polarity.
Typical bonded phases include amino (for example, aminopropyl) or anionic species, amide, cationic, zwitterionic bondings, diol, cyanopropyl, fluorophenyl, and many others. There are, in reality, a very large number of possible and probably useful stationary phases, but these are perhaps the most fundamental types. Of course, within the group of amide or cationic bonded phases (and others), there can be dozens of variations. Thus, while the theoretical number of polar stationary phases one can imagine is vast, understanding of the mechanisms involved in partitioning demystifies the results (16–18).
Mobile phases are almost always water with (water-miscible) organic modifiers such as acetonitrile, tetrahydrofuran, dioxane, alcohols, and others. This has contributed to HILIC being referred to as "aqueous normal-phase" chromatography, although this is a linguistic artifact and a disservice to understanding of the dynamic nature of the forces affecting the overall separation. In a typical gradient elution format, one starts with a relatively high concentration of the organic modifier to retain the polar analytes, and then gradually increases the amount of water or (organic soluble) buffers present to elute, one by one, the less polar and then, more polar analytes in separate, distinct peaks but in as short a period of time as feasible and practical, so as to obtain baseline resolution of each species in the original sample for identification and quantitation. HILIC is very compatible with all forms of detection, especially with mass spectrometry (MS), which makes it all the more useful for glycan analyses or glycopeptide profiling and characterizations. This is very useful, considering that the LC–MS detectability can be up to 100 times better (lower) than that found in reversed-phase LC, because of the volatility of the mostly organic mobile phase. The mobile phase also uses a variety of additives, usually ionic salts, such as ammonium acetate or formate, to control the mobile-phase pH, ionic strength, and ionic form of the analytes. Often, buffers are used in the mobile phase to ensure that the analytes are eluted as single species, which does not happen to a sufficient extent with a nonbuffering acid and explains why peaks are broader without a buffer present. Some buffered mobile phases can present problems in high concentrations to the mass spectrometer. Nonvolatile ones must first be removed or suppressed (as in ion chromatography), before introduction into the MS system. The concentrations of buffers for HILIC are much less than for the ion exchange of ionic analytes, and thus can be introduced into the MS system if they are volatile enough. All ions in the mobile phase will naturally partition into the stationary phase to some extent. An occasional flushing with water of the HILIC column is often required to ensure a reproducible, stationary phase, and also good reproducibility of the basic analysis with each sample. Similarly, having the same counterions in the sample as are in the solvents, minimizes the splitting of peaks from on-column, counterion-exchange or ion-pair elution.
Something needs to be said about the underlying mechanisms of separation in simple HILIC modes, which is quite distinct from mixed-mode columns such as ZIC-HILIC or ERLIC, as shown in Figure 1. The common belief is that the mobile phase actually forms a preferably water-enhanced surface on the polar stationary phase as contrasted with the water-deficient mobile phase. That is, at the start of gradient elution, the stationary phase has a higher percent composition of water than the eluting mobile phase. However, this changes as the gradient progresses in higher and higher percentages of water versus the organic component. This competition for the analytes, which are very hydrophilic, in favor of the stationary phase, at the outset, leads to adsorption and partitioning. Thus, the analyte becomes distributed between the two layers, but preferably is retained on the stationary phase. It is not just simple partitioning involved, but also hydrogen donor interactions between the neutral, polar analyte species, as well as weaker, electrostatic mechanisms under the higher organic solvent conditions used for initial retention and then gradient elution of all the hydrophilic species in the sample. Thus, normal HILIC operates differently than ion-exchange chromatography (IEC) where analytes are retained mostly by electrostatic interactions. In HILIC, the more polar analytes have a stronger interaction with the stationary aqueous layer on the stationary phase than the less polar compounds. Thus, a separation based almost entirely on a compound's polarity, hydrophilicity, and degree of solvation occurs. This is quite distinct from IEC. Figure 2 summarizes the hypothetical partition mechanism of HILIC (17–19).
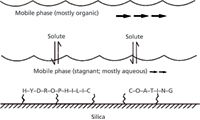
Figure 2: Diagram of the hypothetical partition mechanism of HILIC. (Adapted with permission from A.J. Alpert.)
There are several real advantages in using HILIC compared to reversed-phase LC. For example, HILIC is used extensively for the separation of various biomolecules (large and small, high and low molecular weights), organic and inorganic molecules, by differences in their polarity, mainly. It has found widespread applications for metabolites and other biological samples, which usually contain polar groups. For example, Figure 3 illustrates the ability of ERLIC to resolve peptides differing in one amino acid, Asp versus isoAsp, whereas reversed-phase LC is unable to resolve these same two species (20).

Figure 3: Comparison of reversed-phase LC versus ERLICâMS-MS for characterization of deamidated peptides (specific conditions given in original publication). (Adapted with permission from reference 20.)
It is also particularly suitable for glycosylation analysis (also known as glycoanalysis or glycoprofiling) and quality assurance of glycoproteins and glycoforms in biological, medical products. When used for the detection of polar compounds in biological samples, often using electrospray ionization (ESI)-MS for detection, HILIC usually offers a 10–100-fold increase in sensitivity over typical reversed-phase LC. This is because the organic solvent used in HILIC for the actual separations contains higher levels of acetonitrile, which is much more volatile than water (12).
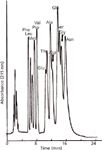
Figure 4: HILIC separation of amino acids. Column: 200 mm à 4.6 mm PolySulfoethyl Aspartamide (PolyLC Inc.); mobile phase: 5 mm TEAP (pH 2.8) in 80% acetonitrile. Order of elution: least to most polar. (Adapted with permission from reference 15.)
Finally, let's say something about the "typical" peak shape for many (not all) analytes under HILIC conditions. Figure 4 illustrates a very early report of using HILIC, with conditions as indicated, for a mixture of amino acids (15). Peak shapes are quite broad by comparison with modern UHPLC or HILIC chromatograms, and there is a good deal of tailing. Peak shape is a function of many variables, such as molecular size or shape, molecular weight, number of hydrophilic moieties per molecule, ionic nature, organic solvent solubility, hydrophilicity, nature of mobile or stationary phases, and pore or particle sizes. Figure 5 illustrates a combination of both reversed-phase LC and HILIC, where under reversed-phase LC conditions, complex mixtures of glycopeptides are not resolved (bottom chromatogram). However, if a very broad peak from the reversed-phase LC chromatogram (red or blue) is isolated and injected onto the indicated HILIC column, it is very nicely resolved into a complex mixture of glycopeptides. In this instance, adjacent peaks differ by one carbohydrate residue or position. This is conventional reversed-phase LC or HPLC and not the more modern UHPLC in a HILIC format. However, the point is that all of the peak shapes under these particular HILIC conditions are quite broad and tailing, often with incomplete baseline resolution, low peak capacity, and a total time required of >40 min, which is hardly competitive with modern HILIC elution times or conditions. In general, this has been the Achilles heel of earlier approaches to HILIC, which made it less attractive than reversed-phase LC but not for glycopeptides or glycans, where early and incomplete elution was usually the problem. We will say more later on about the more modern UHPLC HILIC approaches and chromatograms for similar glycopeptides and glycans derived from glycoproteins or their variants.
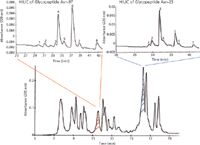
Figure 5: Reversed-phase LCâHILIC purification of variant glycopeptides from a tryptic digest of gamma-interferon from a Chinese hamster ovary cell culture. Reversed-phase column (lower chromatogram): Vydac C18. HILIC column (Grace Vydac) (upper chromatograms): 150 mm à 1.0 mm PolyHydroxyethyl A (PolyLC Inc.). (Adapted with permission from reference 19.)
Tailing peaks are often indicators of multiple modes of separation, and are not inherent to a particular form of chromatography. Broad HILIC peaks are not the norm, but represent incomplete control of the variables contributing to the overall separation. One can obtain narrow, sharp peaks in HILIC, quite comparable to reversed-phase LC, if one addresses the causes of peak broadening. Most often, it is inadequate buffering of highly ionic species or a pH too close to the pKa of the offending, functional group in the analyte, so that it actually exists in more than a single, ionic form. If a sample is not ionic, but the peaks are broadened, then poor solubility may be a contributing factor, and one should select a better, water-miscible organic solvent. Or, one can add an organic solvating agent such as trifluoroethanol or hexafluoroisopropanol in a fixed amount to both mobile phases. If the sample is ionic and adequate buffer is present, but broadened peaks are observed, then counterion ion-pair exchange of the analyte's ion pairs is most likely the problem. The addition of the sample in the same buffer as the mobile phase, or at least an excess ratio of that ionic component, will often restore sharpened peaks. Alternatively, the use of an ionic column surface of the same charge as the offending functional group will reduce its influence on the separation and eliminate the tailing it has caused.
Specific Applications of HILIC for Glycoprofiling, Glycan Analysis, Carbohydrates, and Glycomics
Perhaps the single most significant application wherein HILIC has provided serious advantages in reproducible resolutions, UV–fluorescence–MS identification of tagged or untagged species, and trace detection with absolute identification of structures, has been glycan analysis (also known as glycoprofiling). Glycans are carbohydrates of various types, complexities, and branching, and are found at varying levels in glycoproteins and antibodies. Most, if not all, antibodies and all glycoproteins have different types and levels of glycans that are either N- or O-linked. All glycoprotein or antibody biopharmaceuticals contain such attachments, and they are, by and large, what make up post-translational modifications (PTMs) (21–24). They are probably the single most important type of PTMs, and the ability to generate true biogenerics or biosimilars of glycoproteins hinges, often entirely, on being able to precisely and quantitatively duplicate the nature, location, and levels of all the various glycans present at specific, amino acid locations on the proprietary glycoprotein biopharmaceutical. Hence, our ability to determine, with precise accuracy, precision, and quantitation the glycoprofile of any glycoprotein is paramount in demonstrating the reference standard's correct structure, and to successfully produce a true, biogeneric version.
This ability has led many people to help in the successful development of new and improved analytical approaches for characterizing and quantitating the glycoprofile of any and all glycoproteins (25–30). These six references are only the tip of the iceberg with regard to how much work has been described and is ongoing in optimizing glycoprofiling, and just for glycopeptides, glycoproteins, or antibodies. The entire field of glycomics also relies on being able to accurately and precisely identify the structures of any number of glycans and to quantitate with accuracy and precision (26). There are numerous research groups around the world now pursuing such studies, and some important names are Reinhold, Costello, Zaia, Harvey, Orlando, Hancock, Karger, and Rudd. But here we are interested more in how modern HILIC can be applied today for isolating, identifying, and quantitating individual glycans, as in a typical, glycoprofile. There are, of course, any number of "academic" literature reports in this field too, but perhaps the most information and practical technical advances have come from the vendors of HILIC columns and ancillary supplies or instrumentation (31,32). Each of these references contains additional literature citations to relevant works of others. All of the major vendors have application notes available, free of charge, in hard copy or electronic versions, almost always on-line for immediate downloading or studying. (A brief aside, when Krull was a graduate student in the mid-1960s, copy machines and personal computers did not exist. Today students are able to download any literature in an instant without leaving the office desk — it's just amazing!)
In successful glycoprofiling, we have a very wide choice of techniques and methods, but they all rely on certain specific steps:
- purification of the individual glycoprotein of interest;
- enzymatic or chemical release of N- or O-linked glycans and separation or cleanup from the remaining peptide or protein;
- cleanup and tagging of all the now-released glycans with high recovery and separation of excess tagging reagent;
- choice of using permethylation (gas chromatography [GC]–MS or LC–MS) or commercial, UV and fluorescent tagging reagents (2-AB, 2-AA, 2-AP, 6-AQC, 2-aminoacridone, procainamide, and so on) (32);
- choice of cleanup of tagged glycans to remove excess reagent, perhaps using the GlycoProfil Glycan Cleanup cartridges (G4548) from Sigma-Aldrich or products from other vendors (31,32);
- and then the choice of HPLC or UHPLC column, dimensions, and mobile phase, all of which have already been developed and optimized by most, if not all, vendors of such columns or supplies (for example, Waters, Agilent, Thermo, Merck SeQuant, and others).
Basically, HILIC has become the preferred analytical column for almost all glycoprofiling work, and older approaches such as permethylation and GC–MS or reversed-phase LC, IC, or IEC have largely been displaced. If you will recall, in June of this year, Waters introduced its newest UHPLC column line and one of these is a HILIC column. Most vendors now promote solid-core particle columns, also known as pellicular type columns, though the older, totally porous particle UHPLC columns of the original Waters variety are still available (33–37). Even nanoLC columns of the solid-core, HILIC variety are commercially available today (34). It is crucial when analyzing glycans to be able to efficiently separate all isomeric and branching variants present within the given sample to achieve maximum structural elucidation by MS or other detectors. And, it is also often necessary to be able to identify each such glycan, unambiguously, and to quantitate its level in the original glycoprotein with good accuracy and precision. These are not trivial pursuits.
Given that most of the required steps for pursuing true glycoprofiling are now commercially available, even as far as being able to purchase authentic reference standards of virtually all glycans expected to be present in commercial recombinant glycoproteins or antibodies (for example, those from Sigma Aldrich, Waters Corporation, and Agilent Technologies, and from academic sources such as P. Rudd at the Institute for Bioprocessing Research and Training [NIBRT] in Dublin, Ireland) (37–39), it seems fairly straightforward to perform true glycoprofiling today, using the very latest HILIC approaches. Let's take a look at some typical results now possible using such approaches with specific applications. We should note that there are, quite often, several goals in glycoprofiling: Which glycans are present? On what specific amino acids on the glycoprotein are they located? What are the various levels or amounts of each glycan derived from a known amount of the precursor glycoprotein? What is the total HILIC picture or chromatogram of the total glycan profile? One useful answer to the question of which glycans are present is derived by having authentic reference standards of each possible species that might be present on one's glycoprotein and comparing these authentic reference standards to the HILIC chromatogram for one's own mixture of derived glycans, peak by peak, by injecting reference standards alone or together with one's glycoprofile. Another very common approach in use today is to optimize the resolution of all glycans present by HILIC and then introduce the resolved glycans into a suitable matrix-assisted laser desorption–ionization time-of-flight mass spectrometry (MALDI-TOF-MS) system (via fraction collection) or (by direct interface) ESI-MS system. There are any number of suitable mass spectrometers commercially available for such pursuits. And, virtually all of the expected, known glycans already have their mass spectra available through the literature or reference compilations. The answer to true, absolute quantitation can be via a standard calibration plot and HILIC–UV or HILIC with fluorescence detection or by using deuterated analogs at known levels spiked into one's glycoprofile before analysis by LC–ESI-MS. Again, all of these analytical methods have already been developed and optimized; it is but a matter of choosing which HILIC vendor, tagging reagent, sample cleanup kit, detectors to use (fluorescence or MS), and then which optimized HILIC conditions fit one's own particular mixture of glycans. This is all already described in either the scientific or commercial literature, as stated above.
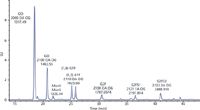
Figure 6: Analysis of N-glycans from monoclonal antibodies. (Adapted with permission from reference 31.)
So, back to looking at typical, modern HILIC chromatograms from the column vendors to see what is possible with various mixtures of glycans. Let me reiterate the basic steps involved in doing such glycoprofiling today: The glycoprotein is first denatured with suitable surfactant and reagents, PNGase F/G, or chemical reagents to release glycans (hydrazine, guanidine–base), and so on; removal of protein using (for example) HILIC multiwell cleanup and elution plates to retain glycans; 2-AB labeling of purified glycans; elution plates for removal of excess labeling reagent; isolation of purified 2-AB-labeled glycans (or other labels); and finally LC–fluorescence and either direct MALDI-MS or LC–MALDI-MS with fraction collection, or LC–ESI-MS, on-line (35). Figure 6 indicates a perhaps typical HILIC profile for a series of N-glycans derived from monoclonal antibodies (31), using a 500 mm × 2.1 mm, <2-µm dp Agilent HILIC glycan Amide column (superficially porous packing [SPP], pellicular in nature), with a mobile phase of 100 mM ammonium formate (pH 4.5) and acetonitrile in a somewhat standard gradient profile. The separation takes approximately 45 min, which is somewhat long when compared with modern, reversed-phase LC or UHPLC separations for peptide maps or small molecule drug mixtures. The issue is the requirement for baseline resolution of small glycans, having very similar chromatographic patterns and partition coefficients between the two phases in HILIC. It is, after all, just a matter of finding differences in these distribution coefficients, perhaps by varying the nature of the stationary or mobile phases, but here the analytes are extremely similar in partition coefficients. And, these particular conditions are already using UHPLC with HILIC, still requiring orders of magnitude more time to realize baseline resolution for the approximately 10 glycans, as shown in Figure 6. Figure 7 also illustrates the specific structures of all the glycans involved, as derived by using authentic reference standards, on-line MS, or other approaches. Quantitation was not indicated in this study.

Figure 7: Major structures identified from 2-AB-labeled human IgG glycans. By convention the 6-linked core mannose is on top relative to the 3-linked mannose, which is below. (Adapted with permission from reference 40.)
Another example of glycoprofiling is indicated in Figure 8 (39,40). Similar data have been presented elsewhere (41,42). In this particular case, a 2009 application of Waters UHPLC technology, an Acquity UPLC BEH Glycan column with a 1.7-µm particle diameter was compared with a traditional 3-µm dp HPLC column (40). A mixture of 2AB-labeled glycan standards found in human IgG glycoproteins was analyzed (ProZyme). The conditions used were scaled to give a constant gradient slope, while remaining within the pressure limits of the columns. Both columns were tested on the same UHPLC system to ensure the best resolution. The UHPLC column gave better resolution for more robust analytical methods, greater confidence in peak identify, and enhanced accuracy and precision. The UHPLC run time was significantly shorter, providing higher throughput analyses. There are several interesting things to compare in Figure 8, which used a Waters UHPLC column and conditions, with Figure 6, which used the Agilent SPP HILIC column. This is not a head-to-head comparison at all. But, the UHPLC results suggest, for a very similar mixture of N-glycans, substantially reduced total run times with the 1.7-µm column under UHPLC conditions, at 60 °C. The peak shapes are much better than with the 3-µm HPLC HILIC column, and the time reduction in going to UHPLC is substantial (<35 min versus ~85 min). However, these two mixtures of N-glycans in the Agilent and Waters studies appear to be significantly different. There are a very large number of similar applications available from these two vendors, as well as from many others, all using their own HILIC columns, either totally porous, sub-2-µm (Waters) or superficially porous (Waters and all others). Waters also has its own variety of SPP packings in HILIC mode now, as indicated above (2). It does not appear that these newest packings have been evaluated in comparable, glycoprofiling type studies, as in Figures 6 and 8. It is also possible that these particular packings are quite different than typical UHPLC base materials.
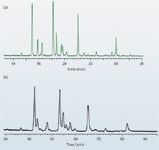
Figure 8: 2-AB-labeled glycan chromatography on (a) UHPLC and (b) HPLC columns. (a) Column: 150 mm à 2.1 mm, 1.7-dp Acquity UPLC BEH Glycan; mobile-phase A: 100 mM ammonium formate (pH 4.5); mobile-phase B: acetonitrile; gradient: 75â60% B over 46.5 min at 0.5 mL/min, 60â0% B over 1.4 min at 0.5 mL/min, 0% B for 1 min at 0.25 mL/min, 0â75% B over 1 min at 0.5 mL/min, then hold at 75% B for 13 min at 0.5 mL/min; sample concentration: 10 pmol/µL; sample volume: 1.5 µL; injection mode: partial loop; detection: fluorescence (excitation at 330 nm, emission at 420 nm). (b) Column: 150 mm à 2 mm, 3-µm dp; mobile phases: same as for (a); gradient: 75â60% B over 115 min, 60â0% B over 2 min, 0% B for 2 min, 0â75% B over 1 min, then 75% B for 25 min; flow rate: 0.2 mL/min; other conditions: same as in (a). (Adapted with permission from reference 40.)
Why is it, then, that even with these numerous types of HILIC packings on the market today, peak shapes, peak broadening, long elution times, poor peak capacity, and incomplete resolutions appear to plague glycan profiling in UHPLC or HPLC? Why is it that we do not see the same types of chromatographic profiles (short elution times, very high plate counts, high peak capacity, baseline resolutions, symmetric peaks, and so on) that are common with low-molecular-weight molecules such as conventional pharmaceuticals or related chemicals? Will we ever see such types of chromatograms for glycan analysis in the near future? It does not appear so. Glycans are often very complex, branched chains of several hundred daltons molecular weight, with numerous hydroxyl groups in various positions and configurations on small chains of five- or six-ring sizes. Plus, they often have varying degrees of branching, which is very uncommon with most other types of low-molecular-weight molecules. The conformations of glycans can change during their resolution, on column, as a function of temperature and mobile-phase conditions, which broadens peaks. Increasing temperatures usually improves peak shapes for these and other (transport, mass transfer, kinetics) reasons. Additionally, their large, branched nature makes them susceptible to steric effects (as shown in the comparison of small pore and large pore type separations). It is also the case, that simple, nonionic, neutral HILIC stationary phases permit mostly one mechanism of separation — mass transfer from the mobile phase to the water layer on the stationary phase and back (other mechanisms are accessible for these phases). It is possible to improve resolutions, whether ionic or zwitterionic, by using lower buffer concentrations (for example, <20 mM), choosing a phase of the same charge as that of the analyte so it reduces its effect on the separation (ERLIC), choosing a phase whose charge is opposite to that of the analyte to enhance its effect on partitioning (eHILIC), or using pH to protonate or deprotonate either the phase or the analyte. If the glycan structures and molecular weight are similar, then it becomes more and more difficult to resolve the glycans, under any HILIC conditions, in a short time frame with excellent peak shapes, efficiencies, resolutions, and so forth. It may be the case that simple HILIC chromatograms, such as those in Figures 6 and 8, will never show the same characteristics of HPLC or UHPLC that we typically see for low-molecular-weight conventional pharmaceuticals and related species. The issue is not one of glycan retention, as much as promoting the differences between exceedingly complex molecules, having very subtly different polarities.
Conclusions and Future Plans
This installment of "Biotechnology Today" provides a basic overview of how HILIC has become a very much accepted and practiced form of modern HPLC and UHPLC in numerous laboratories. It has also been improved and optimized by many vendors of HPLC columns and equipment, as it should. Academia has also taken a very keen and intense interest in the further development of its understanding, improvements, and further applications in biotechnology and other relevant areas. We have only, thus far, discussed the basics and mechanisms operative in modern HILIC, as well as perhaps its major application area, glycan analysis (glycoprofiling) for glycoproteins, antibodies, and related materials and applications. In part II of this series we hope to emphasize perhaps more current topics of interest in biotechnology, specifically glycopeptide and glycoprotein analysis or bioanalysis using various HILIC approaches.
Acknowledgments
The authors wish to acknowledge the technical assistance of Mr. Simion Kreimer in his preparation of the final set of figures and proofreading of various drafts. We acknowledge the generosity of Andrew Alpert in permitting us to use certain slide materials from a previous presentation or publication. We also acknowledge Dave Lentz for providing us with various slide materials and application notes from EMD Millipore.
References
(1) http://www.waters.com/waters/promotionDetail.htm?id=134747350&alias=Alias_June27_EVENT.
(2) CORTECS Columns Brochure, Waters Corporation, Milford, Massachusetts, 2013, 720004675en.pdf.
(3) J.C. Shia, M. Yabu, K.V. Tran, and M.S. Young, Waters Corporation, Milford, Massachusetts, 2013, 720004732en.pdf.
(4) Cosmosil HILIC Columns, Nacalai USA, Inc., San Diego, California.
(5) Merck SeQuant, Box 7956, SE-90719, Umea, Sweden; USA: EMD Millipore, Billerica, Massachusetts.
(6) P. Hemstrom, T. Jonsson, W. Jiang, and P. Appelblad, Merck SeQuant AB, Umea, Sweden, Application Note (2013), www.merckmillipore.com/chromatography.
(7) PolyLC, Columbia, Maryland.
(8) TSK-GEL Application Note AN23, 2010, TOSOH BioScience, King of Prussia, Pennsylvania.
(9) HILIC Solutions, Separation Science Quarterly Newsletter, Online, www.sepscience.com (2013).
(10) M.R. Gama, R.G. da Costa Silva, C.H. Collins, and C.B.G. Bottoli, TrAC 37, 48 (2012).
(11) E.S. Grumbach and K.J. Fountain, Comprehensive Guide to HILIC, Hydrophilic Interaction Chromatography, Waters Corporation, Milford, Massachusetts, 2010.
(12) www.wikipedia.org/wiki/Hydrophilic_interaction_chromatography.
(13) P.G. Wang and W. He, Hydrophilic Interaction Liquid Chromatography (HILIC) and Advanced Applications, Chromatographic Science Series, (CRC Press, Taylor & Francis Group, Boca Raton, Florida, 2011).
(14) B.A. Olsen and B.W. Pack, Hydrophilic Interaction Chromatography: A Guide for Practitioners, Chemical Analysis Series, (John Wiley & Sons, Hoboken, New Jersey, 2013).
(15) A.J. Alpert, J. Chrom. 499, 177–196 (1990).
(16) P. Hemstrom and K. Irgum, J. Sep. Sci. 29(12), 1784–1821 (2006).
(17) T. Jonsson, N.P. Dinh, and K. Irgum, "Retention and Selectivity for Hydrophilic Interaction Liquid Chromatography (HILIC) Columns: Multivariate Modeling and Correlation with Physiochemical Properties," poster presented at the 60th ASMS Conference on Mass Spectrometry and Allied Topics, Vancouver, Canada, 2012.
(18) D.N. Phuoc, T. Jonsson, and K. Irgum, J. Chrom. A 1218(35), 5880–5891 (2011).
(19) J. Zhang and D.I.C. Wang, J. Chrom. B 712, 73–82 (1998).
(20) P. Hao, J. Qian, B. Dutta, E.S.H. Cheow, K.H. Sim, W. Meng, S.S. Adav, A. Alpert, and S.K. Sze, J. Proteome Res. 11, 1804–1811 (2012).
(21) Pharmaceutical Biotechnology, Fundamentals and Applications, Third Edition, D.J.A. Crommeliln, R.D. Sindelar, and B. Meibohm, Eds. (Informa Healthcare, New York, 2008).
(22) G. Walsh, Biopharmaceuticals, Biochemistry and Biotechnology, Second Edition, (John Wiley & Sons, Ltd., England, 2003).
(23) Posttranslational Modifications of Proteins, Tools for Functional Proteomics, C. Kannicht, Ed. (Humana Press, Totowa, New Jersey, 2002).
(24) C. Walsh, Posttranslational Modifications of Proteins: Expanding Nature's Inventory, (Roberts & Co. Publishers, Greenwood, Colorado, 2005).
(25) M. Melmer, T. Stangler, M. Schiefermeier, W. Brunner, H. Toll, A. Rupprechter, W. Lindner, and A. Premstaller, Anal. Bioanal. Chem. 398(2), 905–914 (2010).
(26) S. Zhang and H. Zhang, Proteomics Clin. Appl. 6(0), 596–608 (2012).
(27) L. Mauko, A. Nordberg, J.P. Hutchinson, N.A. Lacher, E.F. Hilder, and P.R. Haddad, Anal. Biochem. 408, 235–241 (2011).
(28) H. Xie, A. Chakraborty, J. Ahn, Y.Q. Yu, D.P. Dakshinamoorthy, M. Gilar, W. Chen, St. John Skilton, and J.R. Mazzeo, MAbs 2(4), 379–394 (2010).
(29) C.W.N. Damen, W. Chen, A.B. Chakraborty, M. van Oosterhout, J.R. Mazzeo, J.C. Gebler, J.H.M. Schellens, H. Rosing, and J.H. Beijnen, Trastuzumab. JASMS 20(11), 2021–2033 (2009).
(30) A. Beck, S. Sanglier-Cianferani, and A. Van Dorsselaer, Anal. Chem. 84, 4637–4646 (2012).
(31) S. Schneider and E. Naegele, Agilent Technologies, Inc., Santa Barbara, California, Application Note 5990-9774EN, Biopharmaceuticals, 2012 (and references therein).
(32) Sigma-Aldrich, Glycan Labeling, Glycobiology Analysis Manual, 2nd Edition, GlycoProfile Products for Metabolic Glycan Labeling (or other applications), Sigma-Aldrich Co., Bellefonte, PA, http://www.sigmaaldrich.com/technical-documents/articles/biology/glycobiology/glycan-labeling.html.
(33) B.D. Prater, H.M. Connelly, Q. Qin, and S.L. Cockrill, Anal. Biochem. 385(1), 69–79 (2009).
(34) J. Freeke and V. Barattini, Application Note, 2012, Thermo Scientific, Cheshire, UK.
(35) S. Schneider, Application Note, Biopharmaceuticals, 2012, Agilent Technologies, Inc., Santa Clara, California, www.agilent.com/chem.
(36) J. Ahn, Y.Q. Yu, and M. Gilar, Application Note, June, 2008, 720002622en, Waters Corporation, Milford, MA.
(37) J. Martosella, P. Duong, and A. Zhu. Application Note, Biopharma, 2013, Agilent Technologies, Inc., Santa Clara, California, USA, www.agilent.com/chem.
(38) Glycoscience Group, National Institute for Bioprocessing Research and Training, Dublin, Ireland, http://glycogroup.nibrt.ie/.
(39) "A Systematic Approach to Glycan Analysis Using HILIC-UPLC and an Online Database of Standardized Values, Technology Brief," Waters Corporation, Milford, Massachusetts, December, 2012.
(40) Glycan Separation Technology brochure, Waters Corporation, Milford, Massachusetts, 2009, p. 7 (720002981EN, March, 2009).
(41) P. Hong, S.M. Koza, T.E. Wheat, K.V. Tran, J. Ahn, J. Turner, D. Diehl, and K.J. Fountain, poster, Waters Corporation, Milford, Massachusetts, 2012, www.waters.com/posters.
(42) J. Ahn, Y.Q. Yu, and M. Gilar, Application Note 720003238en, Waters Corporation, Milford, Massachusetts, 2010, www.waters.com
(43) J. Ahn, J. Bones, Y.Q. Yu, P.M. Rudd, and M. Gilar, J. Chromatogr. B 878, 403–408 (2010).
(44) B. Gillece-Castro, K.V. Tran, J.E. Turner, T.E. Wheat, and D.M. Diehl, Application Note 720003112EN, Waters Corporation, Milford, Massachusetts, 2009, www.waters.com.
Dr. Heckendorf has 50 years of chromatographic experience in natural products and biological separations. His company, The Nest Group ("Where Little Things Begin to Grow"), supplies and supports new, and sometimes unconventional chromatographic materials or approaches. He is currently investigating chromatographic limits on micro-SPE tip column methods and is developing data on trapping efficiency for LC–MS applications.

Dr. Heckendorf
Ira S. Krull is Professor Emeritus of Chemistry and Chemical Biology at Northeastern University, Boston, Massachusetts, and a member of LCGC's editorial advisory board.

Ira S. Krull
Anurag S. Rathore is a professor in the Department of Chemical Engineering at the Indian Institute of Technology in Delhi, India.

Anurag S. Rathore
Common Challenges in Nitrosamine Analysis: An LCGC International Peer Exchange
April 15th 2025A recent roundtable discussion featuring Aloka Srinivasan of Raaha, Mayank Bhanti of the United States Pharmacopeia (USP), and Amber Burch of Purisys discussed the challenges surrounding nitrosamine analysis in pharmaceuticals.
Regulatory Deadlines and Supply Chain Challenges Take Center Stage in Nitrosamine Discussion
April 10th 2025During an LCGC International peer exchange, Aloka Srinivasan, Mayank Bhanti, and Amber Burch discussed the regulatory deadlines and supply chain challenges that come with nitrosamine analysis.

